


ABSTRACT
We fit ∼0.1–500 MeV nucleon−1 H–Fe spectra in 46 large solar energetic particle (SEP) events with the double power-law Band function to obtain a normalization constant, low- and high-energy parameters γa and γb, and break energy EB, and derive the low-energy spectral slope γ1. We find that: (1) γa, γ1, and γb are species-independent and the spectra steepen with increasing energy; (2) EB decreases systematically with decreasing Q/M scaling as (Q/M)α; (3) α varies between ∼0.2–3 and is well correlated with the ∼0.16–0.23 MeV nucleon−1 Fe/O; (4) in most events, α < 1.4, γb–γa > 3, and O EB increases with γb–γa; and (5) in many extreme events (associated with faster coronal mass ejections (CMEs) and GLEs), Fe/O and 3He/4He ratios are enriched, α ≥ 1.4, γb–γa < 3, and EB decreases with γb–γa. The species-independence of γa, γ1, and γb and the Q/M dependence of EB within an event and the α values suggest that double power-law SEP spectra occur due to diffusive acceleration by near-Sun CME shocks rather than scattering in interplanetary turbulence. Using γ1, we infer that the average compression ratio for 33 near-Sun CME shocks is 2.49 ± 0.08. In most events, the Q/M dependence of EB is consistent with the equal diffusion coefficient condition and the variability in α is driven by differences in the near-shock wave intensity spectra, which are flatter than the Kolmogorov turbulence spectrum but weaker than the spectra for extreme events. In contrast, in extreme events, enhanced wave power enables faster CME shocks to accelerate impulsive suprathermal ions more efficiently than ambient coronal ions.
Export citation and abstract BibTeX RIS
1. INTRODUCTION
Large gradual solar energetic particle (SEP) events are believed to be accelerated via diffusive shock acceleration (DSA) mechanisms at shock waves driven by fast coronal mass ejections (CMEs) that plow through the solar corona and interplanetary medium (e.g., Reames 1999, 2013; Lee 2005; Desai & Giacalone 2016). Such large SEP events, if sufficiently intense, can significantly increase radiation levels in the near-Earth environment, thus damaging technological assets and adversely affecting the health and safety of humans in space (e.g., Desai & Giacalone 2016). Previous studies have shown that the differential energy spectra of H–Fe nuclei in large SEP events exhibit two distinct (or broken) power laws above and below a characteristic roll-over or break energy, with the break energy typically decreasing for the heavier ion species, or more precisely, with the ion's charge-to-mass or Q/M ratio (e.g., McGuire et al. 1984; Ellison & Ramaty 1985; Mazur et al. 1992; Mewaldt et al. 2012). Mewaldt et al. (2005a) suggested that this systematic Q/M dependence occurs because the energy spectra, usually plotted in MeV nucleon−1, steepen or roll over at the same value of the diffusion coefficient for different species, which depends on ion rigidity or the Q/M ratio (see Tylka et al. 2000; Cohen et al. 2005; Mewaldt et al. 2005a).
Indeed, in surveying the Fe and O spectral properties during 46 isolated, large gradual SEP events observed in solar cycles 23 and 24, Desai et al. (2016; hereafter also referred to as Paper 1) found that the Fe spectra had lower break energies owing to the lower Q/M ratio or higher rigidity of Fe when compared with O. Furthermore, Mewaldt et al. (2005a) reported that the observed Q/M dependence of the spectral break energies during the 2003 October SEP/interplanetary shock event scaled as (Q/M)α with α ≈ 1.75. This value is smaller than the α ≈ 2 predicted by Li et al. (2005) for quasi-parallel shocks, but larger than the ∼1.5–1.6 predicted by Battarbee et al. (2011). Later, Li et al. (2009) generalized their SEP acceleration model by including different levels and slopes for the turbulence spectra at shocks with different obliquity and predicted that α could range between ∼0.2 for weaker scattering near quasi-perpendicular shocks and ∼2 for stronger Q/M-dependent scattering near quasi-parallel shocks. More recently, Schwadron et al. (2015a, 2015b) developed a new SEP acceleration model where double power laws occur naturally from shocks and compressions low in the corona, particularly on the flanks of CME expansion regions. In this model, the finite size of the CME shock and stronger Q/M dependence of the diffusion coefficient facilitates particle escape from the acceleration region, which reduces the break energy and steepens the higher energy spectrum. Conversely, in the Schwadron et al. model, a weaker Q/M dependence inhibits particle escape, which increases the break energy and flattens the higher energy spectrum. In this paper, we fit the ∼0.1–500 MeV nucleon−1 H–Fe spectra in the 46 large SEP events surveyed in Paper 1 with the Band function to obtain a normalization constant, low- and high-energy parameters γa and γb, and break energy EB. For each SEP event, we fit the break energy EX of each species X, normalized to that of proton break energy EH with  and then investigate properties of α. We compare our results with existing and evolving SEP acceleration models to better understand the physical mechanisms that may be responsible for producing the double power-law spectral forms and the Q/M dependence of the break energies in large SEP events.
2. INSTRUMENTATION AND DATA ANALYSES
We use energetic ion data from (1) the Ultra-Low-Energy Isotope Spectrometer (ULEIS; Mason et al. 1998); (2) the Solar Isotope Spetcrometer (SIS; Stone et al. 1998a); and (3) the Electron, Proton, and Alpha Monitor (EPAM: Gold et al. 1998) on board NASA's Advanced Composition Explorer (ACE; Stone et al. 1998b), which launched in 1997 August. We also use proton data from the Proton and Electron Telescope on board the Solar, Anomalous, and Magnetospheric Particle Explorer (PET; Cook et al. 1993), the Energetic and Relativistic Nuclei and Electron experiment (ERNE; Torsti et al. 1995) on board the joint ESA/NASA Solar and Heliospheric Observatory (SOHO), and the Energetic Particle Sensor (EPS) on NOAA's Geostationary Operational Environmental Satellites (GOES; series 8–15). Details of these instruments and their species and energy coverage are provided in Table 1.
Table 1. Data Sources Used in this Work
| Instrument/Spacecraft | Measurement Technique | Species | Energy Range (MeV nucleon−1) |
|---|---|---|---|
| ACE/EPAMa | Residual Energy, E | H | ∼0.04–5 |
| ACE/ULEIS | Time-of-Flight versus Residual Energy, E | H–Fe | ∼0.1–14 |
| ACE/SISb | dE/dx versus E | He–Fe | ∼5–170 |
| SOHO/ERNE | dE/dx versus E | H | ∼2–140 |
| GOES/EPSa | dE/dx versus E | H | ∼2–500 |
| SAMPEX/PETa | dE/dx versus E | H | ∼19–500 |
Notes.
aProton data from ACE/EPAM, GOES/EPS, and SAMPEX/PET during six large SEP events that were also associated with ground level enhancements (GLEs) are obtained from Mewaldt et al. (2012). bThe ACE/SIS upper energy ranges for He, C, N, O, Ne, Mg, Si, S, Ca, and Fe are ∼41, ∼76, ∼83, ∼90, ∼102, ∼113, ∼123, ∼133, ∼151, and ∼169 MeV nucleon−1, respectively (Stone et al. 1998a).Download table as: ASCIITypeset image
Since this study obtains energy spectra over a broad energy range, combining data from multiple instruments on board different spacecraft, it is important to understand the impacts of instrumental effects such as cross-calibration and backgrounds on our survey. We remark that instrumental backgrounds do not affect our observations and results, since we study event-integrated fluences in large SEP events, where counting statistics is sufficient because the hourly averaged intensities and the event-integrated fluences are well above the corresponding backgrounds in these instruments. In addition, issues related to cross-calibration between various instruments have been addressed by numerous previous studies over the last decade: between ACE/ULEIS and ACE/SIS, e.g., Cohen et al. (2005) and Desai et al. (2004, 2006); among ACE/EPAM, ACE/ULEIS, GOES/EPS, and SAMPEX/PET, e.g., Mewaldt et al. (2005b, 2012); and among ACE/EPAM, SOHO/ERNE, and GOES/EPS, e.g., Lario et al. (2013) and Richardson et al. (2014). Furthermore, for each SEP event in our survey, we compared and found excellent agreement between the fluences at overlapping energies from various instruments for as many species as possible (see Figure 1 for examples). Finally, we also eliminated events or species for which the fluences from different instruments did not agree at overlapping energies (see Section 3.5 for a discussion of the events and spectra eliminated from the analyses).
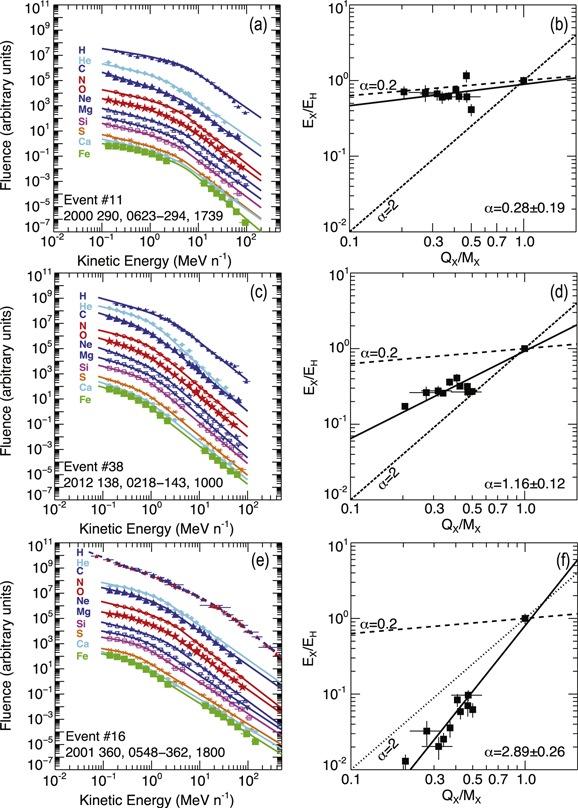
Figure 1. Panels (a), (c), and (e): event-integrated differential fluences vs. energy of ∼0.1–500 MeV nucleon−1 H–Fe nuclei during three large SEP events (see Table 1 and the text for the energy ranges for different species). The energy spectra for different species are offset for clarity. The solid lines show fits to the spectra using the Band function (see Equation (1); Band et al. 1993). In all panels, the proton spectra (topmost blue symbols) are from ACE/ULEIS, SOHO/ERNE, and GOES/EPS, and the He–Fe spectra are from ACE/ULEIS and ACE/SIS. Figure 1(e): red data points superposed on the blue symbols are proton data from ACE/EPAM, GOES/EPS, and SAMPEX/PET, and the dotted red curve shows the corresponding Band-function fit from the Mewaldt et al. (2012) study. Panels (b), (d), and (f): spectral break energy EX of species X normalized to the proton spectral break energy EH vs. the ion's charge-to-mass (Q/M) ratio. The solid line is the fit to the data with the linear function  . Dashed lines show the same equation with ∝ = 2, and dotted lines are the same equation with ∝ = 0.2. The ionic charge states QX for each species are taken as the mean Q-state observed in several large SEP events (Möbius et al. 2000; Klecker et al. 2007).
Download figure:
Standard image High-resolution imageIn Paper 1, we described our event selection criteria and method for identifying sampling intervals for 46 isolated, large SEP events observed at 1 au from 1997 November through 2014 April. None of these SEP events were accompanied by local interplanetary shock-accelerated energetic storm particle (ESP) populations above ∼0.1 MeV nucleon−1. Also, as discussed in Paper 1, this selection criterion introduces a significant bias in that the flares and CMEs associated with most of these 46 events originate from western hemisphere sources. Tables 1 and 2 of Paper 1 provide the solar source properties, fluence sampling intervals, the ∼0.5–2.0 MeV nucleon−1 3He/4He ratio, and the Fe/O ratios at ∼0.16–0.23 MeV nucleon−1 and ∼15–21 MeV nucleon−1 associated with these 46 events. In this study, for each SEP event, we used ACE/ULEIS, ACE/SIS, GOES/EPS, SOHO/ERNE, and, when available, SAMPEX/PET, to obtain the event-integrated ∼0.1–500 MeV nucleon−1 fluence spectra for H, and ACE/ULEIS and ACE/SIS to obtain the ∼0.1–170 MeV nucleon−1 fluence spectra for the remaining 10 species He–Fe, as shown in the three examples in Figure 1. As in Paper 1, we used the nonlinear least-squares Levenberg–Marquardt technique and minimized the χ2 to fit the four-parameter Band function (see Band et al. 1993; Equation (1)) given by:
Here C is the normalization constant, γa and γb are the low-energy and high-energy Band parameters, and E and EB are the kinetic and spectral break energy, respectively. The separation between the low- and high-energy power-law segments of the SEP spectra can also be characterized using the Band-fit parameters obtained from Equation (1) by the transition energy ET = (γb–γa) ∗ EB (see Mewaldt et al. 2012). The units of E, EB, and ET are MeV nucleon−1. For each Band-fit parameter, we obtain the formal 1σ uncertainty from the off-diagonal terms of the covariance matrix (Markwardt 2009). Like the Fe and O spectra discussed in Paper 1, we found that for most species in most SEP events (see Figures 1(a), (c) and (e)), the fits are visually and statistically reasonable, with reduced χ2 values having ∼50% probabilities (also see Mewaldt et al. 2012). As discussed in Paper 1, we point out once again that the Band function is not derived from considerations of SEP acceleration, but rather because it is a convenient way to represent the broken power-law spectra observed in many SEP events, making it useful to characterize the behavior of SEP spectra over a broad energy range using only four free parameters.
In Paper 1 we showed that the non-orthogonality of the Band function results in strong coupling between the O-band parameters γa and EB at energies close to EB; therefore, γa can be significantly different from what is commonly described as the low-energy, power-law spectral slope γ1. In order to obtain a physically meaningful quantity that represents the low-energy portion of the SEP spectra below the break energies more accurately, we calculate the low-energy spectral slope γ1 between ∼0.1–1 MeV nucleon−1 for each species in all SEP events using Equation (1a) and the corresponding band parameters γa and EB. For each event and species, we also investigate properties of the transition energy ET defined above. Figure 2 illustrates the relationships between the various spectral parameters studied in this paper, and how the band parameters γa and γb and the spectral slope γ1 change when the corresponding portion of the spectrum flattens or steepens. For instance, γa, γb, and γ1 increase when the spectrum steepens, and vice versa.

Figure 2. Example of an SEP spectrum defining the various spectral parameters surveyed in this paper (for details, see Equation (1) and Section 2). Also provided are the μ = mean ± standard error of the mean, σ = 1 sigma standard deviation, and m = median values of the respective distributions obtained by fitting 398 spectra in this paper (see Figures 3, 5, and 6). The figure illustrates the relationships between these parameters and how they change when the spectrum flattens or steepens. Spectral parameters γa, γb, and γ1 increase when the spectrum steepens and decrease when the spectrum flattens.
Download figure:
Standard image High-resolution imageMewaldt et al. (2012) fitted the four-parameter Band function to ∼0.05–500 MeV proton fluence spectra for 16 SEP events associated with ground level enhancements (GLEs) during solar cycle 23. Seven of these GLE-associated SEP events are included in our survey (see Tables 1 and 2 in Paper 1, and Table 2 here). For these events, we compared the proton fluences obtained from our analyses with those published in the Mewaldt et al. study. In general, the proton fluence spectra from the two independent surveys for all seven SEP events are in excellent agreement within the stated ∼20% uncertainties that account for differences between various instruments: GOES/EPS, SOHO/ERNE, SAMPEX/PET, ACE/EPAM, and ACE/ULEIS. Figure 1(e) shows the H–Fe fluence spectra during the 2001 December 26 GLE-associated SEP event; here the proton fluences, the corresponding fits, and the fit parameters from the two surveys are nearly identical.
Table 2. Sampling Intervals, Band-fit Parameters γa and γb, and Break Energies EB for H, O, and Fe, and Power-law Exponent α of the Break Energies vs. Q/M for 46 SEP Events in this Survey
| Event No. (1) | Year (2) | Sampling Interval DOY, HHMM in UT (3) | Protonsa | Oxygena,b | Irona | αa (13) | ||||||
|---|---|---|---|---|---|---|---|---|---|---|---|---|
| γa (4) | γb(5) | EB (6) | γa (7) | γb (8) | EB (9) | γa (10) | γb(11) | EB (12) | ||||
| 1c | 1998 | 110, 1253–116, 0054 | 1.53 ± 0.01 | 1.53 ± 0.19 | 15.07 ± 3.73 | ⋯ | 7.46 ± 5.15 | 6.45 ± 1.29 | 0.99 ± 0.40 | 0.99 ± 0.01 | 5.00 ± 1.84 | 0.81 ± 0.33 |
| 2c | 1998 | 126, 0908–129, 0000 | 1.87 ± 0.02 | 2.15 ± 0.05 | 6.44 ± 4.26 | 1.94 ± 0.04 | 3.11 ± 0.16 | 14.97 ± 2.51 | 2.19 ± 0.08 | 11.85 ± 1.35 | 25.64 ± 8.79 | ⋯ |
| 3 | 1998 | 129, 0548–133, 0000 | 0.60 ± 0.41 | 2.39 ± 0.43 | 4.47 ± 2.48 | 0.91 ± 0.05 | 2.60 ± 0.05 | 4.01 ± 0.37 | 1.24 ± 0.11 | 2.81 ± 0.21 | 7.31 ± 1.88 | ⋯ |
| 4 | 1998 | 310, 0012–316, 0000 | 0.98 ± 0.75 | 4.42 ± 1.86 | 1.80 ± 0.90 | 0.24 ± 0.15 | 4.11 ± 0.10 | 0.31 ± 0.03 | 1.27 ± 0.11 | 3.92 ± 0.11 | 0.44 ± 0.06 | ⋯ |
| 5 | 1999 | 21, 0117–22, 1439 | ⋯ | ⋯ | 0.87 ± 0.17 | 0.14 ± 0.09 | 3.28 ± 0.04 | 0.35 ± 0.03 | 0.72 ± 0.31 | 2.60 ± 0.04 | 0.27 ± 0.08 | 0.53 ± 0.31 |
| 6 | 1999 | 114, 1718–116, 1550 | 0.64 ± 0.07 | ⋯ | 7.34 ± 1.51 | 0.92 ± 0.05 | 3.16 ± 0.06 | 1.40 ± 0.11 | 0.23 ± 0.11 | 3.12 ± 0.07 | 0.59 ± 0.07 | 1.43 ± 0.21 |
| 7 | 1999 | 152, 2018–155, 0839 | 0.91 ± 0.09 | 4.25 ± 4.13 | 10.69 ± 1.00 | 1.45 ± 0.03 | 2.60 ± 0.11 | 11.04 ± 1.50 | 1.81 ± 0.02 | 1.78 ± 0.11 | 81.71 ± 16.57 | ⋯ |
| 8 | 1999 | 155, 0838–159, 1920 | 1.18 ± 0.10 | ⋯ | 9.32 ± 2.52 | 0.97 ± 0.05 | 3.58 ± 0.07 | 1.18 ± 0.09 | 0.47 ± 0.08 | 3.72 ± 0.08 | 0.45 ± 0.03 | 1.79 ± 0.20 |
| 9 | 2000 | 204, 1408–205, 2015 | 1.04 ± 0.02 | 3.43 ± 1.22 | 5.23 ± 0.60 | 0.99 ± 0.33 | 2.82 ± 0.07 | 0.42 ± 0.16 | 1.62 ± 0.08 | 3.57 ± 0.27 | 1.95 ± 0.55 | ⋯ |
| 10 | 2000 | 256, 1432–260, 1359 | 1.20 ± 0.03 | ⋯ | 5.92 ± 1.20 | 1.06 ± 0.02 | 4.96 ± 0.14 | 2.16 ± 0.08 | 1.01 ± 0.03 | 3.75 ± 0.07 | 0.91 ± 0.06 | 1.22 ± 0.23 |
| 11 | 2000 | 290, 0923–294, 1739 | 0.56 ± 0.07 | 2.66 ± 0.11 | 4.64 ± 0.39 | 0.77 ± 0.06 | 2.79 ± 0.10 | 2.85 ± 0.38 | 0.74 ± 0.08 | 3.25 ± 0.21 | 3.29 ± 0.54 | 0.28 ± 0.19 |
| 12 | 2000 | 299, 1347 –302, 0229 | 2.14 ± 0.04 | ⋯ | 11.42 ± 1.73 | 3.12 ± 0.11 | 4.15 ± 1.03 | 26.05 ± 12.80 | 2.81 ± 0.15 | 5.49 ± 1.50 | 8.43 ± 1.93 | 0.81 ± 0.75 d |
| 13 | 2001 | 28, 2213–32, 0445 | 1.00 ± 0.02 | 4.15 ± 0.79 | 2.29 ± 0.10 | 0.47 ± 0.07 | 3.79 ± 0.06 | 0.47 ± 0.03 | 0.47 ± 0.06 | 3.26 ± 0.03 | 0.31 ± 0.02 | 1.26 ± 0.18 |
| 14c | 2001 | 105,1432–108, 0400 | 1.19 ± 0.02 | 2.15 ± 0.07 | 11.73 ± 1.23 | 0.78 ± 0.07 | 2.66 ± 0.05 | 1.42 ± 0.20 | 0.59 ± 0.12 | 2.62 ± 0.04 | 0.62 ± 0.10 | 1.95 ± 0.26 |
| 15c | 2001 | 108, 0318–111, 2150 | 1.38 ± 0.02 | 2.80 ± 0.32 | 31.37 ± 3.43 | 1.51 ± 0.04 | 3.54 ± 0.22 | 6.41 ± 0.85 | 1.40 ± 0.07 | 2.77 ± 0.13 | 3.20 ± 0.93 | 1.52 ± 0.22 |
| 16c | 2001 | 360, 0548–362, 1800 | 1.45 ± 0.03 | 2.95 ± 0.06 | 20.75 ± 2.31 | 0.66 ± 0.09 | 2.72 ± 0.08 | 1.22 ± 0.22 | 0.26 ± 0.20 | 2.38 ± 0.02 | 0.27 ± 0.05 | 2.89 ± 0.26 |
| 17 | 2001 | 364, 2245–7, 2329 | 1.85 ± 0.04 | ⋯ | 17.00 ± 1.32 | 1.54 ± 0.05 | 5.95 ± 1.67 | 5.58 ± 0.61 | 1.33 ± 0.03 | 5.79 ± 0.50 | 2.74 ± 0.14 | 1.12 ± 0.11 |
| 18 | 2002 | 10, 1920–14, 0020 | 1.47 ± 0.03 | 12.06 ± 0.65 | 9.58 ± 1.37 | 1.72 ± 0.02 | 6.71 ± 0.82 | 3.49 ± 0.12 | 1.80 ± 0.09 | 3.07 ± 0.26 | 2.38 ± 1.00 | 1.12 ± 0.16 |
| 19 | 2002 | 51, 0648–55, 1200 | 1.49 ± 0.11 | 2.94 ± 0.30 | 6.86 ± 1.66 | 2.15 ± 0.04 | 3.20 ± 0.18 | 12.72 ± 2.18 | 2.13 ± 0.04 | 3.29 ± 0.19 | 7.01 ± 1.59 | ⋯ |
| 20 | 2002 | 188, 1243–191, 1214 | 1.60 ± 0.10 | 3.22 ± 1.43 | ⋯ | 2.75 ± 0.10 | ⋯ | ⋯ | 3.06 ± 0.15 | ⋯ | ⋯ | ⋯ |
| 21 | 2002 | 226, 0213–228, 1200 | 1.21 ± 0.05 | ⋯ | 4.71 ± 0.29 | 1.24 ± 0.06 | 3.95 ± 0.11 | 1.15 ± 0.14 | 1.61 ± 0.07 | 3.84 ± 0.12 | 0.95 ± 0.14 | 1.29 ± 0.17 |
| 22c | 2002 | 235, 2351–240, 2200 | 1.10 ± 0.02 | 2.87 ± 0.03 | 9.98 ± 0.37 | 1.19 ± 0.03 | 3.77 ± 0.14 | 3.27 ± 0.27 | 0.71 ± 0.05 | 3.00 ± 0.05 | 0.89 ± 0.07 | 1.58 ± 0.18 |
| 23 | 2003 | 151, 0523–153, 0205 | 1.27 ± 0.01 | 3.43 ± 0.44 | 3.87 ± 0.19 | 1.68 ± 0.03 | 3.60 ± 0.06 | 1.37 ± 0.13 | 1.44 ± 0.06 | 3.42 ± 0.07 | 0.99 ± 0.14 | 0.98 ± 0.13 |
| 24 | 2003 | 169, 0308–174, 2319 | 1.34 ± 0.03 | ⋯ | 4.33 ± 0.48 | 1.20 ± 0.04 | 5.07 ± 0.34 | 1.85 ± 0.16 | 1.06 ± 0.05 | 5.10 ± 0.41 | 0.94 ± 0.09 | 0.99 ± 0.17 |
| 25c | 2003 | 308, 2102–313, 1524 | 1.41 ± 0.03 | 4.99 ± 0.31 | 20.06 ± 1.04 | 1.01 ± 0.08 | 3.73 ± 0.17 | 1.80 ± 0.31 | 0.36 ± 0.14 | 3.72 ± 0.09 | 0.35 ± 0.04 | 2.46 ± 0.24 |
| 26 | 2003 | 336, 1208–340, 0300 | 0.26 ± 0.09 | 5.26 ± 0.88 | 2.52 ± 0.16 | 0.51 ± 0.04 | 5.01 ± 0.14 | 1.12 ± 0.06 | 0.46 ± 0.07 | 4.69 ± 0.21 | 0.44 ± 0.03 | 1.15 ± 0.13 |
| 27 | 2004 | 257, 1200–262, 1200 | 1.00 ± 0.02 | 6.01 ± 3.71 | 3.63 ± 0.12 | 1.20 ± 0.04 | 5.19 ± 0.23 | 1.99 ± 0.13 | 1.12 ± 0.06 | 5.01 ± 0.26 | 0.88 ± 0.10 | 0.76 ± 0.11 |
| 28 | 2004 | 263, 2128–268, 1314 | 1.00 ± 0.02 | 2.83 ± 0.29 | 2.47 ± 0.21 | 1.74 ± 0.11 | 3.40 ± 0.04 | 0.49 ± 0.08 | 2.24 ± 0.10 | 3.68 ± 0.17 | 1.07 ± 0.27 | 1.15 ± 0.39 |
| 29 | 2004 | 306, 0430–309, 1200 | 0.81 ± 0.04 | ⋯ | 14.42 ± 1.30 | 2.18 ± 0.05 | ⋯ | ⋯ | 1.81 ± 0.08 | 2.89 ± 0.15 | 4.39 ± 1.73 | ⋯ |
| 30 | 2005 | 167, 2048–170, 0000 | 1.39 ± 0.15 | 0.48 ± 0.45 | 157.22 ± 30.26 | 2.09 ± 0.02 | ⋯ | ⋯ | 1.80 ± 0.05 | ⋯ | 63.56 ± 25.38 | ⋯ |
| 31 | 2010 | 226, 1148–230, 0000 | 1.00 ± 0.02 | 2.85 ± 0.31 | 3.01 ± 0.24 | 2.41 ± 0.05 | 1.52 ± 0.18 | 13.17 ± 4.87 | 1.71 ± 0.15 | 28.89 ± 5.17 | 1.04 ± 0.34 | ⋯ |
| 32 | 2010 | 230, 0848–236, 0000 | 1.00 ± 0.02 | 3.24 ± 0.21 | 2.65 ± 0.10 | 0.91 ± 0.09 | 3.39 ± 0.05 | 0.26 ± 0.02 | 1.98 ± 0.24 | 3.29 ± 0.21 | 0.41 ± 0.16 | 2.16 ± 0.29e |
| 33 | 2011 | 66, 2112–72, 0000 | 1.56 ± 0.04 | ⋯ | 10.17 ± 0.80 | 1.21 ± 0.08 | 3.89 ± 0.27 | 2.13 ± 0.38 | 1.12 ± 0.08 | 3.97 ± 0.19 | 0.81 ± 0.10 | 1.48 ± 0.19 |
| 34 | 2011 | 158, 0747–162, 1800 | 2.25 ± 0.09 | ⋯ | ⋯ | 2.83 ± 0.07 | ⋯ | ⋯ | 2.86 ± 0.05 | 0.75 ± 0.01 | ⋯ | ⋯ |
| 35 | 2011 | 221, 0848–224, 0000 | 1.00 ± 0.03 | 2.68 ± 0.14 | 2.51 ± 0.14 | 0.70 ± 0.08 | 3.37 ± 0.07 | 0.58 ± 0.05 | ⋯ | 2.91 ± 0.05 | 0.26 ± 0.03 | 1.46 ± 0.10 |
| 36 | 2011 | 330, 0948–335, 1200 | 0.63 ± 0.11 | 4.67 ± 0.98 | 3.08 ± 0.31 | 0.95 ± 0.06 | 3.65 ± 0.10 | 1.07 ± 0.11 | 1.00 ± 0.08 | 3.93 ± 0.15 | 0.62 ± 0.06 | 0.87 ± 0.22 |
| 37 | 2012 | 73, 1611–77, 1800 | 1.30 ± 0.03 | 4.43 ± 0.17 | 22.19 ± 2.58 | 1.54 ± 0.03 | 3.58 ± 0.15 | 4.26 ± 0.42 | 1.39 ± 0.01 | 3.50 ± 0.08 | 3.53 ± 0.20 | 1.22 ± 0.34 |
| 38 | 2012 | 138, 0318–143, 1000 | 1.00 ± 0.05 | 3.04 ± 0.15 | 2.61 ± 0.09 | 1.01 ± 0.04 | 3.18 ± 0.03 | 0.83 ± 0.06 | 0.80 ± 0.08 | 3.01 ± 0.04 | 0.45 ± 0.04 | 1.16 ± 0.12 |
| 39 | 2012 | 147, 2247–151, 1200 | 0.70 ± 0.02 | 6.16 ± 5.86 | 4.24 ± 0.13 | 0.71 ± 0.07 | 4.56 ± 0.33 | 1.24 ± 0.13 | ⋯ | 3.88 ± 0.27 | 0.37 ± 0.04 | 1.59 ± 0.11 |
| 40 | 2012 | 205, 0618–210, 0000 | 1.86 ± 0.11 | 1.35 ± 0.94 | 120.52 ± 50.32 | 1.84 ± 0.07 | ⋯ | 58.71 ± 30.09 | 1.87 ± 0.11 | 1.87 ± 0.02 | 17.81 ± 12.16 | 1.04 ± 0.60 |
| 41 | 2013 | 101, 0848–105, 1200 | 1.83 ± 0.04 | ⋯ | 129.77 ± 92.05 | 2.73 ± 0.07 | ⋯ | ⋯ | 2.54 ± 0.04 | ⋯ | ⋯ | ⋯ |
| 42 | 2013 | 179, 0348–184, 0000 | 1.00 ± 0.01 | 4.29 ± 0.68 | 1.67 ± 0.07 | 1.56 ± 0.04 | 3.70 ± 0.06 | 0.69 ± 0.05 | 1.28 ± 0.14 | 3.22 ± 0.16 | 0.63 ± 0.14 | 0.90 ± 0.13 |
| 43 | 2013 | 229, 2048–232, 2259 | ⋯ | 3.22 ± 0.49 | 0.69 ± 0.14 | ⋯ | 3.57 ± 0.05 | 0.14 ± 0.01 | ⋯ | 3.35 ± 0.16 | 0.10 ± 0.05 | 0.71 ± 0.52e |
| 44 | 2013 | 362, 1400–365, 0000 | 1.53 ± 0.06 | 3.33 ± 0.32 | 37.85 ± 9.45 | 2.35 ± 0.03 | ⋯ | 104.82 ± 98.69 | 1.10 ± 0.11 | 2.69 ± 0.10 | 1.56 ± 0.42 | 1.65 ± 1.35f |
| 45 | 2014 | 4, 2100–7, 1200 | 1.75 ± 0.11 | 1.75 ± 0.18 | 8.91 ± 1.04 | 2.56 ± 0.02 | ⋯ | ⋯ | 2.30 ± 0.03 | 1.19 ± 0.50 | ⋯ | ⋯ |
| 46 | 2014 | 50, 0100–54, 0000 | 1.34 ± 0.06 | 2.89 ± 0.01 | 1.05 ± 0.1 | 1.47 ± 0.09 | 4.15 ± 0.12 | 0.62 ± 0.09 | 1.53 ± 0.14 | 4.29 ± 0.32 | 0.44 ± 0.08 | 0.51 ± 0.13 |
Notes.
aFit parameters with relative uncertainties >100% indicate poor fits to the data and have been eliminated from this table and the analyses. bO-band function fit parameters (included here for completeness) are also provided in Table 3 of Paper 1 (Desai et al. 2016). cAlso included are the proton spectra from the Mewaldt et al. (2012) study of 16 SEPs associated with GLEs from solar cycle 23. dα is obtained using break energies obtained from fits to the He–Fe fluence spectra between ∼1–50 MeV nucleon−1; limited energy range for ULEIS. eα is obtained using break energies obtained from fits to the He–Fe fluence spectra between ∼0.1–10 MeV nucleon−1; limited energy range for SIS. fHe, C, N, Ne, Mg, Si, S, and Ca fluence spectra exhibit no evidence of steepening in the combined ULEIS and SIS energy ranges.Table 2 provides detailed information on the 46 SEP events: Column (1): Event Number; Column (2): Year; Column (3): SEP fluence sampling interval; Columns (4)–(6): H-band parameters; Columns (7)–(9): O-band parameters; Columns (10)–(12): Fe-band parameters; and Column (13): power-law exponent α of the species-dependent spectral break energies obtained for each event as follows. As shown for three SEP events in Figure 1, we obtain and fit the event-integrated fluences for 11 species: H, He, C, N, O, Ne, Mg, Si, S, Ca, and Fe with the Band function (Equation (1)). For each SEP event, we fit the roll-over or break energy EX of each species X normalized to the proton spectral break energy EH with a linear function of the form log(EX/EH) = log(n0) + α log(QX/MX), whose slope α is the power-law exponent discussed in Section 1. Examples of three different types of Q/M dependence of EX/EH, i.e., three different values of α, are shown in Figures 1(b), (d), and (f). For the charge states Q, we used the average SEP ionic charge state  determined by Möbius et al. (2000) and Klecker et al. (2007), namely He2+, C5.6+, N6.6+, O6.8+, Ne8.2+, Mg8.9+, Si9.5+, S10.2+, Ca10.8+ and Fe11.6+.
We remark that using average SEP charge states for heavier species such as Ca and Fe can introduce uncertainties in the actual values for α, especially in events for which Ca and Fe are highly ionized, as has been observed in some large SEP events with significant enrichments of Fe at high energies (e.g., Klecker et al. 2007) or events in which the heavy ions undergo charge and energy changing processes or are stripped further after acceleration (e.g., Barghouty & Mewaldt 1999; Reames et al. 1999). In such cases, the actual Q/M values for Ca and Fe are somewhat larger than our assumption, which in turn shifts the data points in plots of EX/EH versus QX/MX (e.g., Figures 1(b), (d), and (f)) to the right, increasing the value of α compared with that obtained from this analyses (see Section 3.5 for discussion of specific events).
3. GENERAL PROPERTIES OF THE SPECTRAL FITS
3.1. Properties of SEP-band Parameters γa and γb
In Figure 3(a) we show statistical properties of the SEP spectra by plotting histograms of the SEP-band parameters γa (red) and γb (blue) for all species in all 46 SEP events. Only those values with relative uncertainties <100% and finite values for γa and γb are included; 398 spectra were fitted. Consistent with the statistical properties of the O-band parameters in Paper 1, we note that γa for all species has a mean μ ∼1.23 and median m ∼1.19, which are both significantly smaller compared to the corresponding values for the high-energy Band parameter γb: μ ∼3.63 and m ∼3.57. We also note that γa has a 1σ standard deviation of ∼0.58 and varies over a smaller range of values between ∼0–3.5. In contrast, γb has a 1σ value of ∼1.12 and varies between ∼0.7–9. In summary, based on 398 fitted spectra, the average power-law spectral slope changes by ∼2.4 units from an average value of ∼1.23 at low energies to ∼3.63 above the break.
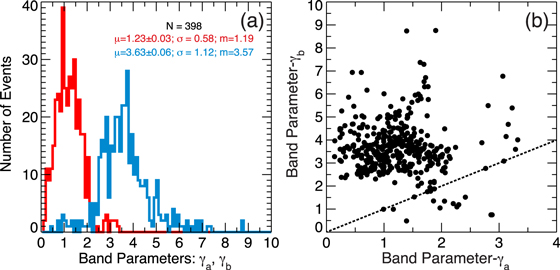
Figure 3. (a) Histograms of SEP Band parameters γa (red) and γb (blue) for all species in all 46 events. N = number of spectra fitted; μ = mean ± standard error of the mean; σ = 1 sigma standard deviation; m = median values of the distributions. (b) Scatter plots of γa vs. γb. Dotted line shows spectra for which γa = γb. All parameters with relative uncertainties ≥100% are excluded (see Table 2).
Download figure:
Standard image High-resolution imageFigure 3(b) shows a scatter plot of γb versus γa obtained for each individual species in all SEP events. As seen for the O spectral slopes in Paper 1, we note that most SEP spectra are flatter at lower energies and steepen above the break energy. The energy spectra in 10 cases flatten at higher energies (see Table 2); these are for H: events 30 and 40; He: event 44; O: event 31; Si: events 2 and 34; Ca: events 2 and 32; and Fe: event 34 and 45. Event 31 was discussed in Paper 1. Since γb < γa occurs for different species in different events, including these outliers in our analyses does not affect the overall results and conclusions of this paper. Note the many cases where γa is small in Figure 3(b); this is due to the previously mentioned coupling with EB and is not due to low-energy spectral slopes γ1 being close to 0.
3.2. Differences in H, O, and Fe SEP band Parameters
Figure 4 investigates the relationships and differences between the SEP Band parameters for different species: (a) γa for H and Fe versus γa of O; (b) γb for H and Fe versus γb of O; (c) γb–γa for H and Fe versus γb–γa of O; and (d) EB for H and Fe versus EB of O. In general, the SEP Band parameters for H and Fe track those of O reasonably well over the corresponding range of values. We note the following. (1) In many events, γa for H and Fe are different compared to that of O; the differences between H and O are somewhat larger. (2) γb and γb–γa for H and Fe show tighter correlations with the corresponding values for O. (3) EB for H and Fe in most SEP events show significant differences compared to corresponding values for O; the H EB in 35 out of 40 events (∼87%) is larger than that of O, while the Fe EB in 32 out of 40 events (∼80%) is smaller than that of O (also see Desai et al. 2016).
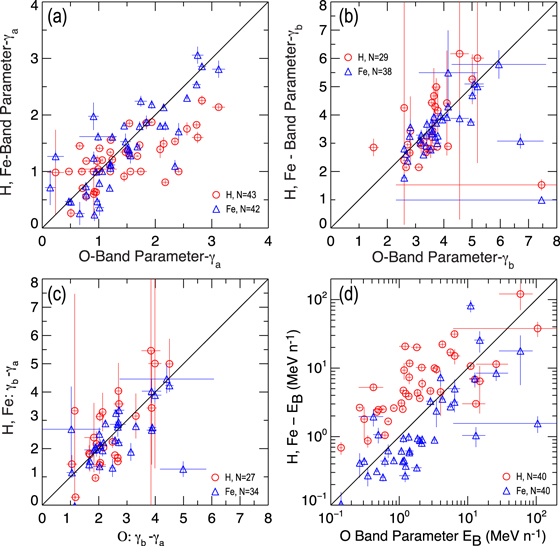
Figure 4. Scatter plots of SEP Band parameters of H and Fe vs. O: (a) γa; (b) γb; (c) γb–γa; and (d) EB. Units of EB are MeV nucleon−1. The red circles show H vs. O, and the blue triangles show Fe vs. O. N = number of data points. Solid lines show 1:1 relationships.
Download figure:
Standard image High-resolution image3.3. Event-to-event Variations
Figure 5 examines the event-to-event variations of the SEP spectral parameters for all species: (a) γ1; (b) γb; and (c) EB. Red dots show the values for each species in each event, the solid black curves in (a) and (b) show the mean value for γ1 and γb, respectively, and the solid black curve in (c) shows the proton spectral break energy EH for each event. Dashed lines show the species-averaged mean values obtained by averaging for all species in all 46 events; yellow shaded regions depict the 1σ standard deviation (also see Figure 3(a)). γ1 for events 20 and 34, and γb and EB for event 20 are not plotted (see Section 3.5). We note the following: (1) γ1 has an event-averaged mean of ∼1.64 ± 0.03, with 1σ standard deviation of ∼0.6; large deviations of ≫1σ from the event-averaged mean value are seen in events 12, 28, 32, 43 and 45, where γ1 ≥ 2.5 for most species; (2) in most events, γb < 6 for most species; exceptions are events 17 and 18, where γb > 6 for most species; and (3) In most events, the H EB is greater than those for the heavier species in the same event. Note that in events 30 and 40, H EB is greater than ∼100 MeV. Overall, within an event, the proton spectral parameters γ1 and γb do not stand out from the corresponding heavy ion spectral parameters but rather lie in the midst of the others; in contrast, the proton spectral break energy is almost always greater than the spectral break energies of the heavier ions.

Figure 5. Red symbols are (a) the low-energy spectral slope γ1 (see Sections 2 and 3.3 for details); (b) the Band parameter γb; and (c) the break energy EB for all species plotted vs. the event number. Dashed lines in (a) and (b) show the species-averaged mean values obtained by averaging for all species in all 46 events; yellow shaded regions depict the 1σ standard deviation (also see Figure 3(a)). Solid black curves in (a) and (b) show the mean values for γ1 and γb in each event, respectively, and the solid black curve in (c) shows the proton spectral break energy EH in each SEP event.
Download figure:
Standard image High-resolution image3.4. Species-dependent Variations within an Event
We now investigate the species-associated variations in the (a) low-energy spectral slope γ1 and Band parameters γa and (b) γb within an event by plotting the distributions of their corresponding mean deviations in Figure 6. The mean deviation for each parameter in each event is calculated from the data shown in Figure 5. Figure 6(c) shows the actual distribution of the spectral break energy EB for all species in all SEP events compared to that of the transition energy ET. The following features are striking. (1) The mean deviations of γ1, γa, and γb have narrow distributions that result in well-behaved Gaussian-like distributions (black curves) with small 1σ values. (2) Typically, ET > EB, with the mean of ET almost a factor of 2 greater than that of EB. More importantly, EB and ET vary over more than three orders of magnitude, which results in broad distributions with large 1σ standard deviations. These results indicate that: (1) within a given SEP event, the three parameters γ1, γa, and γb, have remarkably similar values for all species, that is, for each event, both the low-energy and high-energy spectral slopes are similar within ∼10%–15%; (2) for a given event, most of the species-associated, spectral variations are driven by differences in the break energy or the transition energy ET at which the spectra steepen; and (3) examples of such species-associated differences in EB are shown in Figures 1(b), (d), and (f).

Figure 6. Histograms of mean deviations of (a) the Band parameter γa (red) and low-energy spectral slope γ1 (blue) and (b) the Band parameter γb from the average value in each event. (c) Histograms of the Band parameter spectral break energy EB (red) and transition energy ET (blue). N, m, μ, and σ are defined as in Figure 3. The solid black curves show Gaussian fits, with mean and 1σ standard deviation, for the distributions of γ1 in (a) and γb.
Download figure:
Standard image High-resolution image3.5. Event-to-event Variations in the Q/M-dependence of EB
To investigate the species-dependence of EB within an SEP event, as seen in Figure 1(b), 1(d), 1(f), 4(d), and 6(c), as well as the event-to-event variations in EB shown in Figure 5(c), we examine the EX/EH versus the ion's Q/M ratio for 38 SEP events in Figure 7. This figure, along with the three cases shown in Figure 1, demonstrates that in most of the events the break energies are well ordered by Q/M ratio. In the five events not shown in this paper, either the ULEIS and SIS spectra for many species did not match near overlapping energies (event 20; also see Section 3.3), or only the proton spectra showed a spectral break (events 29, 30 and 41), or the spectra for most species are well-described by a single power-law across the combined ULEIS and SIS energy range (event 34).
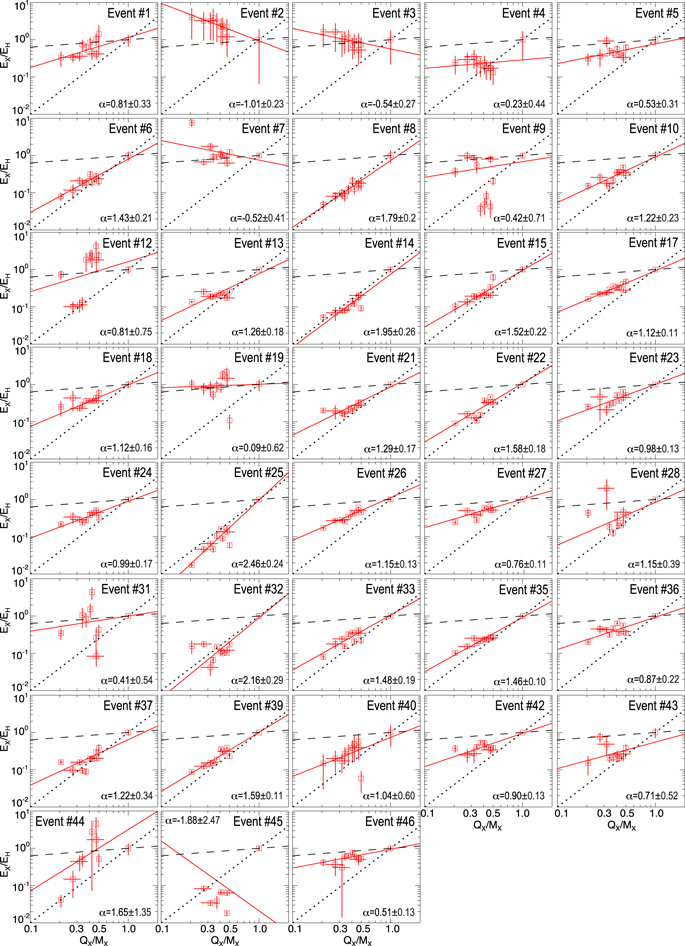
Figure 7. Same as Figures 1(b), (d), and (f), but for the remaining 38 of the 41 SEP events that exhibited finite heavy ion spectral breaks that allowed determination of the exponent α (see Section 3.5 for more details). The fitted values of α are also provided in Table 2.
Download figure:
Standard image High-resolution imageAs in Figure 1, we obtain the power-law exponent α for each event; values of α are provided in Table 2 and in each panel. In four events, 4, 9, 19 and 31, we found that the relative uncertainties in α were >100%. In four other events, 2, 3, 7, and 45, α < 0. From Table 2, we note that in event 7, the Fe EB ∼81 MeV nucleon−1 compared with ∼11 MeV nucleon−1 for both H and O (and for many other species), which results in the Fe EB being an outlier in Figure 7, and thus yielding α < 0. For events 2, 3, and 45 we only used the >0.2 MeV nucleon−1 He–Fe spectra (>0.5 MeV nucleon−1 for event 45), because below these energies, the ULEIS spectra for most species exhibited an upturn or downturn such that the Band function could not be fitted to the entire spectrum. When we force-fitted the spectra by including these lower energy data, the resulting Band fits were poor and the QX/MX versus EX/EH plots were similar to that shown for event 31, with relative uncertainties in α > 100%. We therefore exclude these eight outlier events along with the five events not shown in Figure 7 from Table 2 and the subsequent discussion concerning α.
The figure clearly shows that the fit (solid red line) and the slope α well characterizes the systematic Q/M-dependence of the heavy ion spectral break energies in most of the remaining 33 SEP events in our survey. Other noteworthy features are: (1) in these 33 SEP events, including the three cases shown in Figure 1, α > 0.2 (dashed black line); and (2) in events 16 (shown in Figure 1(f)), 25, and 32, α > 2 (dotted black line, also see Section 4.1). Note that in event 32, the values of EX/EH for Ca and Fe are significantly larger than the fit, which yields α ∼2.16. Likewise, larger values of EX/EH for Fe and/or Ca are also seen for events 21, 28, 37, and 42, resulting in large deviations from the fits. Such deviations are probably affected by our assumption of the average SEP charge states for these species. For instance, if both the Ca and Fe were highly ionized in these events, as has been observed in some large SEP events with significant enhancements of Fe/O and Ca/O (e.g., Klecker et al. 2007), then their corresponding Q/M values would be larger. This would shift the data points to the right and closer to the fitted line. Indeed, Table 3 shows that four out of these five events have enrichments in the 3He/4He ratio and in the Fe/O ratio when compared to the corresponding abundances measured in the solar wind, indicating the presence of impulsive event suparthermals in the seed population (see Desai et al. 2006).
Table 3. 0.5–2 MeV nucleon−1 3He/4He and Fe/O Ratios at ∼0.193 and ∼18 MeV nucleon−1 for Five Events with Large Deviations in the Spectral Breaks for Fe and Ca (see Section 3.5; taken from Paper 1)
| Event No. | 3He/4He (×10−2) | Fe/O Ratio (@MeV Nucleon−1) | |
|---|---|---|---|
| (1) | (2) | 0.16–0.23 (3) | 15–21 (4) |
| 21 | 1.682 ± 0.094 | 0.323 ± 0.007 | 0.123 ± 0.023 |
| 28 | 0.208 ± 0.047 | 0.244 ± 0.005 | 0.109 ± 0.045 |
| 32 | <0.054 | 0.140 ± 0.004 | 0.053 ± 0.039 |
| 37 | 0.171 ± 0.043 | 0.234 ± 0.005 | 0.252 ± 0.024 |
| 42 | <0.062 | 0.112 ± 0.004 | 0.281 ± 0.133 |
Download table as: ASCIITypeset image
4. GENERAL PROPERTIES OF THE POWER-LAW EXPONENT α
4.1. Distributions and Relationship with Solar Source Properties
We now investigate the properties of α and its relationship with the solar source properties given in Table 1 of Paper 1. Figure 8(a) shows the histogram of α along with the mean, standard deviation, and median value of the distribution, while Figures 8(b), (c), and (d) plot α versus flare longitude, CME speed, and the peak proton flux (PFU) obtained by NOAA GOES/EPS, respectively. The peak proton flux is the integral flux measured by GOES/EPS for energies >10 MeV and has units of cm−2 sr−1 s−1. The flare longitude and CME speed for events 1–29 are obtained from http://umbra.nascom.nasa.gov/SEP/, ftp://ftp.ngdc.noaa.gov/STP/swpc_products/daily_reports/solar_event_reports/, Cane et al. (2010), and Kahler (2013). CME and flare properties for events 30–46 are from Richardson et al. (2014), cdaw.gsfc.nasa.gov/CME_list/UNIVERSAL/, and Ding et al. (2013).

Figure 8. (a) Histogram of α, and α vs. (b) flare longitude, (c) CME speed (km s−1), and (d) peak proton flux. The peak proton flux, flare longitude, and CME speeds are taken from Table 1 of Paper 1 (Desai et al. 2016). N, μ, σ, and m are as defined in Figure 3; r is the linear correlation coefficient, and p is the probability that the absolute value of r can be exceeded by an uncorrelated pair of parameters. Green indicates GLEs; red represents CMEs with speeds >2000 km s−1; and blue designates GLEs and CMEs with speeds >2000 km s−1.
Download figure:
Standard image High-resolution imageFigure 8 shows the following: (1) α has a mean value of 1.27, median value of 1.16, and is confined between ∼0.2–3, with values for 3 SEP events greater than 2; two of these events were also accompanied by GLEs (see Table 2, Figures 1(f) and 7); (2) α exhibits no clear trend with the flare longitude but SEP events with α > 2 are associated with source longitudes west of W45; this is probably a result of the selection criteria, which are biased toward western hemisphere events; and (3) α exhibits statistically significant, positive trends with the peak proton flux and CME speed, with values for correlation coefficients r ∼0.48 and r ∼0.41, which have probabilities p < 1% and p < 2%, respectively, of being exceeded by uncorrelated pairs of parameters. It is evident from the figure that the correlations with CME speed and peak proton flux are largely due to the presence of events associated with higher CME speeds and/or GLEs (see Section 5.3).
4.2. Relationship Between α and SEP Fe/O and 3He/4He Ratios
Using the α values for the 33 events provided in Table 2, Figure 9 examines the relationships between α and (a) the ∼0.16–0.23 MeV nucleon−1 Fe/O, (b) the ∼15–21 MeV nucleon−1 Fe/O, and (c) the ∼0.5–2.0 MeV nucleon−1 3He/4He ratios for those SEP events for which these key heavy ion abundances are finite (taken from Table 2 in Paper 1). The ∼0.16–0.23 MeV nucleon−1 Fe/O exhibits a statistically significant, positive trend with α; correlation coefficient r ∼0.39 for 33 events has <2.5% chance of being exceeded by an uncorrelated pair of parameters. In contrast, α is not well correlated either with the ∼15–21 MeV nucleon−1 Fe/O or the ∼0.5–2.0 MeV nucleon−1 3He/4He ratios (see Section 5.3 for a discussion of these abundances in the extreme SEP events).

Figure 9. Scatter plots of α vs. (a) 0.16–0.23 MeV nucleon−1 Fe/O, (b) 15–21 MeV nucleon−1 Fe/O, and (c) 0.5–2.0 MeV nucleon−1 3He/4He ratio. All abundance ratios are taken from Table 2 of Paper 1 (Desai et al. 2016). Dashed lines show Fe/O ratios at 0.404 and 0.134, which are average values in several large SEP events at ∼0.32–0.5 MeV nucleon−1 (Desai et al. 2006) and ∼5–12 MeV nucleon−1 (Reames 2013), respectively. Color-coded symbols denote SEP events associated with fast CMEs and GLEs as in Figure 8.
Download figure:
Standard image High-resolution image4.3. Relationship Between α and O Band Parameters γa and γb
Figure 10(a) investigates the relationship between the O SEP Band parameters γa and γb and the power-law exponent α, while Figure 10(b) plots the difference, γb–γa, versus α. We note the following: (1) α is not correlated with γa, γb, or γb–γa and (2) SEP events with α between ∼0.6–1.4 have a larger range of values for γb and γb–γa, i.e., events for which the spectra steepen significantly at higher energies occur for α values between ∼0.6–1.4.

Figure 10. Scatter plots of α vs. (a) O Band parameters γa (triangles) and γb (squares), and (b) the difference γb–γa. Color-coded symbols denote SEP events as in Figure 8.
Download figure:
Standard image High-resolution imageFigure 11 examines the relationship between the O break energy EB and (a) the difference between the spectral slopes γb–γa and (b) α. Overall, the O EB is not correlated with γb–γa or α. However, the O EB in SEP events with γb–γa < 3 and γb–γa > 3 appear to exhibit negative and positive trends, respectively.

Figure 11. Scatter plots of O Band parameter spectral break energy EB vs. (a) the difference γb–γa and (b) α. Color-coded symbols denote SEP events as in Figure 8.
Download figure:
Standard image High-resolution image5. DISCUSSION
Paper 1 investigated properties of the Fe and O fluence spectra in 46 isolated, large gradual SEP events observed at 1 au during solar cycles 23 and 24. In this paper, we fit the event-integrated fluence spectra of ∼0.1–500 MeV nucleon−1 H–Fe in the same 46 SEP events with the four-parameter Band function and investigate properties of the SEP Band parameters γa, γb, and EB. We also calculate the low-energy power-law spectral slope γ1. Our results are:
- 1.Figure 3 in Section 3.1 shows that γa ranges between ∼0.1–3 with a mean value μ ∼1.23; γb ranges between 0.5–9 with μ ∼3.63. On a case-by-case basis γa is smaller than γb (on average by ∼2.4 units), implying that the energy spectrum of each species in any given SEP event steepens with increasing energy.
- 2.Figures 4(a)–(c) in Section 3.2 and Figures 5(a)–(b) in Section 3.3 show that in most SEP events, γa, γ1, and γb for different ion species track each other well. Figures 6(a)–(b) in Section 3.4 show that, within a given SEP event, γa, γb and γ1 for H–Fe are nearly identical, and each mean deviation exhibits a Gaussian-like distribution with a small 1σ of ≲0.08.
- 3.Figure 4(d) in Section 3.2 shows that the EB for H and Fe track those of O, and that in general, EH > EO > EFe. Figure 5(c) in Section 3.3 shows that, in most SEP events, EH generally exceeds the EB for the heavier ion species. Figure 6(c) in Section 3.4 shows that EB and ET varies over three orders of magnitude between ∼0.1–300 MeV nucleon−1; the average EB is ∼6 MeV nucleon−1 with 1σ ∼16 MeV nucleon−1, and the average ET is ∼9 MeV nucleon−1 with 1σ ∼18 MeV nucleon−1.
- 4.Figures 1(b), (d), (f), and 7 show that EB in 33 of the 46 SEP events in our survey (see Section 3.5) varies systematically according to the ion's Q/M ratio, and further that this dependence can be characterized by a single parameter α-given by fitting
 to the spectral break energies of H–Fe in each event.
 - 5.
- 6.
- 7.
- 8.

5.1. Importance of Direct Flare Contributions to Large SEP Events
While there is a general consensus that large gradual SEP events and their observed properties at 1 au result from DSA at CME-driven coronal or interplanetary shocks followed by transport through the interplanetary medium (e.g., Desai & Giacalone 2016), Cane et al. (2006) have alternatively proposed that the initial increase and subsequent decrease in the ∼25–80 MeV nucleon−1 Fe/O time profiles in large SEP events is due to direct contributions of Fe-rich material accelerated in concomitant flares during the onset phase followed by contributions of material accelerated at CME-driven interplanetary shocks. Cane et al. (2006) also proposed that large SEP events in which the event-averaged ∼25–80 MeV nucleon−1 Fe/O is enhanced by more than a factor of ∼2 compared with the average SEP value of 0.134 likely comprise significant direct contributions from flares.
We first note that enhanced Fe/O ratios in SEP events reflecting the presence of impulsive material are also typically associated with high charge states of Fe (e.g., Klecker et al. 2007), and so the suggestion that high Fe/O values in the early phases of SEP events are due to the presence of such material predicts that the Fe ionization states during these periods should also be high; however, this is not observed (e.g., Guo et al. 2014). Next, we point out that the increases in the Fe/O ratio observed during the early phases of large SEP events has been successfully and quantitatively modeled in many studies as a transport effect (e.g., Tylka et al. 1999, 2005, 2012; Mason et al. 2012, 2014; Reames et al. 2013), and that in particular, the following three observational results in conjunction with the new results presented in this paper provide strong support for the counterargument that ∼0.1–500 MeV nucleon−1 H–Fe nuclei observed during large gradual SEPs are indeed accelerated by near-Sun CME-driven shocks. Thus, the bulk of the observations show that the suggestion that hypothesized "flare" contributions dominate the early phases of SEP event composition or the event-integrated SEP Fe/O abundances is not supported.
- 1.First, the Cane et al. (2006) scenario makes no specific predictions about the magnitude of 3He enrichments below ∼2 MeV nucleon−1 in large SEP events. Previously, we found that the ∼0.5–2 MeV nucleon−1 3He/4He ratio is enhanced between factors of ∼2–150 in ∼46% of large SEP events (Desai et al. 2006), and in Figure 9 we show that the ∼0.5–2 MeV nucleon−1 3He/4He ratio is enhanced between factors of ∼2–100 in ∼58% of the events. The magnitudes of these 3He-enrichments are substantially smaller than those found in the flare-related, impulsive SEP events (e.g., Mason et al. 2004) but are similar to those found in local interplanetary shock-associated events (Desai et al. 2003; Allegrini et al. 2008) and in particle events associated with corotating interaction regions or CIRs (Mason et al. 2008). This supports the notion that CME- and CIR-shocks routinely re-accelerate pre-existing suprathermal material already enriched in 3He from prior flare activity (Mason et al. 1999, 2005).
- 2.Second, many studies (e.g., Tylka et al. 1999; Mason et al. 2006, 2012; Reames 2015) have shown that temporal variations in the <100 MeV nucleon−1 Fe/O abundances in large SEP events are diminished or even eliminated if the Fe and O time-intensity profiles are compared at a scaled energy for the different species, indicating that these variations are due to differences in the Q/M ratios of the different species, and therefore better explained by interplanetary transport models that include the effects of focusing, diffusion, convection, adiabatic deceleration, and pitch-angle scattering.
- 3.Finally, Desai et al. (2006) surveyed the ∼0.1–60 MeV nucleon−1 event-integrated heavy ion abundances in 64 large SEP events, which included 61 of the 97 events studied by Cane et al. (2006). Twenty-seven of the events studied by Desai et al. (2006) and 21 of the first 30 events studied here were classified by Cane et al. (2006) as prompt and/or Fe-rich events, and therefore presumed to comprise significant direct flare contributions above ∼25 MeV nucleon−1. However, Desai et al. (2006) found that, regardless of the absolute values of the ∼0.11–0.14 and the ∼12–60 MeV nucleon−1 Fe/O ratios (which were indeed enhanced over the corresponding average solar wind value in 55 and 23 of the 64 events, respectively), the Fe/O ratio either decreased or remained constant with increasing energy in all but three events (see Figure 5(b) in Desai et al. 2006). This earlier result pointed to the significant influence of Q/M-dependent CME shock acceleration mechanisms at least up to ∼60 MeV nucleon−1 in the vast majority of the large SEP events classified by Cane et al. (2006) as being flare-dominated. In fact, this energy-dependence of the Fe/O ratio is fully consistent with the decrease in the spectral break energy with decreasing Q/M ratio, as observed in the case of 33 events studied here, consistent with the dominance of the effects of CME shock acceleration mechanisms up to the highest energies surveyed in this paper, i.e., up to ∼500 MeV nucleon−1 for H and up to ∼170 MeV nucleon−1 for He–Fe.
5.2. Properties of Near-sun CME Shocks and Turbulence Conditions
Comparing our survey to prior studies, we note that some of the five events studied by Mewaldt et al. (2005a) and Cohen et al. (2005) also included the local shock-accelerated ESP component that accompanied the larger SEP event. In the present study, we eliminated all events with possible contributions from local IP shock-associated populations (see Paper 1) in order to highlight SEP acceleration processes. Further, we use event-integrated fluences, rather than time-intensity profiles (see Mason et al. 2012), to study the SEP spectral properties. In particular, Mason et al. (2012) used a detailed model of interplanetary propagation and showed that transport from the inner solar system can lower the break energy systematically for all species as well as lower the slopes by ∼10%–20% but that the basic spectral form remained intact (their Figure 14). Alternatively, we note that Li & Lee (2015) fitted the double power-law proton spectra in 9 of the 16 GLE events studied by Mewaldt et al. (2005a) with an analytical model that included interplanetary transport effects, and found that single power-law spectra injected by CME shocks near the Sun can exhibit spectral breaks at 1 au due to scatter-dominated transport through the interplanetary medium. However, this model predicts that α for the GLE-associated SEP events should lie in the range ∼0.18–0.75, which is clearly inconsistent with the α > 1.58 observed in five of the seven GLEs in our survey (see Table 2). On this basis, we contend that the formation of the double power-law SEP spectral forms, their associated properties, and the observed Q/M-dependence of EB primarily reflect conditions near the distant CME-driven shocks where the acceleration takes place, and are not significantly affected by contributions from local interplanetary shock-accelerated populations nor by Q/M-dependent transport and scattering in the interplanetary turbulence en route to 1 au (e.g., see Zank et al. 2000; Cohen et al. 2005; Mason et al. 2012).
A fundamental prediction of early one-dimensional (1D) steady state as well as the more recent time-dependent DSA-based SEP models is that, in a given event, the differential energy spectrum of the accelerated particles below the break energy is characterized by a low-energy power-law spectral slope γ given by dj/dE ∝ E−γ (e.g., Drury 1983; Lee 2005; Schwadron et al. 2015b). These models also predict that γ is independent of ion species and determined solely by γ ≈ (H + 2)/(2H − 2), where H is the strength of the CME-driven shock. Our results show that both the SEP Band parameter γa and the low-energy spectral slope γ1 in a given SEP event are remarkably similar for all species, and that such species-independent spectral slopes are observed at both low and high energies for most of the events in our survey (Results 1 and 2). We therefore suggest that, to first order, the formation of double power-law spectra in large SEP events is consistent with DSA at near-Sun CME shocks (e.g., Schwadron et al. 2015b).
We now use the DSA-predicted relationship between γ (here we use the species-averaged γ1 for each event) and H to infer compression ratios of the near-Sun CME shocks. Figure 12 compares these inferred values to three key properties of CMEs and SEPs: (a) CME speed from SOHO/LASCO, (b) peak proton flux from GOES/EPS, and (c) α from Table 2. The main features of this figure are: (1) the inferred shock compression ratios for the 37 events shown here lie between ∼1–5.5, with H > 4 for 4 events. Note that all cases of H > 4 have sizeable uncertainties. Based on our low-energy spectral slopes, we find that the average inferred shock compression ratio for 33 near-Sun CME shocks is 2.49 ± 0.08. These inferred values are remarkably consistent with the predicted range of values for CME shock compression ratios (see Schwadron et al. 2015b), and are well within the constraints of the Rankine–Hugoniot discontinuity conditions for the allowable range of ∼1–4, with an upper limit of <4 for shocks in non-relativistic space plasmas (e.g., Viñas & Scudder 1986). (2) The compression ratio H exhibits weak but positive correlations with all three parameters: (a) CME speed: for 37 events, r ∼0.38 has <2% chance; (b) peak proton flux: for 29 events, r ∼0.35 has <6% chance; and (c) α: for 31 events, excluding events with H > 4, r ∼0.47 has <0.57% chance of being exceeded by uncorrelated pairs of parameters.
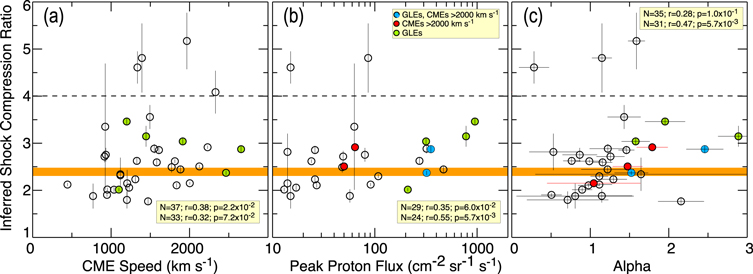
Figure 12. Scatter plots of the inferred shock compression ratio vs. (a) CME speed, (b) peak proton flux, and (c) α. Color-coded symbols denote SEP events as in Figure 8. Dashed line shows H = 4—the theoretical upper limit for the shock compression ratio in non-relativistic space plasmas. Orange shaded region encompasses the mean value and the standard error of the mean (2.41 ± 0.09) for 27 events excluding the four outliers with H > 4 and the six GLE-associated extreme SEP events (see Section 5.3).
Download figure:
Standard image High-resolution imageThe heavy ion fluence spectra in most SEP events have an average value of ∼1.23 at energies below ∼1 MeV nucleon−1 and steepen by ∼2.4 units above a roll-over or break energy to an average value of ∼3.63; the break energy decreases systematically with the ion's Q/M ratio (results 3 and 4). The Q/M-dependence of EB in a given SEP event is well represented by the function  and characterized by the power-law exponent α (Result 4). The values of α for 33 SEP events lie in the range ∼0.2–3 (result 5), which encompasses the range of α values reported by Mewaldt et al. (2005a) and Cohen et al. (2005). Thus, with the exception of three events with α > 2 (see Figures 1(f) and 7, and Section 5.3), the range of values for α in our survey is consistent with the corresponding range of ∼0.2–2 predicted by Li et al. (2009). In this model, the Q/M-dependence of the spectral break energies in a given SEP event occurs due to the "equal diffusion coefficient" or the "equal acceleration time" condition, and the event-to-event variations in the power-law exponent α are driven by differences in the slopes of the turbulence spectra present near shocks with different obliquity.
Assuming that the spectral break energies for different species in a given SEP event occur at the same value of the diffusion coefficient  8
, which scales as (M/Q)a with observed values of a between ∼0.8–2.7, Cohen et al. (2005) followed Dröge (1994) and inferred that the power-law index η of the turbulence or wave intensity spectrum, given by
8
, which scales as (M/Q)a with observed values of a between ∼0.8–2.7, Cohen et al. (2005) followed Dröge (1994) and inferred that the power-law index η of the turbulence or wave intensity spectrum, given by  , near the CME shock acceleration region ranged between 1.2 to −0.7. Here
  , and a is related to the exponent α in our survey by
  . We now follow the approach of Mewaldt et al. (2005a) and Cohen et al. (2005) to infer the power-law exponent a, which determines the scaling between the particle diffusion coefficient and the ion's M/Q ratio, and the power-law index η of the wave intensity spectrum for 27 SEP events in our survey. In this analysis, we only include events that satisfied the following criteria: (1) fitted values of α and the inferred values of a and η have relative uncertainties <100% and (2) −4 < η < +4 (see Section 5.3).
Figure 13 plots histograms of (a) a and (b) η; the red histograms represent extreme SEP events discussed in Section 5.3. Within the estimated uncertainties, the power-law exponent a in 15 out of 27 SEP events lies between ∼0.75–2.75 and is comparable to the range of values obtained by Cohen et al. (2005), as shown by the yellow shaded region. Also, a varies between ∼−0.33–3.9, which is roughly consistent with the typical range of ∼0.5–7 proposed recently by Schwadron et al. (2015b); in this model a < 1 implies a weak dependence of  on the ion's Q/M ratio, while a > 1 indicates that
  depends strongly on Q/M (also see Li et al. 2009; Battarbee et al. 2011, 2013; Vainio et al. 2014). We note that η in 27 events lies between −1.87 and 2.33; η in 15 events lies within the range ∼0.7–1.2 reported by Cohen et al. (2005). In nine events η > 1.2–the largest value reported by Cohen et al. (2005). Overall, in four events η > 5/3, where the turbulence intensity spectra near the distant CME shocks may be significantly steeper than the typical interplanetary Kolmogorov k−5/3 turbulence spectrum. In contrast, η ≤ 5/3 in 23 events, which implies that the turbulence spectra near the corresponding CME shocks are probably significantly flatter than the Kolmogorov spectrum. Finally, result 8 indicates that when EB is plotted versus γb–γa, the SEP events separate into two groups (γb–γa < 3 and >3), perhaps indicating that two competing mechanisms occur simultaneously in all SEP events: (1) Q/M-dependent processes that produce modest values for α (<1.4), and steeper spectra at higher energies that steepen significantly as the break energy increases, and (2) much stronger Q/M-dependent processes that produce higher values of α, relatively flatter spectra at high and low energies, and higher break energies (see Section 5.3).
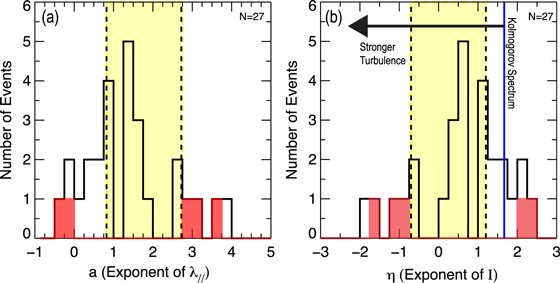
Figure 13. Histograms of (a) a, the power-law exponent of the M/Q dependence of the scattering mean free path  and (b) η, the power-law exponent of the wave intensity spectrum I near the CME-driven shock given by
  . The shaded yellow region depicts the range of values obtained by Cohen et al. (2005) in five SEP events; the blue vertical line represents η = 5/3, the typical interplanetary Kolmogorov spectrum, and red histograms represent the extreme SEP events discussed in Section 5.3.
Download figure:
Standard image High-resolution image5.3. Extreme SEP Events
Nine events in our survey can be considered "extreme" since they produced GLEs (see Mewaldt et al. 2012) or had CME speeds >2000 km s−1. These events are shown with solid color-coded symbols in Figures 8–12. Comparing these events as a group to the remaining events in our survey, the extreme events had:
- a.stronger dependence of the break energy on the Q/M ratio, resulting in α ≥ 1.4 versus α < 1.4;
- b.higher peak proton fluxes between ∼4 × 101–2 × 10³ versus ∼101–5 × 102 cm−2 sr−1 s−1;
- c.source locations from the "well-connected" region of the western hemisphere (longitude locations between W45–W90 versus E90–W120);
- d.a stronger positive correlation between the low-energy Fe/O and α;
- e.low-energy spectral parameters γa and γ1 similar to other events, and to the mean and median values of the overall distributions (e.g., γa ∼1.2);
- f.flatter spectra at higher energies compared to other events (γb ∼2.5–4 versus ∼2.5–7); and
- g.higher average O break energy compared with other events (∼1–12 MeV nucleon−1 versus 0.1–10 MeV nucleon−1).
While some of these features are due to the bias in our selection criteria (e.g., faster CME speeds, higher proton flux, flatter high-energy spectra), the others are not, and so may provide clues to the properties of extreme SEP events. Figures 10 and 11 show that all of these extreme events with α ≥ 1.4 have low values for γa, γb, and γb–γa, and that, collectively, they exhibit a negative trend between EB and γb–γa (Results 7 and 8). This indicates that the corresponding spectra are relatively flat at low and high energies, and that the break energy increases as the difference γb–γa between the SEP O Band parameters decreases. The fact that α > 2 in two of the seven GLE-associated SEP events in our study, taken together with the general result that higher values of α (≥1.4) are typically observed in SEP events associated with higher >10 MeV proton fluxes and faster (>2000 km s−1) western hemisphere CMEs and GLEs (see Figures 8 and 10), indicates that spectral properties in these extreme SEP events are most likely governed by highly efficient trapping and stronger Q/M-dependent scattering due to substantially enhanced wave power near the distant CME-driven shocks (see also Cohen et al. 2005; Li et al. 2009).
The above scenario is consistent with the following inferred results shown in this paper:
- 1.Figure 12 shows that the inferred values for the shock compression ratio H in these extreme events tend to be somewhat larger than the event average of 2.49 ± 0.08 for 33 events, and that the correlations between H versus peak proton flux and α are more significant for, and therefore likely to be driven by, these events.
- 2.
- 3.Four of the five SEP events (not shown in Figure 13) with the strongest observed Q/M-dependence in EB, i.e., with α > 1.6 and, are also extreme events, as defined above.


In summary, the extreme SEP events in our survey exhibit strong Q/M-dependencies in the EB, and therefore have larger α values, which correspond to extreme or above average values for a, η, and H. In contrast, most events in our survey (see Section 5.2) exhibit weaker Q/M-dependencies in the EB and are associated with steeper spectra at higher energies probably because the SEPs are accelerated at much slower and relatively weaker CME shocks, where the somewhat weaker turbulence allows the accelerated particles to escape more easily. Note that this interpretation is in contrast to the model of Schwadron et al. (2015a, 2015b), where the stronger Q/M-dependence of the diffusion coefficient facilitates particle escape and therefore produces steeper spectra at higher energies.
The question is, what special conditions or physical processes are responsible for causing the significantly stronger Q/M-dependence in the spectral break energies in extreme SEP events? We note that in many SEP acceleration models, strong Q/M-dependent scattering occurs primarily at quasi-parallel shocks where turbulence levels are expected to be higher and self-generated Alfvén waves may also be present (Ng et al. 2003; Li et al. 2009). We rule out the possibility that the five SEP events with α > 1.6 and  are due to strong scattering at the Bohm diffusion limit, i.e., when
  here ρg is the ion gyroradius, because the Bohm approximation represents the case for η = 1 and α = 1 (for details see Li et al. 2009), which is significantly smaller than the α values obtained for these events. Another possible source of enhanced turbulence are the Alfvén waves excited by protons, accelerated at earlier times, that escape and propagate upstream of the CME shock (e.g., Zank et al. 2007). Such self-generated Alfvén waves can trap and scatter the particles that are accelerated at later times much more efficiently (e.g., Ng et al. 2003) or stochastically re-accelerate the shock-accelerated particles downstream of the CME shocks (e.g., Afanasiev et al. 2014). Indeed, Ng et al. (2003) modeled the excitation of Alfvén waves by protons streaming away from CME shocks and found that the wave spectra could exhibit flat spectra with η ≈ 0, which corresponds to a = 2 and α = 4/3. In contrast, Battarbee et al. (2011) modeled SEP acceleration through self-generated turbulence near CME shocks with speeds of 1250, 1500, and 1750 km s−1, and predicted that the maximum value for α is ∼1.5–1.6. Comparing these predictions with α in the extreme SEP events suggests that such models, even though they include the nonlinear effects of self-generated Alfvén waves, still cannot account for the significantly stronger Q/M-dependence in the heavy ion spectral break energies reported here.
Enhanced turbulence conditions could also occur when the so-called "equal resonance condition" is met, as discussed by Li et al. (2003) and Rice et al. (2003). According to Zank et al. (2007) and Li et al. (2009), this condition occurs when α = 2 and  at parallel shocks in the limit of strong turbulence and scattering, i.e., when the wave power or intensity spectrum I(k) approaches a discontinuity. The equal resonance condition is a special case of the more general condition—the equal acceleration time or equal diffusion coefficient—discussed in Section 5.2 (see Li et al. 2009). However, we note that the values of α in two GLEs (events 16 and 25) are more than 1σ greater than the maximum value of α ≈ 2, predicted by Li et al. (2005, 2009). Thus, for these events, α > 2 corresponds to a < 0 or a > 8 and
  , i.e., where the wave power I(k) becomes essentially discontinuous. This implies that scattering and trapping of particles near distant CME shocks in such events is so strong that the Q/M-dependence of the spectral break energies exceeds the limit of the equal resonance condition. We therefore suggest that the larger than predicted values for α in some of the extreme events in our survey indicate that the underlying mechanisms have not yet been fully incorporated in current theoretical models.
In most existing theoretical models, the strongest Q/M-dependence occurs at quasi-parallel shocks (e.g., Li et al. 2009). Such shocks, with low-injection thresholds, are expected to primarily inject and accelerate the low-energy solar wind or ambient coronal ions (e.g., Tylka & Lee 2006; however, see Giacalone 2005 for an alternative viewpoint). In contrast, and consistent with the results reported in Paper 1, we find that many of the extreme events that exhibit strong Q/M-dependent spectral break energies are also Fe-rich and 3He-rich (see Figure 9 and Paper 1). Specifically, we note that the ∼0.16–23 MeV nucleon−1 Fe/O ratio is enhanced between factors of ∼2–10 compared to the average SEP value of ∼0.134 in seven of the nine extreme SEP events, while the ∼0.5–2.0 MeV nucleon−1 3He/4He ratio is enhanced by more than an order of magnitude over the corresponding solar wind value in five extreme SEPs. This points to the importance of contributions of suprathermal flare-origin material to the seed populations even in cases where turbulence levels are significantly enhanced and the fast CME shocks are quasi-parallel. We suggest that in such events, the enhanced turbulence traps, injects, and accelerates the higher energy suprathermals much more efficiently than the co-existing lower energy solar wind or ambient coronal ions. Simultaneously, the equal diffusion coefficient condition causes the spectral break energies to exhibit stronger Q/M-dependence, occasionally exceeding the equal resonance condition limit, as in the case of two SEP events that produced GLEs. We therefore suggest that our results for extreme events can be reconciled with SEP models provided that they include suprathermal flare-origin material as an important component of the seed population that is available for acceleration at near-Sun CME shocks.
6. SUMMARY AND CONCLUSIONS
We fit the ∼0.1–500 MeV nucleon−1 H–Fe ion fluences in 46 isolated, large gradual SEP events observed during solar cycles 23 and 24 and surveyed in Paper 1 with the four-parameter Band function that yields a normalization constant, low- and high-energy Band parameters γa and γb, and break energy EB. We also calculate the low-energy power-law spectral slope γ1. We find that: (1) in a given SEP event, γa, γb and γ1 are remarkably similar for all species, and the energy spectra steepen with increasing energy by ∼2.4 units from a mean value of ∼1.23 below the roll-over or break energy to ∼3.63; (2) EB varies between ∼0.1–200 MeV nucleon−1; average and 1σ values of EB are ∼6 MeV nucleon−1 and ∼16 MeV nucleon−1, respectively. The EB in a given SEP event varies systematically according to the ion's Q/M ratio, and this dependence is characterized by the α given by fitting  ; (3) the average value of α is ∼1.3. α varies between ∼0.2–3, and is well-correlated with the Fe/O ratio at ∼0.16–0.23 MeV nucleon−1, but not with the ∼15–21 MeV nucleon−1 Fe/O and the ∼0.5–2.0 MeV nucleon−1 3He/4He ratios; (4) in most SEP events, α < 1.4, the spectra steepen significantly at higher energy with γb–γa > 3, and EB increases with increasing γb–γa; and (5) in many extreme SEP events (those associated with fast (>2000 km s−1), western hemisphere CMEs and GLEs), the energy spectra are relatively flatter at low and high energies with the difference γb–γa < 3; the break energies increase as
  the events have stronger Q/M-dependence in EB with α ≥ 1.4 and are Fe-rich and 3He-rich. The average change between the low- and high-energy spectral slopes in extreme events is ∼2.4 units with σ ∼0.4 units, compared to ∼3 units with σ ∼0.96 units for the rest of the events.
Our results have the following implications for current models of SEP acceleration at near-Sun CME shocks. The species-independence of SEP Band parameters and the low-energy spectral slope, and the systematic Q/M dependence of the break energies within an event, and the range of values for α, suggest that the formation of double power laws in SEP events occurs primarily due to DSA at near-Sun CME shocks as predicted by Li et al. (2009) and Schwadron et al. (2015b), rather than scattering in the interplanetary turbulence as predicted by Li & Lee (2014). Based on the low-energy spectral slopes, we infer that the compression ratios for 33 CME shocks lie between ∼1–4 with an average value of 2.49 ± 0.08, as predicted by Schwadron et al. (2015b). Furthermore, the systematic Q/M-dependence of the spectral break energies in a given SEP event is consistent with the equal diffusion coefficient condition in which the energy spectra of different heavy ion species roll over at the same value of the diffusion coefficient, as predicted by Li et al. (2009). The event-to-event variations in α occur due to differences in the power-law slopes of the wave intensity spectra near the distant CME shocks, and may also provide clues about the remote shock's obliquity. In most events, the SEPs are accelerated by CME-driven shocks where the relatively weaker turbulence results in weaker Q/M-dependence of the break energies and lower values for α (<1.4). Even though in the majority of these events (23 of 27), the turbulence spectra are flatter than the typical interplanetary Kolmogorov k−5/3 turbulence spectrum, the accelerated SEPs can still easily escape from the CME shock, causing the spectra to steepen significantly at higher energies. In contrast, the significantly stronger Q/M-dependence of the break energies, larger values of α, and the relatively flatter spectra at high and low energies occur in nine extreme SEP events due to extreme values of the turbulence spectral slopes near faster (>2000 km s−1) and stronger CME-driven shocks. We suggest that most DSA-based SEP models (e.g., Ng et al. 2003; Batterbee et al. 2011, 2013; Schwadron et al. 2015b; and Li et al. 2009) are unable to fully account for spectral properties in extreme SEP events because the substantially enhanced wave power and associated turbulence can scatter, trap, inject, and accelerate suprathermal flare-origin material more efficiently than the co-existing ambient coronal or solar wind ions.
We are grateful to the members of the Space Physics Group at the University of Maryland and the Johns Hopkins Applied Physics Laboratory (JHU/APL) for the construction of the ULEIS instrument and to members of Space Radiation Laboratory at the California Institute of Technology for the construction of the SIS instrument. We acknowledge use of the NOAA GOES and SOHO/ERNE proton data. Work at SwRI is partially supported by NASA grants NNX13AE07G and NNX13AI75G, NASA contracts NNX10AT75G and NNN06AA01C, and NSF Grants AGS-1135432 and AGS-1460118. Work at APL was supported by NASA grants NNX13AR20G/115828 and 44A-1091698.
Footnotes
- 8
Here
, where v is particle speed and is the parallel scattering mean free path.

