


ABSTRACT
Compiling data from literature and the Atacama Large Millimeter/submillimeter Array archive, we show enhanced HCN(4–3)/HCO+(4–3) and/or HCN(4–3)/CS(7–6) integrated intensity ratios in circumnuclear molecular gas around active galactic nuclei (AGNs) compared to those in starburst (SB) galaxies (submillimeter HCN enhancement). The number of sample galaxies is significantly increased from our previous work. We expect that this feature could potentially be an extinction-free energy diagnostic tool of nuclear regions of galaxies. Non-LTE radiative transfer modelings of the above molecular emission lines involving both collisional and radiative excitation, as well as a photon trapping effect, were conducted to investigate the cause of the high line ratios in AGNs. As a result, we found that enhanced abundance ratios of HCN to HCO+ and HCN to CS in AGNs as compared to SB galaxies by a factor of a few to even ≳10 are a plausible explanation for the submillimeter HCN enhancement. However, a counterargument of a systematically higher gas density in AGNs than in SB galaxies can also be a plausible scenario. Although we cannot fully distinguish these two scenarios at this moment owing to an insufficient amount of multi-transition, multi-species data, the former scenario is indicative of abnormal chemical composition in AGNs. Regarding the actual mechanism to realize the composition, we suggest that it is difficult with conventional gas-phase X-ray-dominated region ionization models to reproduce the observed high line ratios. We might have to take into account other mechanisms such as neutral–neutral reactions that are efficiently activated in high-temperature environments and/or mechanically heated regions to further understand the high line ratios in AGNs.
Export citation and abstract BibTeX RIS
1. INTRODUCTION
The dense molecular medium in the centers of galaxies plays a key role in their evolution because it is the reservoir of fuel for active galactic nuclei (AGNs), as well as the site of massive star formation. On the other hand, these heating sources can conversely alter the chemical composition of their surrounding medium in radiative and/or mechanical ways. Thus, investigating such dense molecular gas can be essential to study the nature of the nuclear region accompanying these activities.
Recent chemical modelings of interstellar medium (ISM) predict that the various heating mechanisms will produce different signatures in molecular gas composition. For example, intense UV radiation from massive stars forms photodissociation regions (PDRs) around them, and X-ray-dominated regions (XDRs), which are larger in volume than PDRs owing to the higher penetrating capability of the X-ray, are formed at the vicinity of AGNs (e.g., Maloney et al. 1996; Hollenbach & Tielens 1997, 1999; Meijerink & Spaans 2005; Meijerink et al. 2006, 2007; Bayet et al. 2008, 2009). Cosmic rays from frequent supernovae (SNe) and the injection of mechanical energy due to SNe or AGN jet/outflow (mechanical heating) are also important in shaping chemical composition (e.g., Loenen et al. 2008; Bayet et al. 2011; Meijerink et al. 2011; Kazandjian et al. 2012, 2015; Rosenberg et al. 2014a, 2014b; Matsushita et al. 2015). In addition to the gas-phase reactions, inclusion of dust grain chemistry will influence the chemical composition as well (e.g., Charnley & Rodgers 2005; Garrod et al. 2008). It is noteworthy that the temperature of the gas is essentially important for the efficiency of chemical reactions, especially at the vicinity of powerful heating sources (e.g., Rodgers & Charnley 2001; Nomura & Millar 2004; Harada et al. 2010, 2013); for example, under the high-temperature conditions, we can expect an enhanced abundance of HCN owing to the activated neutral–neutral reactions from CN.
Based on the above descriptions, we can deduce that it would be possible to construct a diagnostic method of the dominant energy source in galaxies such as an AGN and a starburst (SB) by utilizing the potential chemical differences between them. To do so, millimeter/submillimeter spectroscopic observations are of great importance because these wavelengths do not suffer from dust extinction, which is critical to probe dusty nuclear regions. In addition, a high spatial and spectral resolution provided by millimeter/submillimeter interferometers can also give us critical information on gas kinematics in the central ≲100 pc scale region, which is necessary to study feeding mechanisms of central supermassive black holes (e.g., Fathi et al. 2013).
With these things in mind, many key molecules have been raised so far as useful observational diagnostic tools. Among them, an enhanced intensity of HCN(1–0), whose critical density (ncr) for collisional excitation is  cm−3, with respect to HCO+(1–0) and/or CO(1–0) has been proposed as a unique feature to AGNs (e.g., Jackson et al. 1993; Sternberg et al. 1994; Tacconi et al. 1994; Kohno et al. 2001; Usero et al. 2004; Kohno 2005; Imanishi et al. 2007b; Krips et al. 2008; Davies et al. 2012). Using these line ratios, Kohno et al. (2001) constructed a potential diagnostic diagram (mm-HCN diagram; see also Kohno 2005). But there are some counterarguments to this diagnostic that high HCN(1–0)/HCO+(1–0) ratios are observed in non-AGNs (Costagliola et al. 2011; Snell et al. 2011), as well as low HCN(1–0)/HCO+(1–0) in AGNs (e.g., Sani et al. 2012). The latter inconsistency could be due to strong spectral contamination from the likely coexisting SB activities that dilutes emission from an AGN-influenced region such as an XDR (see also Section 4.6). Furthermore, the cause of the enhancement has not been clear because many different mechanisms can contribute to this enhancement: higher gas opacities, densities, and temperatures (excitation conditions), and/or abundance variations caused by different heating mechanisms. A noncollisional excitation, such as infrared (IR) pumping caused by the re-radiation from UV/X-ray-heated dust, could also be important (e.g., Aalto et al. 2002, 2007; Graciá-Carpio et al. 2006; Sakamoto et al. 2010; Imanishi & Nakanishi 2013a; Matsushita et al. 2015), especially in (ultra)luminous infrared galaxies ((U)LIRGs).
Similar to the above-mentioned J = 1–0 transitions, Izumi et al. (2013, hereafter I13) found that HCN(4–3)/HCO+(4–3) and HCN(4–3)/CS(7–6) integrated intensity ratios seem to be higher in AGNs than in SB galaxies (submillimeter HCN enhancement) and proposed a diagnostic diagram hereafter referred to as a "submm-HCN diagram" using these line ratios. One advantage of the submm-HCN diagram over the previous diagnostics using the HCN(1–0) line would be that higher angular resolution is easily achievable at higher J compared to J = 1–0 transitions, which is essentially important to exclude contamination from SB activity to the line emission from AGN-heated gas. Moreover, it is much more applicable to high-redshift galaxies by using high-J lines because submillimeter lines can be covered by the Atacama Large Millimeter/submillimeter Array (ALMA) up to, e.g., z ∼ 3 for the case of J = 4–3 transitions of HCN and HCO+. These lines can be simultaneously observed with ALMA, which is necessary to obtain accurate line ratios, in terms of both little systematic flux uncertainty and, to a lesser extent, differences in the uv coverage. In addition, since these transitions have orders of magnitude higher critical densities ( 106–7 cm−3) than the J = 1–0 transitions (
 104–5 cm−3), they are less contaminated by the foreground and/or disk emission, thus suitable to probe the densest gas in the obscured nuclear regions of galaxies.
However, despite the above advantages, the proposed diagram of I13 was very tentative as (1) it was based on as small as a five-galaxy sample and (2) they mixed galaxies observed at a wide range of spatial resolutions (∼100 pc–1 kpc), which would combine flux contributions from various components. In order to assess the potential of the submm-HCN diagram, we need high spatial resolution observations, allowing us to isolate the AGN emission from likely contamination due to a coexisting SB, together with SB samples observed at matched spatial resolutions. Indeed, Schleicher et al. (2010) predicted that the distance out to which AGN heating with X-ray luminosity of ∼1043 erg s−1 (a typical value for luminous Seyfert galaxies) dominates in dense gas ( 104–5 cm−3) with a soft UV radiation field of ∼100 G019
is only ≲100 pc (see also Appendix A of Izumi et al. 2015). Furthermore, high-resolution observations of the nuclear regions of nearby Seyfert galaxies revealed that there sometimes is a ring-like SB region that is hundreds of parsecs to a kiloparsec in scale, which surrounds 100 pc scale dense molecular gas concentrations at the nucleus in both luminous AGNs (e.g., García-Burillo et al. 2014; Izumi et al. 2015) and low-luminosity AGNs (I13; Martín et al. 2015). We hereafter call the latter kind of (100 pc scale) central molecular concentration a circumnuclear disk (CND) in general.
104–5 cm−3) with a soft UV radiation field of ∼100 G019
is only ≲100 pc (see also Appendix A of Izumi et al. 2015). Furthermore, high-resolution observations of the nuclear regions of nearby Seyfert galaxies revealed that there sometimes is a ring-like SB region that is hundreds of parsecs to a kiloparsec in scale, which surrounds 100 pc scale dense molecular gas concentrations at the nucleus in both luminous AGNs (e.g., García-Burillo et al. 2014; Izumi et al. 2015) and low-luminosity AGNs (I13; Martín et al. 2015). We hereafter call the latter kind of (100 pc scale) central molecular concentration a circumnuclear disk (CND) in general.
In this paper, we compile literature and archival data of HCN(4–3), HCO+(4–3), and CS(7–6) emission lines of various AGNs and SB galaxies to improve the statistics of the submm-HCN diagram and to explore the cause of the HCN enhancement. Section 2 describes the collected data. An updated submm-HCN diagram is shown in Section 3. Section 4 presents simple non-LTE radiative transfer models involving HCN(4–3), HCO+(4–3), and CS(7–6). We examine the impact of both excitation and molecular abundance on the line ratios there. In Section 5, we discuss possible chemical scenarios to realize the potential abundance variation suggested in Section 4. At last, our main conclusions of this work are summarized in Section 6.
2. DATA
In this work, we first compiled interferometric data of the target emission lines of extragalactic objects from the literature. We refer to data obtained with spatial resolutions better than 500 pc as the high-resolution sample. The threshold resolution of 500 pc is large enough to fully encompass the typical size of CNDs in nearby galaxies, as well as small enough to exclude line emission from non-CND components such as circumnuclear SB rings in most cases. These data are further compared with rather lower resolution interferometric data (spatial resolution >500 pc) and single-dish data (typical spatial resolution >1 kpc) with firm detections of emission lines (>5σ). These data are called the low-resolution sample and will be used to investigate the impact of different spatial resolution on our diagnostics. As a result, we compiled line emission data of NGC 1068, NGC 1097, NGC 1365, NGC 4945, NGC 7469, NGC 4418, IRAS 12127-1412, M82, NGC 253, NGC 1614, NGC 3256, NGC 3628, NGC 7552, IRAS 13242-5713, N113 (LMC), and N159 (LMC). Moreover, in the case with sufficiently high resolution data, we measured line ratios at different representative positions within the same galaxy. The name of each position, such as NGC 1097 (AGN) and NGC 1097 (SB ring), is used hereafter. Note that we classify the data of NGC 4945 obtained with the APEX ∼ 450 pc (18'') aperture into the low-resolution sample, because it hosts a relatively compact circumnuclear SB ring with a radius of 2 5 (∼60 pc) inside the beam. On the other hand, the spatial resolution of the two Large Magellanic Cloud (LMC) objects are orders of magnitude higher than the other high-resolution sample owing to their proximity. We nevertheless keep using their ratios considering the rarity of high-resolution extragalactic measurements of the emission lines used in this work. We emphasize that excluding these LMC objects does not change our conclusion at all.
Then, the total number of data points is 16 and 9 for the high- and low-resolution sample, respectively. Hence, we improved the statistics significantly (a factor of 5 for the combined sample) from I13. The resultant HCN(4–3)/HCO+(4–3) and HCN(4–3)/CS(7–6) line ratios of each data point (hereafter we denote them as  and
and  , respectively) are summarized in Table 1 with relevant information.
Table 1.
 and
and  in AGNs, Buried AGNs, and SB Galaxies
| Objecta | Distanceb | Typec | Telescoped | Spatial Resolutione |
 f
f
|
 g
g
|
Referenceh |
|---|---|---|---|---|---|---|---|
| (Mpc) | (pc) | ||||||
| High-resolution (<500 pc) Sample | |||||||
| NGC 1068 (AGN) | 14.4 | AGN | ALMA | 35 | 1.53 ± 0.34 | 8.84 ± 2.51 | (1) |
| NGC 1068 (E-knot) | 14.4 | AGN | ALMA | 35 | 2.84 ± 0.60 | 8.04 ± 1.72 | (1) |
| NGC 1068 (W-knot) | 14.4 | AGN | ALMA | 35 | 3.19 ± 0.71 | 11.97 ± 3.45 | (1) |
| NGC 1068 (CND-N) | 14.4 | AGN | ALMA | 35 | 3.14 ± 0.72 | 12.79 ± 4.48 | (1) |
| NGC 1068 (CND-S) | 14.4 | AGN | ALMA | 35 | 2.58 ± 0.19 | >4.21 | (1) |
| NGC 1097 (AGN) | 14.5 | AGN | ALMA | 94 | 2.01 ± 0.29 | >12.66 | (2) |
| NGC 7469 (AGN) | 70.8 | AGN | ALMA | 154 | 1.11 ± 0.13 | 9.50 ± 3.02 | (3) |
| M82 | 5.2 | SB | JCMT | 353 | 0.41 ± 0.12 | 4.09 ± 1.14 | (2) |
| NGC 253 | 3.0 | SB | JCMT, APEX | 262 | 1.03 ± 0.22 | 3.40 ± 0.73 | (2) |
| NGC 1097 (SB ring) | 14.5 | SB | ALMA | 94 | 0.82 ± 0.17 | >1.38 | (2) |
| NGC 1614 | 69.1 | SB | ALMA | 468 | 0.24 ± 0.06 | >3.54 | (4) |
| NGC 7469 (SB ring position-B) | 70.8 | SB | ALMA | 154 | 0.75 ± 0.14 | >3.65 | (3) |
| NGC 7469 (SB ring position-C) | 70.8 | SB | ALMA | 154 | 0.45 ± 0.08 | 2.50 ± 1.16 | (3) |
| NGC 7469 (SB ring position-D) | 70.8 | SB | ALMA | 154 | 0.48 ± 0.06 | 3.03 ± 1.19 | (3) |
| N113 (LMC) | 0.05 | SB | ASTE | 5.3 | 0.21 ± 0.06 | 1.30 ± 0.58 | (5) |
| N159 (LMC) | 0.05 | SB | ASTE | 5.3 | 0.11 ± 0.03 | 2.16 ± 0.60 | (6) |
| Low-resolution (>500 pc) Sample | |||||||
| NGC 1068 (APEX) | 14.4 | AGN | APEX | 1257 | 1.85 ± 0.42 | 5.00 ± 1.47 | (7) |
| NGC 1365 | 16.9 | AGN | APEX | 1475 | 0.59 ± 0.15 | 2.83 ± 1.17 | (7) |
| NGC 4418 | 31.3 | buried AGN | SMA | 790 | 1.64 ± 0.25 | 1.98 ± 0.30 | (2) |
| NGC 4945 | 5.2 | AGN | APEX | 454 | 0.78 ± 0.17 | 3.21 ± 0.70 | (7) |
| IRAS 12127-1412 | 627.4 | buried AGN | ALMA | 1667 | 1.58 ± 0.58 | 4.32 ± 2.17 | (8) |
| NGC 3256 | 37.4 | SB | APEX | 3265 | 0.39 ± 0.11 | 1.38 ± 0.51 | (7) |
| NGC 3628 | 7.7 | SB | APEX | 672 | 0.36 ± 0.11 | 1.80 ± 0.90 | (7) |
| NGC 7552 | 19.5 | SB | APEX | 1702 | 0.54 ± 0.15 | 2.17 ± 0.92 | (7) |
| IRAS 13242-5713 | 42.0 | SB | APEX | 3667 | 1.23 ± 0.29 | 2.39 ± 0.66 | (7) |
Notes.
aFor NGC 1068, we list the data obtained with both ALMA (archival data: ID = 2011.0.00083.S) and APEX. The ratios of ALMA data are extracted at the positions of the AGN, E-knot, W-knot, CND-N, and CND-S. (See their coordinates in García-Burillo et al. (2014) or Viti et al. (2014).) For NGC 1097 and NGC 7469, the ratios extracted at both the AGN position and the circumnuclear SB ring are listed. See their locations in I13 and Izumi et al. (2015). Brief descriptions of each object are presented in Appendix5 radius). For interferometric data, we list the geometrical mean of the FWHM of the major and minor axes of the synthesized beams.
f, gIntegrated intensity ratios of HCN(4–3)/HCO+(4–3) and HCN(4–3)/CS(7–6) in the brightness temperature scale. The systematic errors are taken into account. We assume 15% systematic error if it is not mentioned in the references. As for the  in NGC 4418, we mention that 05 observations of Sakamoto et al. (2013) found it to be ∼2.
hReferences for the
in NGC 4418, we mention that 05 observations of Sakamoto et al. (2013) found it to be ∼2.
hReferences for the  and
and  (1) this work, but also see García-Burillo et al. (2014) and Viti et al. (2014) for NGC 1068; (2) I13 and references therein; (3) Izumi et al. (2015); (4) Imanishi & Nakanishi (2013b); (5) Paron et al. (2014); (6) Paron et al. (2016); (7) Zhang et al. (2014); (8) Imanishi & Nakanishi (2014).
Download table as: ASCIITypeset image
We categorized the target galaxies into three classes of nuclear activities, namely, AGN, buried AGN, and SB, based on the following criteria.
- 1.AGN: galaxies with clear broad Balmer lines (including polarized ones), or those with prominent hard X-ray (>2 keV) point sources with time variability. Therefore, galaxies with conventional AGN signatures naturally belong to this category.
- 2.Buried AGN: galaxies showing little (or no) AGN signatures at X-ray and optical wavelengths, but have been claimed to possess AGNs that are deeply embedded in dust along virtually all sight lines. These galaxies are identified at infrared wavelength by detections of, e.g., continuum emission from a hot (≳200 K) dust component, a deep silicate absorption feature, and a small equivalent width of polycyclic aromatic hydrocarbon (PAH) emission (e.g., Imanishi et al. 2007a).
- 3.SB: galaxies with no signature of either AGN and buried AGN but that host prominent SBs at their nuclear regions.
Brief descriptions of each galaxy relating the above criteria are presented in Appendix  because of the nondetections (<3σ) of the CS(7–6) emission line. However, we include them in our sample, taking the rarity of extragalactic interferometric observations of submillimeter dense gas tracers into account.
As for NGC 1068, which is the best-studied nearby type 2 Seyfert galaxy, we used ALMA band 7 data retrieved from the ALMA Science Archive20
(ID = 2011.0.00083.S). Although these data were already presented extensively in García-Burillo et al. (2014) and Viti et al. (2014), we reanalyzed the data to obtain high-resolution values of the  and
and  , since the exact values of these ratios are not presented in García-Burillo et al. (2014), and the ratios in Viti et al. (2014) were averaged ones with a 100 pc aperture. We used MIRIAD (Sault et al. 1995) for this analysis. The synthesized beams and the rms noises in channel maps of the target emission lines were typically 05 × 04 (which corresponds to 35 pc × 28 pc at the assumed distance of NGC 1068 = 14.4 Mpc) and 2.5 mJy beam−1 at a velocity resolution of ∼7 km s−1, respectively. The rms noises and measured fluxes of these lines are in good agreement with the published data. We assume the absolute flux uncertainty to be 15%.
At the end of this section and before constructing an updated submm-HCN diagram, we mention the likely limited applicability of our molecular diagnostics to some buried AGNs. Recent high-resolution observations of both vibrationally ground (v = 0) and excited (v = 1) HCN emission lines toward heavily obscured nuclei of ULIRGs revealed severe self- and/or continuum-absorption features at v = 0 (Aalto et al. 2015a). In the case of self-absorption, it is hard to extract physical/chemical information from line ratios. Thus, any kind of energy diagnostics employing such absorbed lines will have a limited power. So far, such self-absorption features in our target emission lines have been observed only in heavily obscured nuclei for the case of extragalactic objects (e.g., Arp 220W, with a line-of-sight H2 column density of  1025 cm−2; Scoville et al. 2015). Therefore, this can be a central issue in buried AGNs with a steep temperature gradient in gas, whose line-of-sight hydrogen column densities are extremely large (≳1025–26 cm−2; e.g., Sakamoto et al. 2013). Contrary to these galaxies, we consider that such self-absorption will not be a severe problem in Compton-thin AGNs primarily because of the low optical depth of HCN(4–3) emission (∼a few in NGC 1097 and NGC 7469; I13; Izumi et al. 2015). This is in clear contrast to the extremely high optical depth (≳100) in Arp 220W (Scoville et al. 2015). Moreover, no such absorption feature was found even in the Compton-thick AGN of NGC 1068 (total hydrogen column density derived by X-ray observations NH ∼ 1025 cm−2; Marinucci et al. 2012, 2016)21
observed at as high as 35 pc resolution (the data used in this work). Clearly, very extreme conditions are required to yield that feature.
1025 cm−2; Scoville et al. 2015). Therefore, this can be a central issue in buried AGNs with a steep temperature gradient in gas, whose line-of-sight hydrogen column densities are extremely large (≳1025–26 cm−2; e.g., Sakamoto et al. 2013). Contrary to these galaxies, we consider that such self-absorption will not be a severe problem in Compton-thin AGNs primarily because of the low optical depth of HCN(4–3) emission (∼a few in NGC 1097 and NGC 7469; I13; Izumi et al. 2015). This is in clear contrast to the extremely high optical depth (≳100) in Arp 220W (Scoville et al. 2015). Moreover, no such absorption feature was found even in the Compton-thick AGN of NGC 1068 (total hydrogen column density derived by X-ray observations NH ∼ 1025 cm−2; Marinucci et al. 2012, 2016)21
observed at as high as 35 pc resolution (the data used in this work). Clearly, very extreme conditions are required to yield that feature.
While carefully paying attention to these facts, we still keep using our buried AGN samples in this work because we cannot identify such absorption features in their spectrum at this moment (Sakamoto et al. 2010, 2013; Imanishi & Nakanishi 2014). These galaxies are not used for a detailed quantitative discussion, but are used only to see an overall trend of line ratios. On the other hand, our discussion in the following is mostly based on the high-resolution sample of AGNs and SB galaxies. Therefore, inclusion of our buried AGN samples will not harm our conclusion. Of course, we admit that it is plausible that these buried AGNs would show absorption features when they are observed at higher spatial resolutions, but a quantitative assessment of this point is beyond the scope of this paper. Note that optically thinner emission and their ratios (e.g., H13CN/H13CO+ ratio) seem to elucidate the nuclear physical/chemical conditions more straightforwardly in the case of obscured systems. We leave these caveats to future high-resolution observations with ALMA.
3. UPDATED SUBMILLIMETER-HCN DIAGRAM
Based on the data in Table 1, we here update the submm-HCN diagram proposed by I13. We first show the result using only the high-resolution sample (spatial resolution <500 pc) in Figure 1, to avoid strong contamination from the surrounding SB regions as much as possible. As a result, one can find a clear trend that AGNs exhibit higher  and/or
  than SB galaxies, which supports our previous claim in I13.

Figure 1. Submillimeter-HCN diagram using HCN(4–3)/HCO+(4–3) and HCN(4–3)/CS(7–6) integrated intensity ratios ( and
and  in the text, respectively) in the brightness temperature scale. Only the data obtained with high-resolution observations (spatial resolution <500 pc, except for NGC 4945) are used. The red circles and the blue squares indicate AGNs and SB galaxies, respectively. The abbreviated names of AGNs are shown. Here the term "AGN" simply means that the galaxy hosts an AGN, regardless of its dominance in the total energy budget of the galaxy. See Table 1 for the details of the data. The systematic errors are also included here.
Download figure:
Standard image High-resolution imageThe influence of spatial resolution on this line diagnostic is investigated in Figure 2, with the low-resolution sample superposed (spatial resolution >500 pc). We found that SB galaxies continue to show lower  and
and  than most AGNs. On the other hand, NGC 1365 and NGC 4945 (both are AGNs) show line ratios fully comparable to SB galaxies, which is in contrast to the trend of the high-resolution AGN sample. We suspect that in these two Seyfert galaxies, contamination from coexisting SB regions in line fluxes would be substantial when observed at the APEX 18'' beam. Indeed, both NGC 1365 and NGC 4945 host a prominent circumnuclear SB ring with a radius of 5''–10'' (NGC 1365) and 25 (NGC 4945) associating a large amount of molecular gas (Marconi et al. 2000; Galliano et al. 2005; Chou et al. 2007; Sakamoto et al. 2007; Alonso-Herrero et al. 2012b). Regarding the energetics, the equivalent widths of the 11.3 μm PAH feature are 432 nm (with 204 × 153 aperture; Wu et al. 2009) in NGC 1365 and 358 nm (with 37 slit; Esquej et al. 2014) in NGC 4945, respectively. These widths are significantly larger than those of NGC 1068 (9 nm with 036 slit, i.e., similar to the ALMA beam) and NGC 7469 (31 nm with 075 slit, i.e., similar to the ALMA beam), for example (Esquej et al. 2014). Moreover, the 25–60 μm IRAS colors in NGC 1365 and NGC 4945 are 0.14 and 0.04, respectively. These equivalent widths and IR colors are clearly categorized in the SB regime (Wu et al. 2009). Therefore, the low line ratios in NGC 1365 and NGC 4945 compared to the high-resolution AGN samples would highlight the importance of high spatial resolution (likely to be ≲50–100 pc scale in these cases) to robustly identify low-luminosity AGNs accompanying prominent circumnuclear SBs based on this diagram. This would reflect the limited spatial extent of the energetic influence of AGNs such as XDRs (Schleicher et al. 2010; Izumi et al. 2015).

Figure 2. Same as Figure 1, but the whole sample, including both the high-resolution (spatial resolution <500 pc; filled symbols) and the low-resolution (spatial resolution >500 pc; open symbols) data, is plotted. The red circles, green diamonds, and blue squares indicate AGNs, buried AGNs, and SB galaxies, respectively (see also Table 1). The abbreviated names of AGNs and buried AGNs are shown. See Table 1 for the details of the data. The systematic errors are included here.
Download figure:
Standard image High-resolution imageOn the other hand, once we achieve the high resolution, we should carefully treat the spatially resolved measurements of the line ratios because they would reflect very local physics and/or underlying chemistry even within a single AGN environment (Viti et al. 2014). This is clearly manifested by NGC 1068 (Figure 2); both  and
and  measured with ALMA (05 beam) at the different positions within the CND are different from those with APEX (18'' beam). Contrary to this case, spatial resolution seems not to play an important role for the ratios of SB galaxies because both the high- and low-resolution samples exhibit comparable line ratios as already mentioned (see also Table 1). This could be reconciled if an SB region has a more extended nature (i.e., ensemble of massive star-forming regions) than a compact CND around an AGN.
Considering the above, we suggest from Figures 1 and 2 that (1) galaxies energetically dominated by AGNs show enhanced  and/or
  and (2) those by SBs show lower values in both ratios than AGNs. We also point out that the buried AGNs of our sample tend to exhibit relatively high
  (≳1.5) but rather low
  (∼a few), which is comparable to SB galaxies. These buried AGNs belong to our low-resolution sample. Thus, one concern is that the line ratios will change when observed at a higher resolution. However, at least for NGC 4418, we suppose that such a situation would be unlikely because ∼100 pc scale observations of HCN(4–3) and HCO+(4–3) revealed that the dense molecular gas is well confined in the central ∼100 pc region (Sakamoto et al. 2013; Costagliola et al. 2015). Therefore, the location of this galaxy will more or less hold in Figure 2 even when observed at ∼100 pc resolution, although we need to increase the high-resolution sample of buried AGNs to examine their overall trend in this diagram. In the following sections, we will investigate possible causes for the HCN enhancement in AGNs, from the perspectives of both line excitation and abundance (ISM chemistry). The line ratios of the high-resolution samples shown in Figure 1 should be the reference for the discussion in the following, as those of the low-resolution samples (especially AGNs) are highly likely to be contaminated by various other components. We should note that the observed line ratios are the integrated ones over not only some areas but also the line-of-sight columns; thus, all physical and chemical gradients are integrated.
4. NON-LTE EXCITATION ANALYSIS
In order to investigate the physical origin of the HCN enhancement, we ran non-LTE radiative transfer models with the RADEX code (van der Tak et al. 2007). RADEX uses an escape probability approximation to treat optical depth effects and solves statistical equilibrium in a homogeneous (i.e., single temperature and density), one-phase medium. Therefore, all HCN(4–3), HCO+(4–3), and CS(7–6) lines are emitted from the same volume in our models. This assumption would not be very crude considering the relatively narrow range of the  (Table 2) and similar velocity profiles of these lines (e.g., Zhang et al. 2014). As for the cloud geometry, we assumed a spherical one. Other relevant excitation parameters of the target lines are summarized in Table 2. We hereafter express line strengths in the brightness temperature scale. Note that we do not intend to mimic the environment of a specific galaxy here. Moreover, one line ratio can be reproduced by various combinations of parameters. Hence, the model described below is the result of an educated guess of the parameters, which should be further investigated with future observations.
Table 2. The Excitation Parameters of HCN(4–3), HCO+(4–3), and CS(7–6) Line Emissions
| Line Namea | νrest (GHz)b | μ (Debye)c | Eu/kB (K)d |
 (K)e (K)e
|
Aul (s−1)f |
 (cm−3)g (cm−3)g
|
||
|---|---|---|---|---|---|---|---|---|
| Tkin = 50 K | Tkin = 100 K | Tkin = 200 K | ||||||
| HCN(J = 4–3) | 354.505 | 2.99 | 42.5 | 17.0 | 2.054 × 10⁻³ | 1.4 × 10⁷ | 9.1 × 10⁶ | 6.1 × 10⁶ |
| HCO+(J = 4–3) | 356.734 | 3.93 | 42.8 | 17.1 | 3.627 × 10⁻³ | 2.6 × 10⁶ | 2.0 × 10⁶ | 1.6 × 10⁶ |
| CS(J = 7–6) | 342.883 | 1.96 | 65.8 | 16.4 | 8.395 × 10⁻⁴ | 3.4 × 10⁶ | 2.6 × 10⁶ | 2.2 × 10⁶ |
Notes.
aFull name of the line. b, c, d, e, fThe rest frequency, dipole moment, upper level energy, energy gap between the upper and lower levels, and Einstein A-coefficient of the transition, respectively. These values are extracted from the Leiden Atomic and Molecular Database (LAMDA; Schöieret al. 2005). gCritical density of the line in the optically thin limit without any background radiation, which is calculated for a kinetic temperature (Tkin) of 50, 100, and 200 K, using = Ajk/[
 +
+  (gi/gj) γij exp (−(Ei–Ej)/Tkin)] for the
  transition. Here γjk indicates the collision rate of the
  transition. We adopt only H2 for the collision partner and include collisional de-excitation as well from Jupper up to 25. Values for the collision rate γul are also extracted from LAMDA.
Download table as: ASCIITypeset image
4.1. Model Description
In our RADEX simulation, we investigated how the following parameters affect the line ratios of our interest.
- 1.Kinetic temperature (Tkin) of the molecular gas: this affects the rate of the collisional excitation with the target molecules. The cases of 50, 100, and 200 K are investigated. This range mostly covers the Tkin suggested for nearby AGNs and SB galaxies (e.g., Mauersberger et al. 2003; Krips et al. 2008; Davies et al. 2012; Viti et al. 2014).
- 2.Molecular gas density (
 ): this also affects the rate of collisional excitation. Two cases of = 105 and 5 × 106 cm−3 will be examined. These values are typical ones suggested in nuclear regions of galaxies (e.g., I13; Viti et al. 2014), which is also supported by the commonly subthermal excitation of our target lines (e.g., I13; Knudsen et al. 2007; Viti et al. 2014).
 - 3.Ratios of molecular fractional abundances with respect to H2 (Xmol, mol = HCN, HCO+, and CS): we will show two cases for simplicity, where (or ) = 1 and 10.
- 4.Background radiation temperature (Tbg): molecular rotational levels can be radiatively excited through absorbing photons. In this perspective, it is highly likely that the background radiation is stronger around AGNs than in SB environments. In fact, the dust temperature at far-IR to submillimeter (i.e., Rayleigh–Jeans regime) is as high as 46 K in the central ∼400 pc region of NGC 1068 (AGN; García-Burillo et al. 2014), but 29 K in the central 1.2 kpc region of NGC 253 (SB; Weiß et al. 2008), for example. The cases of 2.73 (cosmic microwave background), 5, 10, 20, 30, 40, 50, and 60 K are studied. We simply adopt the blackbody approximation to calculate the background radiation field.
- 5.Optical depth of the line emission (τ): models with different Nmol/dV (or equivalently a volume density of the target molecule to a velocity gradient ratio) are employed to test this effect. Here Nmol and dV are the line-of-sight column density and line velocity width, respectively./dV (or NCS/dV) = 5.0 × 10¹², 5.0 × 10¹³, 5.0 × 10¹⁴, and 5.0 × 1015 cm−2 (km s−1)−1 are studied. The NHCN/dV is equated to the above /dV (or NCS/dV), or enhanced by 10 times, since XHCN/ (or XHCN/XCS) = 1 and 10 as already mentioned.


Under these conditions, we ran RADEX for each set of (Tkin,  , XHCN/
 , Tbg,
  /dV) or (Tkin,
  , XHCN/XCS, Tbg, NCS/dV) and took line ratios of
  and
and  . Transitions between vibrational levels through IR pumping are not included in the models since there is no detection of vibrationally excited HCN emission in our sample galaxies except for NGC 4418 (Sakamoto et al. 2010), although it can be a bit of an inappropriate treatment in some cases (Section 5). Regarding the gas density, we here mention that Krips et al. (2008) suggested lower
  in AGNs than in SB galaxies, but their measurements were based on single-dish observations of, e.g., the HCN(3–2)-to-HCN(1–0) line ratio. On the other hand, we need spatially resolved measurements of line ratios to accurately assess
  or line excitation (Viti et al. 2014). One may expect that an increase in
  naturally leads to higher line ratios since ncr of HCN(4–3) is the highest among the target lines. However, this is actually not so straightforward, as shown later.
In the modeling below, we first fix  to be 105 cm−3 and investigate the dependence of the line ratios on the other parameters. The case of
  = 5 × 106 cm−3 will be shown subsequently. Note that our modeling is fundamentally different from the LTE modelings by, e.g., I13, Viti et al. (2014), and Martín et al. (2015), in the sense that non-LTE processes are treated here. Moreover, we also examine the dependence of the line ratios on Tbg, which has not been studied in the non-LTE modelings by, e.g., Krips et al. (2011) and Viti et al. (2014). Hence, in addition to the previous key works, we expect that our analysis will provide some insight on the underlying physical and chemical conditions in the centers of galaxies.
4.2. Molecular Line Excitation with Photon Trapping
Excitation states of the target lines under the fixed gas density of  = 105 cm−3 are described here. HCN(4–3) is mainly used as a representative case, but the same argument can hold for HCO+(4–3) and CS(7–6) as well. Figure 3 shows excitation temperature (Tex) of HCN(4–3) as a function of Tbg. When the line emission is optically thin or moderately thick (panels (a) and (b) in Figure 3), one can find that the excitation is dominated by radiative processes, since Tex is very close to Tbg especially at Tbg ≳ 10 K. Note that
  of HCN(4–3) is 17.0 K (Table 2). The excitation states of HCO+(4–3) and CS(7–6) are presented in Appendix

Figure 3. Excitation temperature (Tex) of HCN(4–3) as a function of background temperature (Tbg). The red, orange, and blue symbols indicate the models with gas kinetic temperature (Tkin) of 200, 100, and 50 K, respectively. We here fixed gas volume density as  = 105 cm−3. Four cases of the ratio of line-of-sight column density to velocity width (NHCN/dV) of (a) 5 × 10¹², (b) 5 × 10¹³, (c) 5 × 10¹⁴, and (d) 5 × 1015 cm−2 (km s−1)−1 are shown here. Note that the scale of the y-axis in panel (d) is different from the others. The dashed line in each panel indicates Tex = Tbg. One can find that Tex approaches Tbg when Tbg ≳ 10 K in panels (a) and (b). In panel (d), optical depth is so large (see also Figure 4) that we can expect Tex to become independent of Tbg and to approach Tkin owing to an enhanced photon trapping effect. Note that the HCN(5–4) (not J = 4–3) line shows a maser feature (Tex < 0) at Tbg = 2.73 K in panel (d), and HCN(4–3) is also a maser at Tbg = 5 K in the same panel, when Tkin = 200 K. These two extreme cases are excluded from the plot.
Download figure:
Standard image High-resolution image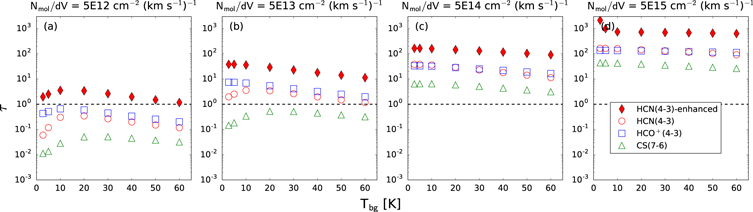
Figure 4. Line optical depths of HCN(4–3), HCO+(4–3), and CS(7–6), as a function of Tbg calculated with RADEX. The H2 gas density and the kinetic temperature were fixed to  = 105 cm−3 and Tkin = 100 K, respectively. The cases where the ratio of molecular column density to velocity width (Nmol/dV, mol = HCN, HCO+, and CS) is (a) 5.0 × 10¹², (b) 5.0 × 10¹³, (c) 5.0 × 10¹⁴, and (d) 5.0 × 1015 cm−2 (km s−1)−1 are presented. In each panel, we also show the optical depth of HCN(4–3) calculated after enhancing the abundance of HCN by 10 times (filled diamonds) for easier comparison with the subsequent figures. The dashed line indicates τ = 1.0 to guide the eye.
Download figure:
Standard image High-resolution imageThe excitation state shown in Figure 3 can be better understood through a two-level (e.g., HCN J = 3 and 4) analytic treatment. Although we conducted a full-level statistical equilibrium calculation with RADEX here, this analytic treatment provides us fruitful insights on what is influencing the molecular excitation. A similar approach can be found in, e.g., Scoville et al. (2015) and Scoville & Solomon (1974), but we include background radiation in the analysis as well, which has usually been omitted.
The ratio of the upper- to lower-level molecular population with the energy gap of  can be written as
with
Here Aul, Bul, and Cul indicate the Einstein coefficients of spontaneous decay, stimulated emission, and collisional de-excitation, respectively. The upward and downward collision rates are related assuming a detailed balance in the thermodynamic equilibrium state. The gu and gl are statistical weights of the upper and lower levels, respectively. The frequency of the line is represented as ν. The internal radiation Jν is

where  is the Planck function at temperature T. Although we should include various mechanisms as the source of the background radiation and solve their radiative transfer individually to achieve the local spectral energy distribution, we represent them by a single Planck function throughout this paper for simplicity. The photon escape probability from the model cloud is denoted as βν, which is a function of the line optical depth τ as
for a spherical cloud (e.g., Osterbrock & Ferland 2006). The value of βν also depends on the assumed geometry. In Equation (1), Aul is reduced by βν, which means that an effective ncr of the line ( ) is lower than the ncr at the optically thin limit (
 Table 2) owing to the photon trapping effect, i.e.,
  =
=  . The background radiation field is included in Equation (1) as η. We show the η of HCN(4–3) in Figure 5, which is almost identical to those of HCO+(4–3) and CS(7–6).

Figure 5. Dependence of  1/(exp(
 /Tbg)-1) of HCN(4–3) on Tbg. The value of η is almost identical among HCN(4–3), HCO+(4–3), and CS(7–6), reflecting their similar energy gaps between the upper and the lower levels (Table 2).
Download figure:
Standard image High-resolution imageBy introducing  , Equation (1) is reduced to
Here exp(− ) commonly takes ∼1 for HCN(4–3), HCO+(4–3), and CS(7–6) at any Tkin in our models. With this formula, the molecular excitation in the two extreme cases of βν, i.e.,
  (optically thin limit) and
  (optically thick limit), is discussed in the following.
(i) Optically thin limit—in this limit, we expect  =
=  10−2 for HCN(4–3), for example (Table 2). Taking Figure 5 into account as well, one can find that both collisional and radiative excitation can contribute to the molecular excitation, especially when Tbg ≲ 5 K. In this range,
  . On the other hand, the right-hand side of Equation (5) reduces to
  , i.e., molecules are radiatively excited. This trend stands out especially when Tbg ≳ 10 K, which can be clearly seen in Figure 3(a). Therefore, as a general manner, we suggest that radiative excitation should be considered seriously when we treat optically thin to moderately thick line emissions from AGNs, where high Tbg is likely expectable.
(ii) Optically thick limit—in this limit, by substituting  0 (or
0 (or  0) into Equation (5), one can find that Tex is now identical to Tkin and thus independent of Tbg. Indeed, Tex is less dependent on Tbg and also differs a lot according to Tkin (panels (c) and (d) in Figure 3), as HCN(4–3) becomes optically thicker (see also Figure 4). We note that the output parameters have a limited meaning at a high optical depth such as τ ≳ 100 in the RADEX code, since the change of optical depth over the line profile is not taken into account (van der Tak et al. 2007).
4.3. The and under Non-LTE


We then calculated  and
and  based on our non-LTE modelings as a function of Tbg. Several cases with different Tkin, Nmol/dV (or τ), and molecular abundance ratios are shown in Figure 6. Here we discuss a dependence of each line ratio on the parameters in our models. We guide readers to Martín et al. (2015) for these line ratios calculated under the LTE condition.

Figure 6.  (top panels) and
  (bottom panels) as a function of Tbg, calculated by our RADEX models. The ratio of line-of-sight molecular column density to velocity width (Nmol/dV) varies from 5 × 10¹² to 5 × 1015 cm−2 (km s−1)−1 for the cases of mol = HCO+ and CS, respectively. As a result, panels (a) and (e) display the case where each emission is optically thin, whereas panels (d) and (h) show heavily optically thick cases. The opacities of these lines are shown in Figure 4 for the case of Tkin = 100 K. The filled and open symbols indicate
  (or
(or  ) = 10 or 1, respectively. The colors indicate the gas kinetic temperature (Tkin) as blue = 50 K, orange = 100 K, and red = 200 K.
Download figure:
Standard image High-resolution image(i)  —one will find in Figures 6(a)–(d) that this ratio is not so sensitive to Tbg, which is close to Tex when the excitation is dominated by the radiative processes (see also Figure 3). To further examine this trend, we rewrite
  analytically as
where  and
and  correspond to the former and the latter term of the left-hand side of Equation (6), respectively. Also, we rewrite the optical depth as
where Nl is the line-of-sight column density at the lower energy level. The resultant  and
and  are plotted in Figure 7(a) for the representative case of
  = 5 × 1013 cm−2 (km s−1)−1. At this
  with
with  = 1, HCN(4–3) and HCO+(4–3) are moderately optically thick, whereas HCN(4–3) can be heavily optically thick when
  =10 (see also Figure 4). From Figure 7(a), one may find that
  and
and  vary toward the opposite direction at
  10 K (the range where both collisional and radiative processes can influence the excitation), which compensates with each other to keep the
  more or less constant. At Tbg ≳ 10 K where Tex ∼ Tbg, on the other hand, both
  and
and  themselves are not so sensitive to Tbg anymore. Note that we can expect
  1 when both lines are thermalized and at the optically thick limit.
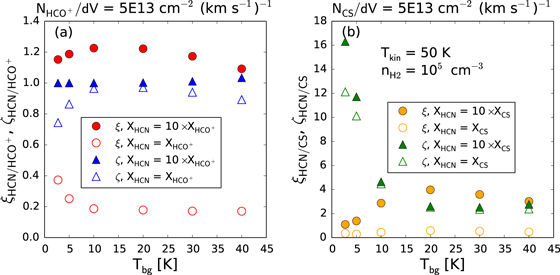
Figure 7. Dependence of (a)  and
and  and (b)
  and
and  on Tbg. For the definition of ξ and ζ, see Equations (6) and (9) in the text. The cases of (Tkin,
  ) = (50 K, 105 cm−3) with Nmol/dV = 5 × 1013 cm−2 (km s−1)−1 are shown (mol = HCO+ or CS) as the representative ones. The colors indicate (a) red =
  , blue =
  , and (b) orange =
  , green =
  , respectively. The filled and open symbols denote
  (or
(or  ) = 10 and 1, respectively.
Download figure:
Standard image High-resolution imageAs for the dependence on Tkin, one can see that  increases as Tkin gets higher in each panel, reflecting the higher ncr of HCN(4–3) than HCO+(4–3), except for the case of XHCN =
  in Figure 6(d). In that exceptional case, where both lines are quite optically thick, HCO+(4–3) is fully thermalized because of the well-reduced
  (
( = 105 cm−3) due to the photon trapping (see also Appendix
  of HCN(4–3) is maximized at Tkin = 50 K.
Regarding the molecular abundance ratio, we find that  10 is necessary to reproduce
  1 observed in AGNs in any Tkin and Nmol/dV studied here. Enhancing XHCN (equivalently enhancing NHCN in our models) will increase
  and Tex (photon trapping), both of which will result in subsequent enhancement of the
  . The required
  is consistent with our previous multi-transitional non-LTE modeling of HCN and HCO+ in NGC 1097 (I13). We should also mention that Yamada et al. (2007) concluded, based on their three-dimensional radiative transfer simulations, that XHCN must be an order of magnitude higher than
  in order to account for the observed high HCN(1–0)/HCO+(1–0) ratios in AGNs (e.g., ∼2 in NGC 1068; Kohno et al. 2008). Our results seem to be consistent with their modelings, although we here use J = 4–3 transitions. Moreover and importantly, the
  required for AGNs (≳10) are significantly higher than that required to reproduce the
  in SB galaxies, which is typically
  3. Therefore, the boosting factor of the abundance ratio in AGNs over that in SB galaxies is at least ∼3. This factor can even increase to ≳10 (i.e.,
  30) to account for the high-end values observed in AGNs (e.g., NGC 1068 (W-knot) in Table 1) based on our modelings. For a convenient discussion, we here define the boosting factor as

where (XHCN/ )AGN and (XHCN/
 )SB denote the molecular fractional abundance ratios in AGN and SB galaxies, respectively. The same notation is also used for the case of XHCN/XCS. Note that, for an extreme case like NGC 1068 (W-knot), we require
  /dV ≲ 5 × 1013 cm−2 (km s−1)−1 because
  will eventually converge to unity for larger optical depths and never reaches such high observed values as ∼3.
(ii)  —contrary to
  ,
,  shows a steep dive in Figures 6(e) and (f) as Tbg increases from 2.73 to 10 K, when
  = 10. This feature is more prominent at lower Tkin. All other cases show almost constant
  against Tbg. Following the same manner in Equation (6), we express the
  as
as
The resultant  and
and  are plotted in Figure 7(b) for the case of NCS/dV = 5 × 1013 cm−2 (km s−1)−1 as a representative example.
In Figure 7(b), a rapid drop in  (by a factor of ∼5 when
  = 10) stands out, which damps the variation of
  . We can attribute this dive to the quite different τ between HCN(4–3) and CS(7–6);
  = 19.5–41.8, whereas
  = 0.06–0.45 for the case of Figure 7(b). In this case,
  mostly reflects the variation of
  since
since  is now
  . Then, considering the τ of HCN(4–3) and CS(7–6) shown in Figure 4, we can deduce that the condition of "HCN(4–3) is optically thick, whereas CS(7–6) is optically thin" would be the key to realize the high
  10 observed in some AGNs. This scenario can explain the dependence of
  on Tkin, as we can expect larger
  (higher
  ) at higher Tkin, while
  is already substantially large regardless of any Tkin in our models. Note that
  naturally converges to ∼1 as both HCN(4–3) and CS(7–6) reach the optically thick limit and are fully thermalized.
Then, we suggest that  5 × 1013 cm−2 (km s−1)−1 and
  10 would be necessary conditions to reproduce the observed high
  in AGNs. These conditions become tighter ones if AGNs have
  20 K and
  100 K (Figure 6). The former assumption can be justified by the high dust temperature in NGC 1068 (46 K; García-Burillo et al. 2014). As for the latter one, it has been suggested that Tkin in AGN environments is as high as several hundred kelvin even in a molecular phase (e.g., I13; Matsushita et al. 1998; Krips et al. 2008; Davies et al. 2012; Viti et al. 2014); thus, it is highly likely to be satisfied. The required
  for AGNs (≳10) is again significantly higher than that for SB galaxies (∼3). Hence, the estimated
  is at least ∼3. This
  can increase to ∼10 (i.e., XHCN/XCS ∼ 30 in AGNs) to reproduce the high-end values of
  12 (Figure 1) under the conditions of moderately high dust temperature of ≳10 K and high Tkin such as 200 K. These boosting factors are roughly consistent with
  .
.
4.4. Dependence of the Line Ratios on Gas Density
Recently, Viti et al. (2014) reported that  would vary even inside a single CND around an AGN. Therefore, the impact of different densities on the line ratios of our interest should be investigated as a subsequent analysis to Sections 4.2–4.3. To this end, we conducted the same analysis as shown in the previous parts but for the case of
  = 5 × 106 cm−3. This density roughly corresponds to the highest one predicted by Viti et al. (2014) in the CND of NGC 1068. The resultant (model-predicted) line ratios and optical depths are presented in Figures 8 and 9, respectively.
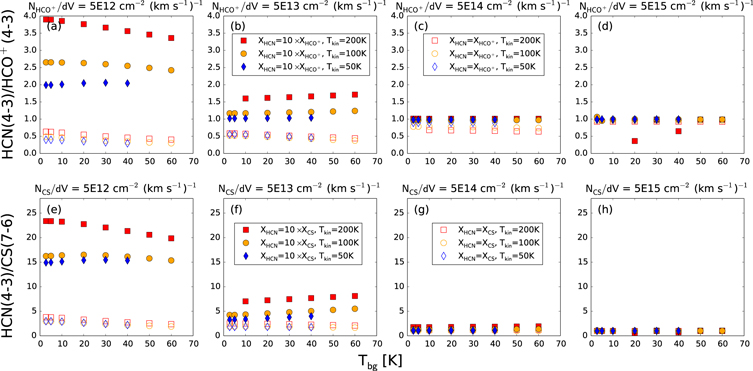
Figure 8. Same as Figure 6, but the models with  = 5 × 106 cm−3 are shown.
Download figure:
Standard image High-resolution imageFrom that figure, we found that both  and
and  tend to show higher values than those in Figure 6 when Nmol/
 5 × 1013 cm−2 (km s−1)−1 (mol = HCO+ and CS), i.e., cases when emission lines are optically thin or moderately thick. Especially,
  in Figure 8(a) exceeds 2.5 at
  100 K and XHCN/
 = 10, which is comparable to the observed high-end ratios in Table 1. The higher values than the former cases with
  = 105 cm−3 directly reflect the highest ncr of HCN(4–3) among the lines used here. However, when Nmol/dV is increased, one can also see that the line ratios converge to unity more quickly than for the cases in Figure 6. Enhanced excitation due to the higher
  makes each emission line thermalized and optically thick, leading to this convergence. This is also manifested in the trend that both line ratios are less dependent on Tbg, but more sensitive to Tkin than the cases in Figure 6, which is especially prominent in
  (this ratio is sensitive to the optical depth; Section 4.3). Therefore, although it depends on the line opacity, higher
  does not necessarily correspond to higher
  or
or  .
.
Then, let us speculate more in detail about three cases of gas densities in the following: (i)  , (ii)
  , and (iii) nAGN > nSB. Here nAGN and nSB denote representative gas densities in AGN and SB environments, respectively. We focus on two cases of
  as shown in Figures 6 (105 cm−3) and 8 (5 × 106 cm−3), and we also use only
  during this speculation, for simplicity. Then, the higher density between nAGN and nSB corresponds to 5 × 106 cm−3, whereas the lower one is 105 cm−3 hereafter. Following the same manner, an essentially similar argument for abundance ratios can be achieved for the case of XHCN/XCS as well. Note that, however, we can only argue for the rough trend of relative difference in the abundance ratio between AGNs and SB galaxies in the following, because of this simple treatment. More comprehensive and quantitative comparison requires high-resolution, multi-line, and multi-species analysis to restrict the gas excitation. Such an analysis should be conducted with future observations.
(i) nAGN = nSB: in the case of  = 105 cm−3 (Figure 6), XHCN/
 is ∼a few for SB galaxies (Section 4.3). Then, we request that the boosting factor
  be at least ∼3 to explain the observed
  in AGNs. Regarding a high-end value such as
  3 (e.g., NGC 1068 (W-knot)),
  even reaches ≳10 (i.e., XHCN/
 30). When
  is increased to 5 × 106 cm−3 (Figure 8), XHCN/
 = 1 is sufficient to reproduce the
  in SB galaxies (Figure 8). On the other hand, we still need
  to be a few to even ∼10 (depending on the line opacity) in order to account for the
  in AGNs, especially the high-end values. In either case, we require the enhanced HCN abundance in AGNs to reproduce the observations.
(ii) nAGN < nSB: as shown above, XHCN/ 1 is sufficient to reproduce the observed
  in SB galaxies when
  = 5 × 106 cm−3 (Figure 8). However, we need to enhance the XHCN/
 up to ∼10 (≳30 for the case of the high-end value) to explain the
  in AGNs when
  = 105 cm−3. Hence, again it indicates substantially high XHCN/
 in AGNs with
  as high as ≳10–30.
(iii) nAGN > nSB: in the case of  = 105 cm−3, XHCN/
 3 is sufficient to reproduce the observed
  in SB galaxies (Figure 6). For AGNs having higher gas density of
  = 5 × 106 cm−3 (Figure 8), we have to restrict ourselves to
  /dV ≲ 5 × 1013 cm−2 (km s−1)−1 at first because
  converges to unity for higher column density (or τ) and thus never reaches ≳2. Under these conditions, we found that XHCN/
 3–5 can indeed yield a high
  of ∼1.5–2.5 especially when
  /dV ∼ 5 × 1012 cm−2 (km s−1)−1 and Tkin ≳ 100 K (Figure 8(a)). In this case,
  is only ∼1–1.5, i.e., no abundance variation between AGNs and SB galaxies. Note that, even with this high
  , it is still a bit challenging to reproduce the observed highest
  of ≳3. To do so, we might need to require
  to be ∼a few even with the high
  in AGNs. On the other hand, when
  /dV ∼ 5 × 1013 cm−2(km s−1)−1, we cannot avoid increasing
  a few to yield the high-end
  in AGNs (Figure 8(b)).
As a summary of our non-LTE modelings with both  =105 cm−3 and 5 × 106 cm−3, we suggest that
  would be enhanced in AGNs as compared to SB galaxies by several times to ≳10 times when
  in AGNs are comparable to or lower than those in SB galaxies in order to reproduce their observed
  . Another plausible origin might be the systematically higher gas density in AGNs than in SB galaxies, which should be coupled to the low opacity of the emission lines from AGNs, to yield the high
  . In this case, an almost comparable
  is expected between AGNs and SB galaxies. However, the feasibility of such a systematic difference in gas density is unclear at this moment. Although Viti et al. (2014) suggested such differences between the kiloparsec-scale SB ring and the 100 pc scale CND of NGC 1068, what we are treating here is the rather smaller, circumnuclear-scale (likely to be ≲100 pc scale) components located at the centers of both AGN and SB galaxies; recall that we made Figure 1 only based on the high-resolution sample in Table 1. Hence, the contrast in density between AGN and circumnuclear SB environments would be smaller than in the case between AGN and kiloparsec-scale SB environments. Moreover, ∼30 pc scale measurements of HCN(4–3) and HCN(1–0) revealed that the HCN(4–3)/HCN(1–0) integrated intensity ratio is ∼0.7–1.0 in the central region of NGC 253 (the brightness temperature scale; Sakamoto et al. 2011; Meier et al. 2015), which is comparable to the values obtained within the CND of NGC 1068 (Viti et al. 2014). Knudsen et al. (2007) also proposed that the line excitation is independent of galaxy types, although this argument was based on single-dish measurements of the HCN spectral energy distribution. These results suggest that the degree of line excitation at the nuclear region of a galaxy would not depend on the specific type of that galaxy. Likely higher Tkin in AGNs would lead to lower
  than SB galaxies if they share the same line excitation. Therefore, we hereafter prefer the scenario of the variation of underlying molecular abundances between AGNs and SB galaxies as the prime cause of the HCN enhancement. However, we should mention that we cannot discard the possibility of systematically higher
  in AGNs than in SB galaxies, nor the possibility that the CND of NGC 1068 has specifically and remarkably high
  as compared to other AGNs and SB galaxies, because of the simplified analysis and discussion in this work.
4.5. Comparison with Real Galaxies: Case Study of NGC 1097, NGC 1068, and NGC 4418
In this section, we briefly compare our model calculations with the observed  and/or
  of two instructive AGNs and one buried AGN, namely, NGC 1097, NGC 1068, and NGC 4418. The characteristics of these galaxies are presented in Appendix
  = 105 cm−3 (Figure 6) are employed here, but those with
  = 5 × 106 cm−3 yield essentially the same (qualitative) arguments. As these models were not constructed to mimic the environment of a specific galaxy, our immediate objective here is to roughly check the consistency of the trend between the model-predicted line ratios and the actual observed values.
For NGC 1097 (AGN), Hsieh et al. (2008) estimated  = 5.9 × 1022 cm−2 from CO interferometric observations. Assuming XCS = 2.5 × 10⁻⁹ (the value of the OMC-1 Extended Ridge, where
  = 3 × 1023 cm−2; Blake et al. 1987) and a line width of 250 km s−1 (FWZI of HCN(4–3); I13),
  is estimated to be ∼6 × 1011 cm−2 (km s−1)−1. Then, judging from Figure 4, we can expect that CS(7–6) emission is totally optically thin (
 0.1). This is consistent with the nondetection of CS(7–6) emission in our previous observations with ALMA (I13). Even if we increase XCS by 10 times, the situation is the same. On the other hand, non-LTE analysis by I13 suggested that
  in NGC 1097 is ∼a few × 1013 cm−2 (km s−1)−1; thus, HCN(4–3) would be moderately optically thick (Figure 4). The resultant XHCN in this case is ∼10−7, which is close to the value observed in Galactic hot cores and is significantly higher than that observed in, e.g., the OMC-1 Extended Ridge (5.0 × 10⁻⁹; Blake et al. 1987). Therefore, the situation is similar to panel (e) of Figure 6 with a high
  of ≳10. Indeed, our model using the above values shows
  20, which matches the observed value (
 12.7). Furthermore, an optical depth of HCN(1–0) estimated from the above number is
  0.1 (Tkin = 100 K is assumed), which is consistent with the estimation by Martín et al. (2015).
However, our estimated abundance ratios such as XHCN/ 10 are significantly higher than those obtained by Martín et al. (2015) through LTE analysis, which are ∼3. As long as we adopt a gas density that is not high enough to thermalize all of the HCN(4–3), HCO+(4–3), and CS(7–6) emission lines (e.g.,
  = 105 cm−3 in Figure 6), we should require highly enhanced abundance ratios to overcome the inefficient excitation of the HCN(4–3) line (this line has the highest ncr among the target lines; Table 2) and yield the high line ratios observed. In the case of higher
  such as 5 × 106 cm−3, the required abundance ratio can be as low as ∼3 for optically thin emission lines (Figures 8(a), (e)). This ratio is consistent with the measured values by Martín et al. (2015), because now the conditions of (i) LTE and (ii) optically thin emission are mostly satisfied. For optically thicker cases, we will again see a discrepancy between our model predictions and those by Martín et al. (2015). Therefore, whether our model predictions are consistent or not with the previous LTE results strongly depends on the assumed
  and line optical depth.
In the case of NGC 1068, both the ratios of  and
and  at the precise AGN position are lower than those of NGC 1097 (AGN). We suppose that this is likely due to a larger Nmol than that of NGC 1097 (AGN), i.e., the lines are optically thicker than those of NGC 1097 (AGN). Actually, the
  toward this AGN can be ∼6 × 1023 cm−2 by using the results of the CO multi-line non-LTE analysis by Viti et al. (2014) (see also the footnote in Section 2 for the estimation), which is ∼10 times larger than that of NGC 1097 (AGN). In this case, again by applying XCS = 2.5 × 10⁻⁹ (Blake et al. 1987) and dV ∼ 200 km s−1 (García-Burillo et al. 2014), we estimate NCS/dV ∼ 1 × 1013 cm−2 (km s−1)−1. For this NCS/dV, CS(7–6) emission is still moderately optically thin (τCS ∼ 0.1; Figure 4), but is significantly optically thicker than the case of NGC 1097 (AGN). The same speculation can also be applied to HCN(4–3) and HCO+(4–3) emission lines. As shown in Figure 6, it is natural for line ratios to converge to unity when the paired lines get optically thicker. Moreover, since
  is sensitive to Tbg, we can expect a lower value of this ratio in NGC 1068 (AGN) than in NGC 1097 (AGN) even when they share the same XHCN/XCS considering the much higher AGN luminosity of the former than the latter (Marinucci et al. 2012; Liu et al. 2014). Therefore, despite the rather lower
  and
and  than in NGC 1097 (AGN), we still expect that the underlying
  and
and  are high (∼10) in NGC 1068 (AGN). Note that the line optical depths of HCN(4–3) are 40–60 even when NHCN/dV = 1 × 1015 cm−2 (km s−1)−1, which are still smaller than that observed in Arp 220W (a system of self-absorption; Scoville et al. 2015).
As for the knots of the CND of NGC 1068, panels (a), (b), (e), and (f) of Figure 6 would be good approximations for their situations if we adopt the estimated column densities by Viti et al. (2014). In those cases with Tkin > 100 K, we need the abundance ratios to be ≳30 when  = 105 cm−3. As stated before, we cannot discard the possibility of no abundance enhancement in the case of panels (a) and (e) in Figure 8. However, if Nmol/dV ≳ 5 × 1013 cm−2 (km s−1)−1 is true, we still need to enhance the abundance ratios to be ≳30 even with
  = 5 × 106 cm−3 to reproduce the high-end values observed in these knots (e.g.,
  3). Note that we can find consistent abundance ratios with those suggested above in previous works of multi-line, multi-species non-LTE analysis (e.g., Table 8 of Viti et al. 2014). On the other hand, there seems to be an inconsistency with the predicted abundance ratios from LTE analysis (Table 5 of Viti et al. 2014), which are ∼5 for both XHCN/
 and XHCN/XCS. For
  of 105 cm−3 (Figure 6), again we should enhance XHCN to overcome the inefficient excitation of HCN(4–3). For the higher
  of 5 × 106 cm−3 (Figure 8), our results are consistent with those from the LTE analysis as long as emission lines are optically thin or moderately thick (see also Figure 9), but the discrepancy becomes prominent for optically thicker cases because now the condition of optically thin emission assumed in the LTE analysis (Viti et al. 2014) breaks. In such cases, we eventually require enhanced XHCN/
 of, e.g., <30, as already mentioned, e.g., XHCN/
 of ≳ 30 as already addressed.
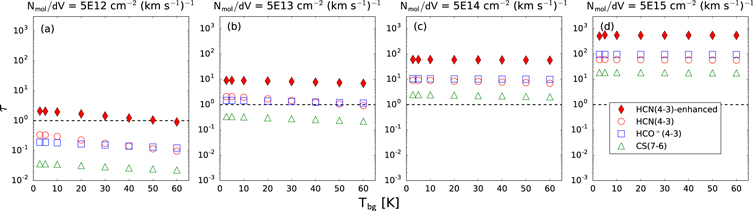
Figure 9. Same as Figure 4, but the models with  = 5 × 106 cm−3 are shown. The dashed line indicates τ = 1.0 to guide the eye.
Download figure:
Standard image High-resolution imageIn the case of NGC 4418, the same argument of the optical depth effect as for NGC 1068 (AGN) holds with a stronger basis, because this galaxy hosts a heavily obscured compact nucleus ( 1026 cm−2; Sakamoto et al. 2013). The distinctively lower
  than normal AGNs favors this view as this ratio is highly sensitive to the optical depth of the CS(7–6) emission line (Figure 7). Regarding
  , we mention that this ratio is slightly increased to ∼2 when observed at 05–80'' pc resolution (Sakamoto et al. 2013), which is a comparable value to other AGNs. However, whether an enhanced XHCN/
 such as 10 is really necessary to account for this relatively high ratio is unclear, because this galaxy exhibits a prominent v = 1 state HCN emission line (IR pumping; Sakamoto et al. 2010). Radiative transfer modelings involving the IR pumping are thus inevitable to elucidate the validity of our diagram in such a deeply embedded nucleus that the IR pumping must affect the ratio.
4.6. Implication for Generic HCN Diagrams
As the last of Section 4, we here predict HCN-to-HCO+ and HCN-to-CS integrated intensity ratios at other transitions based on our RADEX modelings, by varying  and
and  . Illustrative cases are shown in Figure 10 as a function of the upper rotational state (Ju) of HCN. As for CS, we coupled a transition with the closest frequency to each HCN transition (e.g., HCN(1–0) and CS(2–1), HCN(4–3) and CS(7–6)). We hereafter call this type of diagram a spectral ratio distribution (SRD). Note that we do not intend to predict the line ratio of a specific galaxy in Figure 10, but to understand a qualitative feature of these ratios at various transitions.

Figure 10. Example of the spectral ratio distribution of (a) HCN to HCO+ and (b) HCN to CS integrated intensity ratios in the brightness temperature scale, as a function of the upper rotational state Ju of HCN. The value of each ratio is calculated based on our RADEX simulation, assuming  = 105 cm−3,
  = 100 K, and Tbg = 10 K. The case of
  (or NCS/dV) = 5 × 1013 cm−2 (km s−1)−1 is shown. We set molecular abundance ratios to be
  (or
(or  ) = 20 (red square), 10 (orange diamond), 3 (green circle), and 1 (blue triangle), respectively. As for CS, the transition with the closest frequency to each HCN(Ju–Jl) is used. At any transition, enhanced
  correspondingly produces higher line ratios (i.e., blue < green < orange < red).
Download figure:
Standard image High-resolution imageBy inspecting the SRD, one can see that enhanced  (or
(or  ) correspondingly produces higher line ratios at any transition. Therefore, if XHCN/
 and XHCN/XCS are truly enhanced more in AGNs than in SB galaxies, and if they share the comparable excitation (e.g.,
  and Tkin), we predict that AGNs would show higher line ratios not only at a single transition but also at other transitions than SB galaxies. Indeed, NGC 1097 and NGC 1068 show higher HCN(1–0)/HCO+(1–0) and HCN(1–0)/CS(2–1) ratios than SB galaxies (e.g., Kohno et al. 2008; Nakajima et al. 2011; Martín et al. 2015).
From this perspective, remarkable inconsistency can stem from NGC 7469, which shows an HCN(1–0)/HCO+(1–0) ratio of ∼0.6 when observed with the Nobeyama Millimeter Array (∼6'' = 2 kpc aperture; Kohno 2005), whereas it shows HCN(4–3)/HCO+(4–3) = 1.1 (∼150 pc aperture; Table 1). This inconsistency can be reconciled when we measure J = 1–0 lines at a higher resolution to selectively probe the CND of NGC 7469 as much as possible, because this galaxy hosts a prominent SB ring with ∼1 kpc in diameter that can be a strong source of spectral contamination; the HCN(4–3)/HCO+(4–3) ratio at the SB ring is as low as ∼0.5. In fact, ∼150 pc aperture measurements of J = 1–0 transitions newly obtained with ALMA reveal HCN(1–0)/HCO+(1–0) > 1 at the AGN position (T. Izumi et al. 2016, in preparation). This improved spatial resolution is still larger than but closer to the expected size of the XDR in NGC 7469 (∼80 pc in diameter; Izumi et al. 2015). With this in mind, we here suppose that the low HCN(1–0)/HCO+(1–0) ratio (<1) observed in NGC 2273 and NGC 4051 (Sani et al. 2012) would be (at least partly) due to severe spectral contamination from the surrounding SB regions. This can be the same situation as we discussed for NGC 1365 and NGC 4945 in Section 3. These low line ratios were measured in the central 3'' regions (Sani et al. 2012), which correspond to 390 pc for NGC 2273 and 150 pc for NGC 4051. Indeed, the equivalent widths of the 11.3 μm PAH emission in NGC 2273 (330 nm with ∼500 pc slit; Alonso-Herrero et al. 2014) and NGC 4051 (95 nm with 25 pc slit; Alonso-Herrero et al. 2016) are significantly larger than those of NGC 7469 or NGC 1068 (Section 3). Moreover, the 2–10 keV X-ray luminosities of NGC 2273 (log ( /erg s−1) = 42.7; Marinucci et al. 2012) and NGC 4051 (log (
 /erg s−1) =41.1; Liu et al. 2014) are ∼3 and ∼130 times smaller than that of NGC 7469 (log (
 /erg s−1) = 43.2; Liu et al. 2014), respectively. Therefore, we can expect that the extent of the hypothesized XDRs is much smaller in NGC 2273 and NGC 4051 than that of NGC 7469 (Izumi et al. 2015) and hence than the above-mentioned 3'' areas where the line ratios were measured. On the other hand, again we cannot discard the possibility that these galaxies have less dense gas than AGNs with high line ratios (see also Section 4.4). Multi-line, multi-species modelings are indeed required to disentangle these scenarios.
5. POSSIBLE CHEMICAL CAUSES FOR THE MOLECULAR ABUNDANCE VARIATION
In this section we present various scenarios for the molecular abundance variation (or HCN enhancement in AGNs) as suggested in Section 4, from the perspective of ISM chemistry. We here focus on the  of AGNs and SB galaxies for simplicity, since this ratio is less sensitive to excitation than
  (Figures 6 and 8). Hence, we discuss possible chemical causes for enhancing XHCN/
 hereafter. Line ratios of buried AGNs are not discussed because they would be (at least partly) affected by IR pumping. However, even focusing on the XHCN/
 only, it is still difficult to tightly constrain the various possibilities owing to an insufficient amount of data. We hope that future high-resolution, multi-line, and multi-species observations will settle the issue.
5.1. XDR, PDR, and High-temperature Chemistry
It has been suggested that the enhanced HCN(1–0) intensity observed in AGNs is due to abnormal chemistry realized in XDRs (e.g., Kohno 2005; Krips et al. 2008). The molecular abundances and the resultant column-integrated line intensities of our target molecules under steady-state gas-phase XDRs and PDRs were extensively modeled by Meijerink & Spaans (2005) and Meijerink et al. (2007). In their XDR models,  can exceed unity only at the surface (NH ≲ 1022.5 cm−2) of low- to moderate-density gas (nH ≲ 105 cm−3), where a high X-ray flux (e.g., FX ≳ 10 erg s−1 cm−2) can be expected. However, for a larger NH where FX is attenuated, they predicted
  1. This is due to the fact that the range of the ionization rate over which
  is high is much wider than that of HCN under X-ray ionization chemistry (Lepp & Dalgarno 1996). Note that one weak point in this model would be that the predicted line intensities are considerably low at the region of NH ≲ 1022.5 cm−2 (Meijerink et al. 2006, 2007), which seems to be inconsistent with the prominent HCN(4–3) and HCO+(4–3) emissions observed in AGNs.
Another possible scenario is a high-temperature chemistry, under which neutral–neutral reactions with high reaction barriers are enhanced in general (e.g., Harada et al. 2010). This kind of chemistry is efficient in, e.g., hot core-like regions and mechanically dominated regions. For example, a formation path of CN +  HCN + H has a barrier of ∼960 K (KIDA).22
This reaction can be efficient at Tkin ≳ 300 K (Harada et al. 2010). Indeed, such a high temperature can likely be expected in AGNs (e.g., Krips et al. 2008; Davies et al. 2012). At that temperature,
HCN + H has a barrier of ∼960 K (KIDA).22
This reaction can be efficient at Tkin ≳ 300 K (Harada et al. 2010). Indeed, such a high temperature can likely be expected in AGNs (e.g., Krips et al. 2008; Davies et al. 2012). At that temperature,  can be somewhat reduced owing to an activated reaction with H2O to form H3O+. What is important is that this chemistry can be complemented to conventional XDR (ionization) models (Harada et al. 2013), where we can expect much higher gas temperature owing to efficient X-ray heating than in SB environments (PDR). Interestingly, recent high-resolution VLA observations revealed a higher fractional abundance of NH3 in the very nuclear region of NGC 3079 (a type 2 AGN; Miyamoto et al. 2015) than in SB galaxies (Takano et al. 2013, and references therein). NH3 is also a typical molecule efficiently formed in high-temperature environments. We should note that evaporation from dust grains can also increase the
  , especially at lower temperature (≲100 K; Rodgers & Charnley 2001), which will enhance the XHCN via subsequent nitrogen reactions. However, at low temperature, ion-neutral reactions are so quick that we can envision, e.g., C+ + H2O
  HCO+ + H, which will efficiently enhance the
  (O-bearing species such as H2O should also be ejected from dust). This would reduce
  , which seems to be inconsistent with the high
  suggested in Section 4; thus, the dust grain reactions will not be very critical.
Keeping these models in mind, we hereafter present a possible interpretation of the  in three instructive AGNs and two SB galaxies, namely, NGC 7469, NGC 1068, NGC 1097, NGC 253, and M82.
(i) NGC 7469—we first discuss the  measured at the AGN position of NGC 7469 (denoted as N7469 (AGN) in Figure 1), which is comparable to those of some SB galaxies such as NGC 253 despite its orders of magnitude higher X-ray luminosity (log
  = 43.2; Liu et al. 2014). No morphological and kinematic signatures of a jet–ISM interaction have been found in the CND of NGC 7469 through the high-resolution observations of H2 and Brγ emission lines (Hicks et al. 2009; Müller-Sánchez et al. 2011), and then mechanical heating might not play an important role in this galaxy, although Lonsdale et al. (2003) found a core jet-like structure at a radio wavelength. Regarding the origin of the relatively low
  , Izumi et al. (2015) pointed out the compactness of the XDR. They estimated the spatial extent of the XDR and the region where FX ≳ 10 erg s−1 cm−2 (Meijerink et al. 2007) to be ∼42 pc and ∼35 pc in radius, respectively. Therefore, not a poor but a still relatively large observing beam employed in the NGC 7469 observations (∼150 pc; Table 1) might have picked up line fluxes emanating from the extended SB region, which would have resulted in reducing the
  of this AGN.
(ii) NGC 1068—the X-ray luminosity of this AGN (log  = 43.0; Marinucci et al. 2012) is quite comparable to that of NGC 7469. The degree of contamination from PDRs and SNe (i.e., stellar feedback) to the observed line ratio is unclear, although we expect that it is relatively low by considering the moderate stellar age inside the CND (200–300 Myr; Davies et al. 2007). This age is much older than those of SB galaxies, e.g., NGC 253 (∼6 Myr; Fernández-Ontiveros et al. 2009) and M82 (∼10 Myr; Förster Schreiber et al. 2003). We found a relatively high
  of ∼1.5 at its precise AGN position (denoted as N1068 (AGN) in Figure 1), which is well consistent with the results in García-Burillo et al. (2014). The ratio was measured with a single synthesized beam of 35 pc. García-Burillo et al. (2014) also reported a correlation between the spatially resolved HCN(4–3)-to-CO(3–2) integrated intensity ratio (
 ) and the 6–8 keV X-ray flux (
 ) across the CND of NGC 1068. The same trend can also be found in HCO+(4–3), SiO(2–1), and CN(2–1) (García-Burillo et al. 2010, 2014), which suggests that the whole CND is a giant XDR. However, again according to Meijerink et al. (2007), to reproduce
  1 at this AGN position is quite difficult since the
  toward the AGN position expected from the results of the CO multi-line non-LTE analysis by Viti et al. (2014) is ∼6 × 1023 cm−2 (see the footnote of Section 2 for the assumptions in this estimation). To interpret the high
  of N1068 (AGN) is thus not straightforward at all. We might have to add some other mechanisms such as high-temperature chemistry (Harada et al. 2010, 2013) to forcibly enhance
  .
.
As for the  measured at other positions, e.g., the east/west knots of the CND of NGC 1068 (namely, N1068 (E-knot) and N1068 (W-knot) in Figure 1), we found that they are 2 times higher than that of N1068 (AGN). This result is a bit surprising since the ratio increases as it recedes from the nucleus (=the X-ray peak). We speculate that the cause of this enhancement at the E/W-knots is likely related to that for the prominent 2.12 μm H2 emission there (e.g., Müller Sánchez et al. 2009). The
  –
– correlation shown above and the very uniform distribution of the H2 λ2.25 μm/λ2.12 μm ratio across the CND (Riffel et al. 2014) seem to support a scenario in which these emissions are primarily due to (nondirectional) X-ray heating (see also Galliano et al. 2003). Note that the H2 line ratio at the CND (∼0.1) is a typical value for thermal processes by X-ray and/or shock heating (Mouri 1994). In this scenario, we might be observing HCN and HCO+ emissions that emerged from molecular clouds directly illuminated by X-ray radiation (i.e., clouds directly seen by the AGN itself, not strongly intercepted by a dusty torus) at the east/west knots, considering the geometry of the type 2 nucleus (the position angle of the almost edge-on H2O maser disk is −45°; Greenhill et al. 1996) and the surrounding CND (the inclination angle is ∼41°; García-Burillo et al. 2014). If so, the X-ray fluxes received at the east/west knots are quite high because of little attenuation, which can result in efficient X-ray heating and thus high
  owing to, e.g., high-temperature neutral–neutral reactions (Harada et al. 2010, 2013). Indeed, if there is no attenuation, we can expect that FX is as high as ∼100 erg s−1 cm−2 even at 30 pc away from the nucleus. According to the model calculation by Meijerink et al. (2007), this high X-ray flux can heat up the gas with
  =105–6 cm−3 to
  100 K.
On the other hand, the radial expansion of the CND of NGC 1068 (Krips et al. 2011; Barbosa et al. 2014) would support the existence of shocks and/or a jet–ISM (and possibly outflow–ISM) interaction, which can also contribute to excite the H2 molecule. We especially mention that García-Burillo et al. (2014) suggested that as much as ∼50% of CO(3–2) emission stems from the outflowing component, which extends out to ∼400 pc away from the nucleus. Hence, there is at least a certain portion of the region dominated by mechanical heating (MDR; e.g., Meijerink et al. 2011; Kazandjian et al. 2012, 2015) in the CND. Again high gas temperature chemistry would be responsible for the high  in this case. Indeed, we can expect the maximum temperature of
  = 105 cm−3 gas to reach as high as ∼2500 K for C-shock when the shock velocity is >20 km s−1 (Flower & Pineau des Forêts 2013), which is high enough to produce prominent H2 emission. Such a high temperature is well beyond the reaction barrier of HCN formation from CN; thus, HCN can be abnormally abundant. According to the model calculation of molecular abundances in MDRs by Kazandjian et al. (2012), XHCN/
 can well exceed 100 when the input mechanical energy is ≳10−18 erg s−1 cm−3, which is large enough to produce high
  . Interestingly, the
  –
– correlation in NGC 1068 has large scatter at lower
  , i.e., away from the AGN (García-Burillo et al. 2014), suggesting the importance of other heating mechanisms than X-ray radiation for driving the underlying chemistry. Indeed, the line velocity dispersion is high at the east/west knots (García-Burillo et al. 2014). In this scenario, it would also be probable that the outflow/shock velocity is so high at N1068 (AGN) that the shock wave provides ionized gas to increase ions (e.g., Dickinson et al. 1980; Elitzur 1983; Koo & Moon 1997; Rawlings et al. 2004), which would potentially result in a depressed
  near the nucleus.
(iii) NGC 1097—another remarkable example is the  measured at the AGN position of NGC 1097 (N1097 (AGN) in Figure 1). As we stated in Section 4.5, we would need enhanced XHCN/
 compared to SB galaxies to yield this high
  when
when  105 cm−3 (I13). However, judging from the very low X-ray luminosity (log
  = 40.8; Liu et al. 2014), the XDR chemistry seems not to play an important role in NGC 1097 (I13). Rather, considering the current spatial resolution (94 pc) for the observations (Table 1), there is another possibility that the line-emitting region is very close to the AGN where we can still expect a high X-ray flux, or a high energy deposition rate per particle (e.g., Maloney et al. 1996). Indeed, the line luminosity of HCN(4–3) in NGC 1097 is totally comparable to that of the individual molecular clump seen at the center of NGC 253 (∼20 pc in size; Sakamoto et al. 2011), suggesting the similarly small size of the line-emitting region in NGC 1097. Radiative feedback from SB activity would be discarded considering the high gas temperature (≳100 K) suggested for the molecular phase (I13; Beirão et al. 2012). On the other hand, mechanical heating can be another choice, which is supported by the detection of a compact radio jet (largest beam-convolved and projected size is ∼90 pc; Thean et al. 2000). A tentative gradient of the HCN(1–0)/HCO+(1–0) line ratio inside the CND (lower toward the center, and higher toward the outer edge of the CND; Martín et al. 2015) would also support this scenario, although Martín et al. (2015) did not fully resolve the CND. Note that an inferred SN rate is quite low as O(10−4) yr−1 (Davies et al. 2007); thus, we can neglect its influence on the chemistry.
(iv) NGC 253 and M82—as for the SB galaxies, the predicted  in Meijerink et al. (2007) is almost consistent with, but seems to be a factor of a few higher than, the observed values. This can be explained by an enhanced cosmic-ray ionization rate due to frequent SNe, which would increase
  even in a dense molecular cloud (e.g., Bayet et al. 2011; Meijerink et al. 2011; Aladro et al. 2013). If this is true,
  can reflect the evolutionary phase of SB activity. The lower
  in M82 than in NGC 253 follows this scenario well (I13; Krips et al. 2008), although we might be able to construct some counterarguments as well (Papadopoulos 2007; Zhang et al. 2014). We mention that mechanical heating seems to be responsible for the relatively high
  in young SB galaxy NGC 253 (SB age ∼6 Myr; Fernández-Ontiveros et al. 2009), whose ratio is totally comparable to those of N7469 (AGN) and N1068 (AGN). Indeed, this heating mechanism is claimed to be important in NGC 253 (Rosenberg et al. 2014a).
5.2. Effects of Metallicity and Elemental Abundance
The chemistry of PDRs in high-metallicity (i.e., Z  Z⊙, where Z⊙ denotes the solar metallicity) environments was modeled by, e.g., Bayet et al. (2012). They showed that XHCN increases with metallicity, whereas
  and XCS are insensitive to the variation, when FUV radiation field and cosmic-ray ionization (mimicking X-ray ionization) rate are fixed. From the observational side, Davis et al. (2013) found a positive correlation between gas-phase metallicity and
  in the sample of early-type galaxies, metal-rich spirals, and SB galaxies, which supported the Bayet et al. prediction. However, if we regard 12 +
  [O/H] as an indicator of the gas-phase metallicity, NGC 1068, NGC 1097, NGC 253, and M82 show almost the same value (Galliano et al. 2008, and references therein). Thus, we suggest that the metallicity is not an important factor for the submm-HCN diagram at least when we treat already chemically evolved systems such as the central regions of galaxies studied in this work.
On the other hand, it seems likely that an overabundance of elemental nitrogen observed in AGNs (e.g., Storchi-Bergmann 1991) can contribute to the HCN enhancement, since XHCN depends on the elemental abundance of nitrogen (Bayet et al. 2008). Interestingly, the HCN(1–0)/HCO+(1–0) line ratio is ∼4 times lower in the LMC than in nearby massive SB galaxies (Anderson et al. 2014). Although this can be partly reconciled by the different gas density in each galaxy, we can also expect that ∼2–3 times lower N/O elemental abundance ratio in the LMC than in the solar-metallicity Galactic environment (Hunter et al. 2009) would have influenced the  .
.
5.3. IR Pumping
This mechanism must be vital for vibrationally excited lines of these dense gas tracers such as HCN(v2 = 11f, J = 4–3), since their energy levels (∼1000 K) are too high to be collisionally excited. Although the limited extragalactic detections of the vibrationally excited lines (Sakamoto et al. 2010; Imanishi & Nakanishi 2013a; Aalto et al. 2015b) limit our discussion on this topic, it would at least influence the rotational population and thus the line intensity of HCN in NGC 4418 (Sakamoto et al. 2010). Meanwhile, HCN(v2 = 11f, J = 4–3) emission was not detected in NGC 7469 (Izumi et al. 2015) in spite of its high IR luminosity of  = 1011.4 L⊙, which is comparable to that of NGC 4418 (Sanders et al. 2003). This would be due to the optical depth effect; we cannot detect a fully optically thin emission even if it surely exists. The column density of HCN(v2 = 11f, J = 4–3) would not be so large along the line of sight toward the CND of NGC 7469 that the emission is optically thin. We speculate that the vibrationally excited lines can only be visible in compact (i.e., close to a warm IR source), heavily obscured (i.e., high column density) nuclei such as in NGC 4418, where we can expect that HCN(v2 = 11f, J = 4–3) line emission is (moderately) optically thick.
5.4. Time-dependent Chemistry
This can be important since  is predicted to be highly time dependent with possible variations of orders of magnitude, especially when
  104 yr has passed from the ignition of chemical reactions (Meijerink et al. 2013). This mechanism would influence the chemistry more in nuclear regions of galaxies than in quiescent regions, since the former region is more dynamic than the latter. The time evolution is typically studied via time clock molecules such as sulfur-bearing species. Indeed, while
  in the CNDs of NGC 1097 and NGC 1068 estimated in LTE analysis are ∼2–3 (Martín et al. 2015; Nakajima et al. 2015), it is just ∼0.2 in the Orion hot core (Table 2 in Esplugues et al. 2014). If we regard the above CNDs as influenced by mechanical heating, and the abundances of these species in NGC 1097 and NGC 1068 depend on the evolution of hot core-like systems, this result indicates that NGC 1097 and NGC 1068 are more evolved systems than the Orion hot core (e.g., Charnley 1997; Esplugues et al. 2014). Future sensitive and systematic study of time clock species will help us understand the chemical evolution in AGNs.
6. SUMMARY AND CONCLUSION
In this paper, we aim at updating the submm-HCN diagram that was tentatively proposed by I13 and investigating the potential origin of the enhanced HCN(4–3) intensity with respect to HCO+(4–3) and CS(7–6) in AGNs (i.e., HCN enhancement). The main results and conclusions are summarized as follows:
- 1.Compiling data from the literature and the ALMA archive, we updated the submm-HCN diagram (Figure 1), first proposed by I13. The number of the data point is significantly increased by ∼5 times (Figure 2). As was supposed by I13, we found a clear trend that AGNs tend to show higher and/or than SB galaxies when these samples are observed at high enough resolutions to separate regions energetically dominated by AGNs (e.g., XDR) from those contaminated by coexisting SB activities. When AGNs are observed at low resolutions (≳1 kpc), the energetics within the beam seems to be dominated by surrounding SB activities, which would result in reduced line ratios.
- 2.Simple non-LTE radiative transfer modelings involving both collisional and radiative excitation were conducted with the RADEX code. Under the constant density of = 105 cm−3, we found that is not so sensitive to excitation, whereas strongly depends on it, especially when CS(7–6) is optically thin and HCN(4–3) is thick.
- 3.From the above non-LTE modelings, we suggest that both and would be significantly enhanced in AGNs by several to even ≳10 times than those in SB galaxies, to reproduce their line ratios. From this perspective, we suggest that the variation of molecular abundances would drive the HCN enhancement in AGNs.
- 4.On the other hand, we could not fully discard the possibility that the systematically higher gas density in AGNs than in SB galaxies is a cause of the HCN enhancement, which was revealed by varying to a higher value (here 5 × 106 cm−3), although the feasibility of such a difference is unclear within the central ∼100 pc regions of galaxies.
- 5.We also investigated HCN/HCO+ and HCN/CS line ratios at other transitions based on our RADEX models. As a result, we found that enhanced and XHCN/XCS subsequently result in high line ratios at any transition, which seems to be consistent with observations.
- 6.Various possible chemical scenarios for the high in AGNs are discussed. Although it is still far from being well understood, we suppose that it would be difficult to explain the high line ratios in AGNs solely by conventional X-ray ionization models. We conclude that some additional mechanisms, e.g., high-temperature chemistry (likely related to mechanical heating), seem to be necessary to fully explain the observations.


In this work, we preferred the scenario of enhanced HCN abundance with respect to HCO+ and CS, rather than a systematically higher gas density in AGNs than SB galaxies (Section 4.4). However, the latter scenario was not fully discarded because of the simplified modelings in this work. Indeed, the observed line ratios are obtainable using a wide parameter space of physical and chemical conditions. To fully solve this problem, we have to conduct multi-line, multi-species non-LTE modelings of both AGNs and SB galaxies with sufficiently high resolutions to spatially resolve their CNDs, as was recently conducted by Viti et al. (2014). Moreover, as presented in Section 6, there are still various competing chemical interpretations for the HCN enhancement. Higher-resolution observations of not only typical and relatively bright dense molecular gas tracers (e.g., HCN, HCO+, HNC, and CS) but also rarer species that are more susceptible to the variation of the underlying chemistry (e.g., NH3, CH3CN, HNCO, CH3OH, and SiO) will be inevitable to test them.
We appreciate the anonymous referee for the careful reading and for the very kind comments to improve this paper. This paper makes use of the following ALMA data: ADS/JAO.ALMA#2011.0.00083.S. ALMA is a partnership of ESO (representing its member states), NSF (USA), and NINS (Japan), together with NRC (Canada) and NSC and ASIAA (Taiwan), in cooperation with the Republic of Chile. The Joint ALMA Observatory is operated by ESO, AUI/NRAO, and NAOJ. The National Radio Astronomy Observatory is a facility of the National Science Foundation operated under cooperative agreement by Associated Universities, Inc. In addition, this research has made use of the NASA/IPAC Extragalactic Database (NED), which is operated by the Jet Propulsion Laboratory, California Institute of Technology, under contract with the National Aeronautics and Space Administration. T.I. was supported by the ALMA Japan Research Grant of NAOJ Chile Observatory, NAOJ-ALMA-0029 and NAOJ-ALMA-0075. T.I. is thankful for the fellowship received from the Japan Society for the Promotion of Science (JSPS).
APPENDIX A: NOTES ON INDIVIDUAL GALAXIES
This appendix provides some basic information on the individual galaxies collected in Table 1 and Figure 1, reported in previous studies. The information was compiled mainly from the perspective of nuclear energetics as mentioned in Section 2.
A.1. NGC 1068
Undoubtedly this is one of the best-studied Seyfert galaxies hosting a luminous type 2 AGN ( = 1043.0 erg s−1; Marinucci et al. 2012). Broad Balmer emission lines are observed in the polarized light (Antonucci & Miller 1985), which is a supportive evidence for the unified model of AGNs (Antonucci 1993). In X-rays, this AGN is known to be substantially Compton thick with NH ∼ 1025 cm−2 along the line of sight (e.g., Matt et al. 2000; Marinucci et al. 2012, 2016). NGC 1068 also hosts a ring- or arm-like SB region with a diameter of ∼30'' (Telesco & Decher 1988). Several unbiased line surveys with single-dish telescopes and/or interferometric observations of individual molecular line emissions at millimeter/submillimeter have been conducted toward this AGN (e.g., Usero et al. 2004; Krips et al. 2011; Aladro et al. 2013; García-Burillo et al. 2014; Takano et al. 2014; Nakajima et al. 2015). The CND is bright not only in CO but also, and more distinctively, in dense gas tracers such as HCN and HCO+ lines (e.g., Schinnerer et al. 2000; Kohno et al. 2008; García-Burillo et al. 2014). This CND mainly consists of two bright knots, namely, east and west knots, which are ∼100 pc away from the exact location of the AGN. Interestingly, the HCN(4–3)/HCO+(4–3) line ratio is two times higher at these knots than at the AGN location (García-Burillo et al. 2014). NGC 1068 is also known to possess a radio jet, ionized outflow, and prominent molecular outflow, which might be interacting with the CND (e.g., Krips et al. 2011).
A.2. NGC 1097
This galaxy hosts a low-luminosity type 1 AGN (LLAGN,  = 1040.8 erg s−1; Liu et al. 2014) as evidenced by double-peaked broad Balmer emission lines with time variability (FWHM ∼ 7500 km s−1; Storchi-Bergmann et al. 1997). Interestingly, NGC 1097 also showed a transient phenomenon from a LINER nucleus to a type 1 AGN. This LLAGN and the CND are surrounded by a circumnuclear SB ring with a radius of ∼10'' = 700 pc (Barth et al. 1995). At infrared, Mason et al. (2007) reported the absence of a 3.3 μm PAH feature at sub-arcsecond scale in the CND, which is typical for a strong radiation field. But attempts to fit the IR data with clumpy torus models failed, which led Mason et al. (2007) to conclude that the torus is absent or weak. Alternatively, they argued that a nuclear star-forming cluster, which is likely coexisting with the LLAGN (Storchi-Bergmann et al. 2005), would be dominant at least in mid-IR (MIR) energetics. Both the CND and the SB ring accompany a large amount of molecular gas prominent in, e.g., CO, HCN, and HCO+ emissions (e.g., I13; Hsieh et al. 2008, 2012; Kohno et al. 2003). It has been claimed that the CND is warm even in the molecular phase (∼several hundred kelvin; I13; Beirão et al. 2012), which would be heated by the AGN radiatively and/or mechanically.
A.3. NGC 1365
This archetypal barred spiral galaxy hosts both a Seyfert 1.5 nucleus ( = 1042.3 erg s−1; Liu et al. 2014) with time variability (Walton et al. 2014) and a circumnuclear SB ring with a radius of 5''–10''. Several star clusters are embedded inside the SB ring (Galliano et al. 2005). A comprehensive review of this galaxy can be found in Lindblad (1999). Alonso-Herrero et al. (2012b) estimated that the AGN contributes only ∼5% of the total IR emission in the central ∼5 kpc, although it seems to dominate the energetics at λ ≲ 24 μm. Previous CO multi-transition observations revealed that most of their emission comes from the SB ring, and little is from around the Seyfert nucleus (Sakamoto et al. 2007). This suggests that the primary heating source of molecular gas is the SB activity in the ring, rather than the AGN, although the spatial distribution of dense gas tracers such as HCN and HCO+ is currently unknown. High-resolution observations of them are thus desirable.
A.4. NGC 4945
This galaxy contains an AGN as evidenced by its strong and rapidly variable X-ray emission (Guainazzi et al. 2000; Puccetti et al. 2014). The intrinsic 2–10 keV luminosity is estimated to be  = 1042.5 erg s−1 (Guainazzi et al. 2000). The AGN is classified as Seyfert 2 with a huge amount of obscuring material (NH = 1024.5 cm−2; Puccetti et al. 2014). It has also been found that NGC 4945 exhibits a prominent SB activity including a large IR luminosity and IRAS color similar to a giant H ii region, but almost an edge-on view (i = 78°) has prevented detailed study at optical wavelengths. Marconi et al. (2000) reported that the spatial distribution of the starbursting region is ring-like with a radius of ∼25 (50 pc), which is visible most clearly in a Paα map. Chou et al. (2007) argued that this SB activity, rather than the AGN, is the dominant heating source for dust in the nuclear region. Furthermore, interferometric HCN(1–0), HCO+(1–0), and HNC(1–0) observations revealed that these dense gas tracers are emitted from an inclined rotating disk-like component with a radius of ∼4'' (Cunningham & Whiteoak 2005), i.e., emanating from both around the AGN and the SB ring. Higher-resolution observations are thus necessary to obtain a reliable spectrum of each component.
A.5. NGC 7469
The existence of a type 1 AGN ( = 1043.2 erg s−1; Liu et al. 2014) in this galaxy is evidenced by broad Balmer emission lines (FWHM ∼ 4370 km s−1; e.g., Peterson et al. 2014) with time variability (Bonatto & Pastoriza 1990; Collier et al. 1998). Time variability is also confirmed by UV and X-ray observations (e.g., Nandra et al. 2000; Scott et al. 2005). A core jet-like structure (Lonsdale et al. 2003) and ionized outflows (Blustin et al. 2007) have been found, although high-resolution H2 observations could not detect any signature of a jet–ISM (or outflow–ISM) interaction in the CND (e.g., Hicks et al. 2009). Similar to some other Seyfert galaxies, the AGN and the CND of NGC 7469 are surrounded by a prominent SB ring with a radius of 15–25 (Soifer et al. 2003; Díaz-Santos et al. 2007), which accounts for two-thirds of the bolometric luminosity of the galaxy (Genzel et al. 1995). Inside the nuclear r ≲ 130 pc region, Davies et al. (2007) reported the existence of star clusters with modest ages of 110–190 Myr. As for the molecular phase, Izumi et al. (2015) reported the significant concentration of HCN(4–3), HCO+(4–3), and CS(7–6) line emissions toward the CND.
A.6. NGC 4418
This is a luminous infrared galaxy (LIRG) with an infrared luminosity of  1011 L⊙ (Imanishi et al. 2004). NGC 4418 shows no clear AGN signature at optical and X-ray (Armus et al. 1989; Maiolino et al. 2003), However, the 5–23 μm MIR spectrum shows a typical feature of an obscured AGN (Spoon et al. 2001). Furthermore, Imanishi et al. (2004) found that the nuclear star-forming activity estimated from PAH emission can account for only 1/50 of the total IR luminosity, suggesting that the primary energy source is deeply embedded in dust and gas. Indeed, Sakamoto et al. (2013) estimated that the dust continuum opacity at 860 μm is surprisingly as large as
  1, suggesting a concordantly large hydrogen column density of NH ∼ 1026 cm−2. As for the hidden energy source, Imanishi et al. (2004) also suggested that the observed large equivalent width of H2 emission and a high HCN(1–0)/HCO+(1–0) ratio at the nucleus can be well explained by the presence of a strong X-ray source such as an AGN. Note that shock heating due to in/outflows detected by molecular observations (e.g., González-Alfonso et al. 2012; Sakamoto et al. 2013) would also influence these features. Considering the above, we classify this galaxy as a buried AGN in this paper, although the evidence is still tentative.
A.7. IRAS 12127-1412
This is a ULIRG with  = 1012.1 L⊙ (Imanishi et al. 2006), consisting of two nuclei with a separation of ∼10'' (Kim et al. 2002). Optical spectroscopy classified this object as a non-Seyfert (LINER or H ii region; Veilleux et al. 1999), but the nuclear source is obscured as indicated by a large silicate optical depth of ∼2.5–3.0 (Imanishi et al. 2007a). IR observations, on the other hand, suggest that the energy source of the northeast nucleus is very compact, which is further characterized by weak PAH emissions and a steep temperature gradient (Imanishi et al. 2006, 2007a). These are characteristic features to buried AGNs; thus, we classify this object as such. Note that IRAS 12127-1412 has a 1.4 GHz radio luminosity that is ∼4 times brighter than the value expected for a star-forming galaxy (Spoon & Holt 2009), suggesting the existence of an AGN jet. This hypothesized jet may explain the observed outflow signatures in the [Ne iii] line (Spoon & Holt 2009) as well.
A.8. M82
This galaxy, as well as NGC 253, is one of the most studied galaxies after the Milky Way. It is famous for its intense star formation (SFR ∼ 10 M⊙ yr−1; Förster Schreiber et al. 2003) and a prominent superwind at many wavelengths (e.g., Bregman et al. 1995; Ohyama et al. 2002). The current SB region extends over ∼500 pc centered on the nucleus (SB core), which consists of four high surface brightness clumps denoted as A, C, D, and E in O'Connell & Mangano (1978). The bolometric luminosity of the SB core is ∼1010.8 L⊙, half of which is emanating from OB stars (Förster Schreiber et al. 2003). Higher-resolution Hubble Space Telescope observations revealed that ∼200 super star clusters exist in that nuclear region (e.g., Melo et al. 2005). The SB history was extensively modeled by Rieke et al. (1993) and Förster Schreiber et al. (2003), who predicted that the bursts occurred ∼10 and 5 Myr ago, each lasting for a few Myr. The estimated age is consistent with the observed molecular properties, suggesting that M82 hosts an evolved SB whose energetics is dominated by radiative processes (i.e., PDRs) rather than shocks (e.g., Aladro et al. 2011). Note that it has been postulated that M82 hosts an intermediate-mass black hole located ∼600 pc away from the nucleus (e.g., Patruno et al. 2006; Pasham et al. 2014).
A.9. NGC 253
The star-forming region of this nearest and IR-brightest SB galaxy is located in the central r ≲ 500 pc (e.g., Scoville et al. 1985). High-resolution millimeter/submillimeter observations revealed that molecular gas in the nuclear region is distributed along a 700 × 200 pc bar-like structure containing several dense clumps (e.g., Paglione et al. 1995; Sakamoto et al. 2006a, 2011). The SB activity has been taking place for at least a few Myr, producing an IR luminosity of ∼1010.5 L⊙ (Telesco & Harper 1980), or an SFR of ∼5 M⊙ yr−1 assuming a Kennicutt–Schmidt relation (Kennicutt 1998). The nuclear region consists of a number of massive stellar clusters (e.g., Fernández-Ontiveros et al. 2009), some of which have a radio counterpart (Ulvestad & Antonucci 1997). Assuming an instantaneous SB, the age of the stellar clusters is estimated to be ∼6 Myr, whereas they would consist of young (≲4 Myr) and old (∼10 Myr) populations in actuality (Fernández-Ontiveros et al. 2009). Prominent ionized and molecular outflows are emerging from this region as well (e.g., Weaver et al. 2002; Bolatto et al. 2013). Considering the relatively young stellar age, NGC 253 would be in an early phase of an SB evolution. Indeed, Martín et al. (2006) suggested that the low-velocity shocks rather than UV radiation would dominate the molecular chemistry in NGC 253.
A.10. NGC 1614
The merging system NGC 1614 is classified as a LIRG ( = 1011.6L⊙; Imanishi & Nakanishi 2013b), which has a bright optical center and two spiral arms at scales of a few kiloparsecs. At optical wavelengths, it is classified as an SB galaxy (Veilleux et al. 1995; Véron-Cetty & Véron 2010). Indeed, a 2.5–30 μm IR spectrum, prominent 3.3 μm PAH emission and 4.05 μm Brα emission (and their ratios to IR luminosity), and a 2.3 μm stellar CO absorption feature are typical of an SB galaxy (Alonso-Herrero et al. 2001; Brandl et al. 2006; Imanishi et al. 2010), and there is no clear indication of AGN activity. The star-forming activity is significantly concentrated toward the nuclear region as indicated by an SB ring with a radius of ∼300 pc clearly visible at Paα emission (Alonso-Herrero et al. 2001) and radio emission (e.g., Olsson et al. 2010). A low HCN(1–0)/HCO+(1–0) ratio is also supportive of dominance of SB activity (Costagliola et al. 2011).
A.11. NGC 3256
The late-stage merging system NGC 3256 is the most luminous galaxy within 40 Mpc with  = 1011.6 L⊙ (Sanders et al. 2003), which has a double nucleus with a separation of ∼5'' = 850 pc. The existence of the double nucleus has been revealed at radio, near-IR (NIR), X-ray, as well as molecular line emission (Norris & Forbes 1995; Kotilainen et al. 1996; Lira et al. 2002; Sakamoto et al. 2006b). Although NGC 3256 is luminous in X-ray (
 1042 erg s−1; Lira et al. 2002), the presence of an AGN is not supported by a considerable amount of observational evidence (Lípari et al. 2000; Lira et al. 2002; Jenkins et al. 2004). The relatively strong X-ray emission would be stellar in origin since hundreds of young stellar clusters have been found in the central region of this system (Zepf et al. 1999; Alonso-Herrero et al. 2002). Indeed, the above-mentioned X-ray luminosity is consistent with the boundary to separate AGNs from SB galaxies found in deep X-ray surveys (e.g., Alexander et al. 2005). Therefore, we classify this object as an SB galaxy in this paper.
A.12. NGC 3628
SB galaxy NGC 3628 ( = 1010.3L⊙; Sanders et al. 2003) is a member of the Leo Triplet (Arp 317), including NGC 3627 and NGC 3623 as well. Radio observations of both continuum and hydrogen recombination line emissions revealed that this galaxy shows SB activity in its central ∼500 pc region (Condon et al. 1982; Zhao et al. 1997). A large-scale galactic wind, related to this SB, has been detected in X-ray and Hα emissions (Strickland et al. 2001, 2004). In addition, a subkiloparsec-scale molecular outflow is also found (Tsai et al. 2012). Note that an X-ray point source (
 1040 erg s−1), which is a candidate of an intermediate-mass black hole, was discovered in this galaxy (Strickland et al. 2001). But the location of the object is at least 20'' away from the nucleus. Thus, it would have no contribution to the molecular line observations with the APEX 18'' beam used in this paper (Zhang et al. 2014).
A.13. NGC 7552
A nearly face-on barred spiral galaxy NGC 7552 ( = 1010.9L⊙; Sanders et al. 2003) has been classified as a LINER galaxy owing to its weak [O i] emission (Durret & Bergeron 1988). It hosts a prominent circumnuclear ring with a radius of ∼25 or 250 pc, which is the powering source of SB activity (e.g., Schinnerer et al. 1997; Brandl et al. 2012). This SB ring is occupied by a number of young stellar clusters (Brandl et al. 2012), which would have formed about 10 Myr ago (Schinnerer et al. 1997). Inside the SB ring, neither X-ray (Liu & Bregman 2005) nor NIR (Forbes et al. 1994) observations have shown clear evidence of nuclear activity. Therefore, this galaxy is genuinely an SB galaxy. High-resolution observations revealed that dense molecular gas is mainly concentrated in the SB ring (Pan et al. 2013).
A.14. IRAS 13242-5713
Unlike other sample galaxies, observational information on this LIRG ( = 1011.0L⊙; Sanders et al. 2003) is currently very limited. However, based on the MIR observations with Spitzer IRS, Alonso-Herrero et al. (2012a) reported that an AGN, if it exists, has almost no contribution to the MIR spectrum. Indeed, [Ne v] 14.32 μm, which is an indicator of the existence of an AGN, was not detected (Alonso-Herrero et al. 2012a). Then, although the observational evidence is lacking, we conclude that an AGN is absent, or at least negligible to the energy budget in this galaxy, and classify it as an SB galaxy.
A.15. N113
This is an H ii region in the LMC associated with a clumpy molecular cloud (Seale et al. 2012) with a mass of a few × 105 M⊙ in total (Wang et al. 2009). The molecular cloud is a site of massive star formation, as evidenced by several embedded young stellar objects (YSOs; e.g., Seale et al. 2009, 2012; Carlson et al. 2012). N113 hosts the most intense H2O maser of the Magellanic Clouds (e.g., Oliveira et al. 2006) and the OH maser as well (Brooks & Whiteoak 1997). This region (and the LMC as well) is characterized by its low-metallicity ISM (Z ∼ 1/3 Z⊙; e.g., Hunter et al. 2009). Therefore, this is an appropriate object to investigate the effect of metallicity on molecular chemistry.
A.16. N159
This is also the best-studied H ii region in the LMC, close to the evolved SB of 30 Doradus. The N159 complex is a type III giant molecular cloud as classified by Fukui et al. (2008), i.e., a GMC with H ii regions and young star clusters. Indeed, this region is known to host many YSOs, OH maser sources, and ultracompact H ii regions (e.g., Chen et al. 2010). Extensive studies of molecular material have been conducted for this region (e.g., Bolatto et al. 2000; Mizuno et al. 2010; Minamidani et al. 2011; Okada et al. 2015; Paron et al. 2016). The total mass of clumps visible at 12CO(3–2) emission is ∼6 × 10⁵ M⊙ (Minamidani et al. 2008). Recent non-LTE modelings of high-density gas tracers such as HCN, HCO+, and CS revealed the existence of warm (Tkin ∼ 80 K) and dense ( 5 × 105 cm−3) gas (Paron et al. 2016). As is the case of N113 (and LMC), this region is also a site with low metallicity.
APPENDIX B: EXCITATION OF HCO+(4–3) AND CS(7–6) UNDER NON-LTE WITH PHOTON TRAPPING
The molecular excitation temperatures (Tex) of HCO+(4–3) and CS(7–6) are shown in Figures 11 and 12, as a function of the background radiation temperature (Tbg), respectively. The overall trend is totally similar to the case of HCN(4–3) as shown in Figure 3; Tex approaches Tbg at Tbg ≳ 10 K, when the line is optically thin to moderately thick (left two panels). On the other hand, in the optically thick cases, Tex is getting close to the gas kinetic temperature (Tkin) and independent of Tbg, owing to an efficient photon trapping effect.
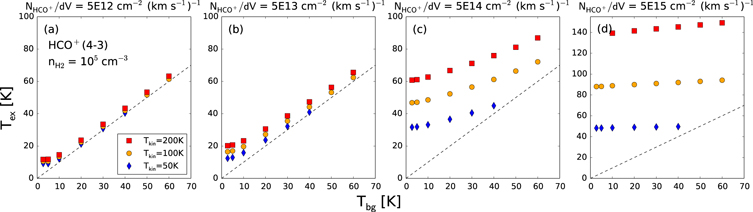
Figure 11. Excitation temperature (Tex) of HCO+(4–3) as a function of background temperature (Tbg). The red square, orange circle, and blue diamond symbols indicate the models with gas kinetic temperature (Tkin) of 200, 100, and 50 K, respectively. We here fixed gas volume density ( ) to 105 cm−3. Four cases of the ratio of line-of-sight column density to velocity width (
 ) of (a) 5 × 10¹², (b) 5 × 10¹³, (c) 5 × 10¹⁴, and (d) 5 × 1015 cm−2 (km s−1)−1 are shown. Note that the scale of the y-axis in panel (d) is different from the others. The dashed line in each panel indicates Tex = Tbg. Some cases where the line emission shows a maser feature are excluded. The overall trend is similar to that of HCN(4–3), as shown in Figure 3.
Download figure:
Standard image High-resolution image
Figure 12. Same as Figure 11, but for the cases of CS(7–6).
Download figure:
Standard image High-resolution image
Footnotes
- 19
1 G0 = 1.6 × 10⁻³ erg s−1 cm−2.
- 20
- 21
The multi-line analysis by Viti et al. (2014) suggested the ratio of CO column density to velocity width to be 3 × 1017 cm−2 (km s−1)−1 (see their Table 6). With the line width of ∼200 km s−1 (García-Burillo et al. 2014) and the assumption of CO fractional abundance of 10−4 (e.g., Blake et al. 1987), this result corresponds to H2 column density of ∼6 × 1023 cm−2. This value is ∼1 order of magnitude smaller than that of the X-ray-derived total hydrogen column density (Marinucci et al. 2012, 2016). However, we suggest that this inconsistency would not be a problem because the averaged column density over the ∼100 pc beam employed by Viti et al. (2014) would show the lower limit of the nuclear (X-ray) obscuration operating at a much smaller scale (see also Jaffe et al. 2004 for the expected size of the dusty torus of NGC 1068).
- 22