
Abstract
The present study focused on CO2 capture, storage, and conversion through the innovative integration of plasma–ionic liquid (IL) technology. For the first time, we employed plasma-IL technology to confront climate change challenges. We utilized 1-Butyl-3-methylimidazolium chloride IL to capture and store CO2 under atmospheric pressure, and subsequently employed plasma to induce the transformation of IL-captured CO2 into CO. Furthermore, we performed computer simulations to enhance our understanding of the CO2 and CO capture processes of water and IL solutions. This comprehensive approach provides valuable insights into the potential of plasma–IL technology as a viable solution for climate change.
Export citation and abstract BibTeX RIS

Content from this work may be used under the terms of the Creative Commons Attribution 4.0 license. Any further distribution of this work must maintain attribution to the author(s) and the title of the work, journal citation and DOI.
Since the onset of the industrial revolution, there has been a steady increase in CO2 emissions into the environment. This poses a significant global climate challenge, prompting the need to find effective strategies for minimizing such greenhouse gas emissions. 1–3) Ionic liquids (ILs) have recently gained considerable interest in CO2 capture. 3–5) The absorption of CO2 by ILs results from physical interactions between the anions and cations of the ILs and CO2 molecules. 6)
An alternative approach to reducing the CO2 concentration in the atmosphere involves the conversion of CO2 into valuable products. In recent years, non-thermal plasma (NTP) has experienced substantial growth to enhance the breakdown and conversion of CO2. 7) Our prior research successfully demonstrated that ILs can protect the protein structure in the presence of NTP. 8–10) These studies showed that ILs are stable in the presence of NTPs and do not denature the proteins. Nevertheless, no study to date has demonstrated the capture and conversion of CO2 using a plasma–IL combination. In a previous study, Li and Gallucci 11) reported the capture of CO2 using hydrotalcite pellets and later the desorption and CO2 conversion using an Ar feed gas coaxial DBD reactor. Moreover, Masaaki et al. reported that plasma-based desorption was higher than thermal desorption of CO2. 12)
Hence, in this pioneering effort, we employed an IL for CO2 capture [Fig. 1(a)] and storage [Fig. 1(b)] followed by the conversion of the captured CO2 into CO using NTP [Fig. 1(c)]. This study used 1-Butyl-3-methylimidazolium chloride ([Bmim]Cl) IL, obtained from Sigma-Aldrich. We implemented streamer plasma (as described in our previous articles 13,14 ) to convert captured CO2 to CO, as shown in Fig. 1. In the prior investigation, Jang et al. showed the solubility of CO2 in [Bmim]Cl IL at a temperature range of 353.15–373.15 K under high pressure conditions at approximately 40 MPa. 15) [Bmim]Cl IL also showed versatility in applications such as supercritical carbon dioxide preparation, 16) cellulose dissolution, 17) etc. Therefore, we utilized [Bmim]Cl IL to effectively capture and store CO2 at room temperature and converted the stored CO2 into CO using NTP.

Fig. 1. Schematic description of (a) CO2 capture, (b) CO2 storage, and (c) conversion of CO2 using plasma–[Bmim]Cl ionic liquid combination.
Download figure:
Standard image High-resolution imageIn this study, we introduced CO2 with a purity of 99.99% into a 45 ml solution of deionized (DI) water and DI water + [Bmim]Cl (4, 12, and 20 wt%) along with 5 ml of ionic strength adjuster for CO2. CO2 was introduced into the reactor at a flow rate of 0.372 l min−1 through a gas tube with a diameter of 4.35 mm for 2 min. Subsequently, we measured the absorbed CO2 concentration using the sensor (details provided in the supporting files). We used pure CO2 in the present study to avoid the influence of other gases (diluting gas) on holding the CO2 in the IL solution and the role of dilute gas in CO2 conversion. After 10 min of CO2 supply, the CO2 concentration in the solution was 630 ± 50 mg l−1, which later decreased to 9 ± 4 mg l−1 after 1440 min, as displayed in Fig. 2(a). Hence, the loss of CO2 concentration after 1440 min was 621 mg l−1. On the other hand, for [Bmim]Cl (4 wt%), the CO2 concentration was 860 ± 55 mg l−1 after 10 min of CO2 supply, although the final CO2 concentration after 1440 min was 310 ± 20 mg l−1 [see Fig. 2(a)]. Furthermore, with an increase in the [Bmim]Cl concentration to 10 wt%, the CO2 concentration after 10 min was 830 ± 60 mg l−1, and after 1440 min, it was 330 ± 11 mg l−1 [Fig. 2(a)]. This observation indicates that CO2 absorption decreases at higher CO2 concentrations but sustains a substantial level over time.
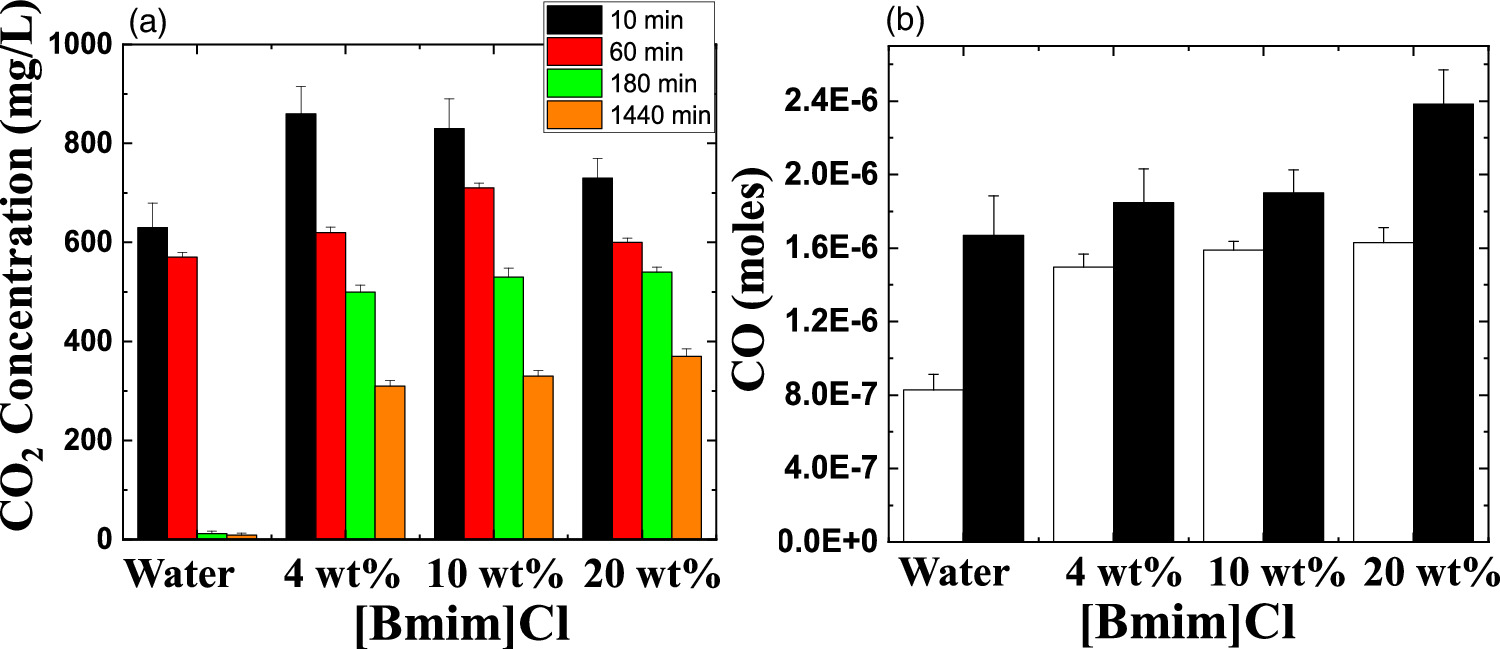
Fig. 2. (a) CO2 concentration in the water and different concentrations of [Bmim]Cl (4, 10, and 20 wt%), and (b) CO production using streamer plasma from captured CO2 from water and [Bmim]Cl (4, 10, and 20 wt%) after 1440 min. White column is without CO2 flow and black column is with CO2 flow.
Download figure:
Standard image High-resolution imageLater, we increased the [Bmim]Cl concentration to 20 wt%, and after 10 min of CO2 supply, the measured CO2 concentration was 730 ± 40 mg l−1, which was lower than the concentrations observed with 4 wt% and 10 wt% [Bmim]Cl [see Fig. 2(a)]. However, after 1440 min, the captured CO2 concentration was 370 ± 15 mg l−1, which was higher than the concentrations observed with other wt% values of [Bmim]Cl. Note that the study did not explore concentrations of [Bmim]Cl higher than 20 wt% due to the elevated solution viscosity, making it challenging to measure CO2 accurately with the sensor. The results suggest that the CO2 absorption decreases as the [Bmim]Cl concentration increases. This trend occurs due to the rising viscosity of the solution, leading to a reduction in CO2 solubility, and this correlation is also supported by previous studies. 3,18) Meanwhile, the respective losses in CO2 concentration after 1440 min were 550, 500, and 360 mg l−1 for 4, 10, and 20 wt% [Bmim]Cl solutions. This study demonstrates that at higher concentrations of [Bmim]Cl, the IL in the solution can effectively retain the captured CO2 for a longer time at atmospheric pressure and room temperature than lower concentrations of [Bmim]Cl solutions.
In the subsequent section, we measured the CO formation after 1440 min from the stored CO2 in DI water and [Bmim]Cl solutions, which were exposed to streamer plasma for 1 min at atmospheric pressure without any feed gas (discharge occurs without gas flow, maintaining a relative humidity of approximately 45%. Following the plasma discharge, N2 gas flowed to remove the CO or other gases produced during the discharge from the reactor). Five milliliters of the solution was transferred to the plasma reactor and then treated with plasma for 1 min (see Fig. 1). A 5 ml solution was used due to current reactor design limitations; however, we plan to treat a larger volume of the solution in future studies. The plasma discharge power was 1.3 W for DI water and [Bmim]Cl (2 wt%), while for [Bmim]Cl (10 wt% and 20 wt%), the discharge power was slightly decreased to 1.2 W due to an increase in the ionic state of the solution (see the supporting file for details). The solution's plasma treatment resulted in CO production in the gas phase, which was detected by a CO sensor (described in the supporting file). The plasma treatment on the DI water without CO2 flow solution resulted in a concentration of 8.28 × 10⁻⁷ ± 0.85 × 10⁻⁷ moles of CO. Meanwhile, the CO concentrations for solutions of 4, 10, and 20 wt% [Bmim]Cl without CO2 flow were 1.49 × 10⁻⁶ ± 0.71 × 10⁻⁷, 1.58 × 10⁻⁶ ± 0.47 × 10⁻⁷, and 1.62 × 10⁻⁶ ± 0.81 × 10⁻⁷ moles, respectively [see Fig. 2(b)].
On the other hand, plasma discharge on the CO2 flow solution after 1440 min resulted in the following concentrations: 1.67 × 10⁻⁶ ± 0.21 × 10⁻⁶ moles for water, 1.85 × 10⁻⁶ ± 0.18 × 10⁻⁶ moles for [Bmim]Cl 4 wt%, 1.90 × 10⁻⁶ ± 0.12 × 10⁻⁶ moles for [Bmim]Cl 10 wt%, and 2.38 × 10⁻⁶ ± 0.19 × 10⁻⁶ moles for [Bmim]Cl 20 wt% [Fig. 2(b)]. These findings indicate that more CO was produced for higher concentrations of [Bmim]Cl, possibly because these solutions stored more CO2. The CO generation from CO2 is due to the electron-based reaction, and we assume that NTP treatment can break the physical binding of CO2 with IL and convert it to CO [Eq. (1)]. The O generated from the reaction is later converted to O2 [see Eq. (2)] and released into the air or bound with the IL solution. The fate of the O2 bound with the IL solution is unknown. There are many possible CO2 and H2O dissociation products, as explained in our previous study. 13) Some are mentioned below; refer to Eqs. (1)–(9).


The detection of CO in the gas phase from those solutions that were not treated with CO2 could be due to the decomposition of the [Bmim]Cl solution or the decomposition of captured CO2 during solution preparation. However, we detected CO in the DI water (not treated with CO2); this CO detection was due to the solubilized CO2 in the DI water. Similarly, it is highly possible that the CO detection in the [Bmim]Cl solutions (not treated with CO2) was due to captured CO2 in the [Bmim]Cl during solution preparation. As shown in Fig. 2(a), [Bmim]Cl solution holds more CO2 than water; therefore, more CO2 is held in the [Bmim]Cl during solution preparation, resulting in higher CO formation. If we compare the data of [Bmim]Cl 4, 10, and 20 wt% (without CO2 flow) with only water, more CO is detected. Although there is a slight increase in CO between [Bmim]Cl 4 wt% and 10 wt%, the increase in CO is negligible between the solutions of [Bmim]Cl 10 wt% and 20 wt%. Indeed, if CO were produced because of the degradation of [Bmim]Cl, its impact would be negligible. This conclusion arises from the observation that the CO concentration did not rise proportionally with the increase in [Bmim]Cl concentration. Additionally, our previous study showed that IL can protect the hemoglobin protein structure in the presence of DBD treatment using different feed gases for 10 min. 9) Additionally, we checked the absorbance spectra of [Bmim]Cl IL (4, 10, and 20 wt%) solutions before and after plasma treatment. Figure 3(a) shows the absorbance spectra of 1 min NTP-treated water, [Bmim]Cl IL (4 wt%) control (without NTP treatment), and 1 min NTP-treated [Bmim]Cl IL (4 wt%). No peak shift was observed before and after NTP treatment. The absorbance spectra of the [Bmim]Cl IL control (without NTP treatment) were similar to the literature. 19) This shows that a 1 min plasma treatment did not degrade the [Bmim]Cl. Similar results were also observed for the [Bmim]Cl IL (10 wt% and 20 wt%) control (without NTP treatment) and 1 min NTP-treated [Bmim]Cl IL (10 wt% and 20 wt%), as shown in Figs. 3(b) and 3(c). Although we are not neglecting the degradation of [Bmim]Cl IL caused by the plasma, the current study concludes that if the CO production were due to [Bmim]Cl IL degradation, then it would be a very small or insignificant amount.
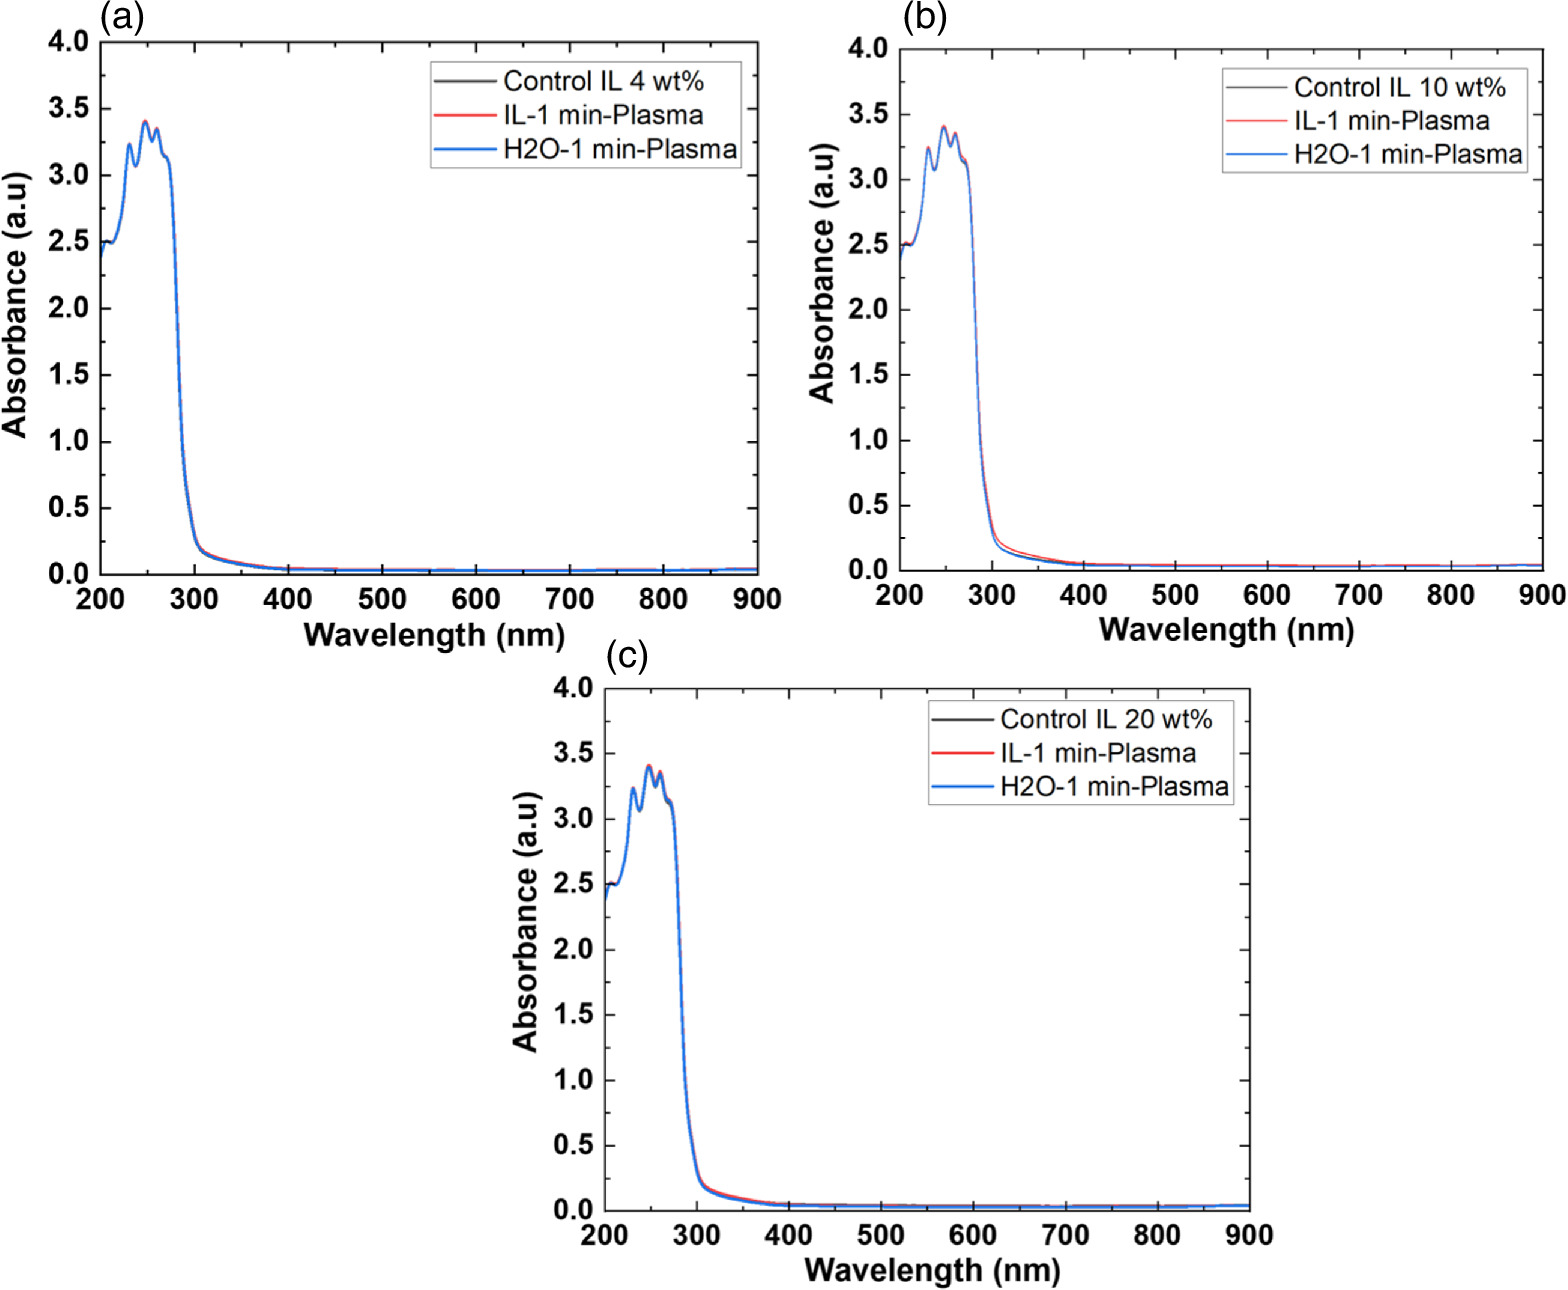
Fig. 3. Absorbance spectra of (a) [Bmim]Cl (4 wt%), (b) [Bmim]Cl (10 wt%), and (c) [Bmim]Cl (20 wt%), with and without 1 min NTP treatment, along with 1 min NTP treatment of water.
Download figure:
Standard image High-resolution imageTo address any possibility of [Bmim]Cl degradation with longer treatment durations, we measured the absorbance spectra after 3, 5, and 7 min, as shown in Fig. S1. Figure S1(a) represents the absorbance spectra of DI water after NTP treatment for different treatment times. Figures S1(b), S1(c), and S1(d) show a slight increase in intensity in the absorbance spectra for the 7 min NTP treatment to IL solution. However, this might be attributed to the accumulation of reactive species in the solution or the possibility of hypochlorite formation, as illustrated in Eqs. (10)–(12).


Figure 4 shows no visible change in the [Bmim]Cl solution before and after NTP treatment (1 min and 7 min). The abstraction of hydrogen or adding OH in 1-Butyl-3-methylimidazolium is possible, but it requires high energy to break the carbon chain from 1-Butyl-3-methylimidazolium to produce CO. However, we will conduct further detailed studies on the degradation of 1-Butyl-3-methylimidazolium in the future.
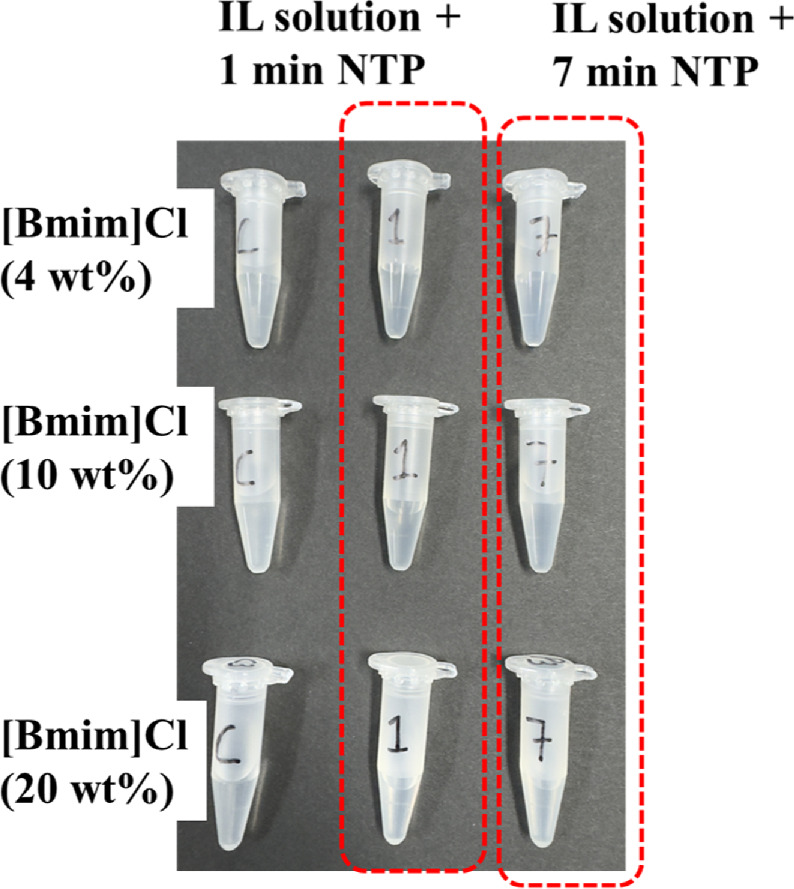
Fig. 4. Images of [Bmim]Cl solutions at 4, 10, and 20 wt% after 1 and 7 min NTP treatment, compared to control.
Download figure:
Standard image High-resolution imageLater, we calculated the percentage of energy efficiency for CO production (η %) using Eq. (13) from Ref. 11
For water, the η% was 0.60%, while for [Bmim]Cl IL 4 wt%, 10 wt%, and 20 wt%, the η% was 0.67%, 0.75%, and >0.94%, respectively. This indicates that a 60 s NTP treatment can generate CO, but simultaneously, plasma energy was also utilized in the CO2 desorption, and production of reactive oxygen and nitrogen species (RONS) due to water dissociation [Eqs. (1)–(12)], heat, etc. There is no direct comparison of our work with any reported studies, as our CO2 absorbent IL is mixed with water, and we have not used any other gas flow that can aid in desorption. Nevertheless, in a previous study, researchers reported a maximum energy efficiency of 0.98% for the first 400 s, which later decreased to 0.68% for 1000 s, using Ar plasma with hydrotalcite pellets as a CO2 sorbent. 11) Compared to the reported work by Li and Gallucci, 11) our energy efficiency for CO production was slightly less for [Bmim]Cl IL 20 wt%. However, there are significant differences in the treatment conditions and the target of the work (use of water-soluble sorbent).
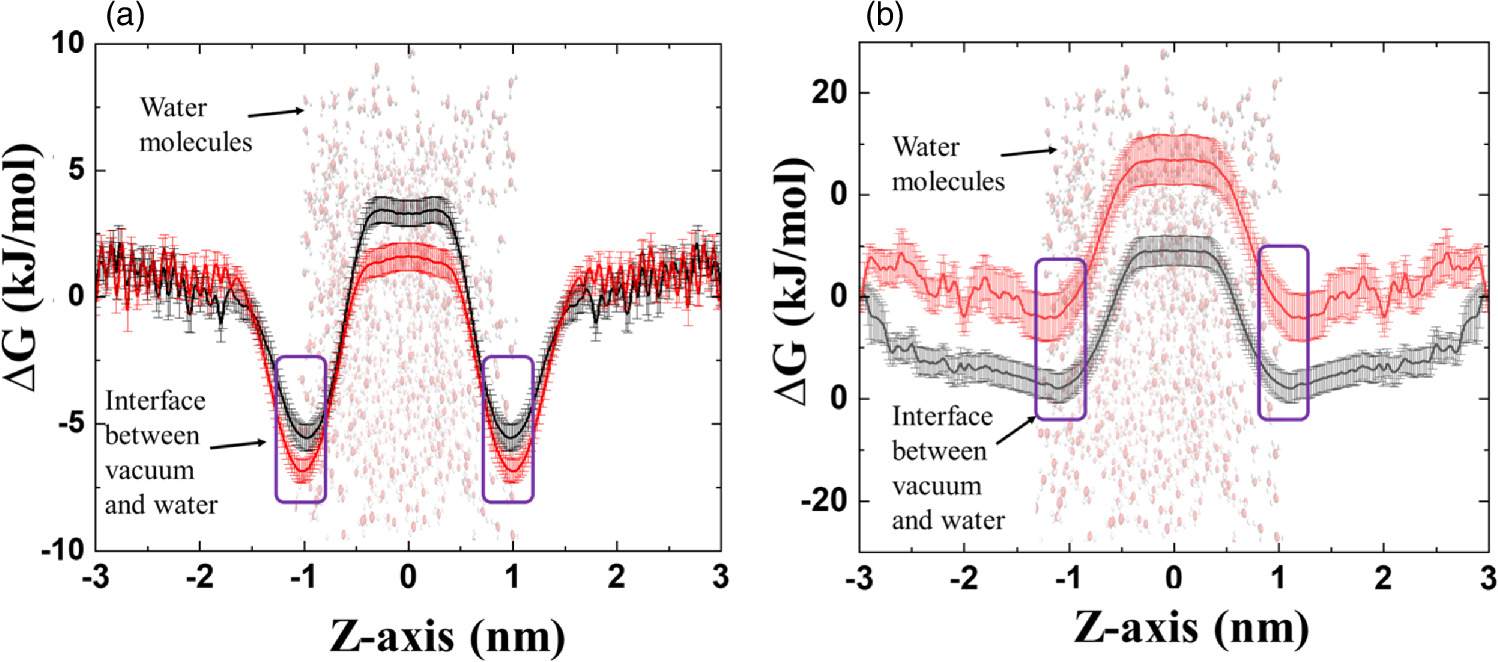
Furthermore, we conducted non-reactive molecular dynamics (MD) simulations to calculate the free energy profiles (FEPs) of CO2 and CO in both water and a mixture of water + [Bmim]Cl. MD simulations were carried out using umbrella sampling (US) simulations. 20,21) The US simulation technique provides comprehensive FEPs along the reaction coordinates for CO2 and CO. Details of the simulation procedures can be found in the supporting file. Figure 5 illustrates that the FEPs of CO2 and CO decrease at the vacuum–water interface, indicating minimum values of ∆G that facilitate the accumulation of CO2 and CO. This suggests an enhancement of the solute molecule concentration at the vacuum–water or vacuum–water + [Bmim]Cl interface.
Fig. 5. FEP for water and water + [Bmim]Cl for (a) CO2 and (b) CO.
Download figure:
Standard image High-resolution image
The ∆Ggs values were calculated to represent the free energy change for the vacuum–water interface, whereas ∆Gsl was associated with the free energy barriers transitioning from the vacuum–water interface into the liquid phase. Hydration-free energy (∆Ghydr) values were used to elucidate the transport of CO2 and CO molecules from the gaseous phase into the solution (water or water + [Bmim]Cl). Comprehensive explanations of the ∆Ggs, ∆Gsl, and ∆Ghydr measurements are available in previous studies. 22,23) The ∆Ggs, ∆Gsl, and ∆Ghydr values for CO2 in water were determined to be −5.52, 8.97, and 3.45 kJ mol−1, respectively [see Fig. 5(a) and Table I]. In contrast, the corresponding ∆Ggs, ∆Gsl, and ∆Ghydr values for CO2 in water + [Bmim]Cl were −6.83, 8.47, and 1.64 kJ mol−1, respectively [see Fig. 5(a) and Table I]. These simulation results closely align with our experimental findings, indicating that the ∆Ggs and ∆Ghydr values are lower in water + [Bmim]Cl compared to water, clearly demonstrating that CO2 encounters less resistance in the IL solution, potentially increasing the amount of CO2 molecules entering into the solution (water + [Bmim]Cl) compared to water.
Table I. Calculated ∆Ggs, ∆Gsl, and ∆Ghydr values using US simulation.
| CO2 | CO | |||||
|---|---|---|---|---|---|---|
| Solution | ∆Ggs | ∆Gsl | ∆Ghydr | ∆Ggs | ∆Gsl | ∆Ghydr |
| Water | −5.52 | 8.97 | 3.45 | −8.93 | 13.36 | 4.43 |
| [BMIM]Cl (10 wt%) | −6.83 | 8.47 | 1.64 | −1.11 | 14.45 | 13.34 |
For CO in water, the ∆Ggs, ∆Gsl, and ∆Ghydr values were −8.93, 13.36, and 4.43 kJ mol−1, respectively (see Table I). Conversely, for CO in water + [Bmim]Cl, the ∆Ggs, ∆Gsl, and ∆Ghydr values were −1.11, 14.45, and 13.34 kJ mol−1, respectively [see Fig. 5(b) and Table I]. These US simulations align with our experimental results, as the ∆Ggs and ∆Ghydr values were lower for CO permeation in water than in water + [Bmim]Cl. This implies that after CO production by plasma, there is a reduced chance of absorption in IL compared to water.
In summary, we have introduced a novel technology that integrates plasma and [Bmim]Cl IL for the simultaneous capture, storage, and conversion of CO2 for the first time. Our experimental results indicate that the water + [Bmim]Cl solution can store CO2 under atmospheric pressure and room temperature. Moreover, the release of CO2 during plasma treatment produces CO. Our MD simulation supports our experimental findings, suggesting that CO2 molecules easily transition from the gaseous phase into the water + [Bmim]Cl solution. In contrast, the penetration of CO molecules into the water + [Bmim]Cl solution is more challenging than water alone. This observation implies that once plasma produces CO, its solubility in the IL solution may be limited, showcasing the potential of this technology for efficient CO2 capture and conversion.
Acknowledgments
This work was supported by JSPS-KAKENHI grant no. 22H01212. Additionally, it was partly funded by JST CREST (JPMJCR19R3), JSPS-KAKENHI grant nos. JP16H03895, JP19H05462, JP19K14700, JP20H01893, and JP20K14454, the JSPS Core-to-Core Program "Data Driven Plasma Science," the Plasma Bio Consortium, and the Center for Low-temperature Plasma Sciences, Nagoya University.
Supplementary data (0.3 MB DOCX)