
Abstract
Two metal-induced lateral crystallization (MILC) methods are proposed as candidate techniques to enhance cell current in future ultra-high-density NAND-type 3D flash memory devices. The channel crystallinity differs depending on the MILC method. In a single MILC, the channel is composed of single-crystal Si, whereas in a regional MILC, the channel comprises multiple crystal grains that are larger than those of the conventional polycrystalline Si. Using transmission electron microscopy, the inhibiting factor of MILC was modeled to reveal that the two MILC approaches result in different cell current distributions that are related to their degree of crystallinity. A comparison of these two cell current distributions in a 3D flash memory with over 900 word-line stacks showed that the single MILC delivers a higher median cell current with outliers on the lower side. In contrast, the regional MILC delivers a lower median cell current without outliers on the lower side.
Export citation and abstract BibTeX RIS
1. Introduction
NAND-type 3D flash memory is used in various industries such as automotive equipment, cloud servers, and hyperscale data centers, and supports all social activities in our daily lives and work. In recent years, the volume of such data has increased explosively. Therefore, a high bit density and large memory capacity are required. To meet these requirements, an increasing number of word-line (WL) stacks is used each year, and this trend is expected to continue, approaching more than 1,000 WL stacks in the future. 1) Therefore, cell conductance degradation owing to the increasing number of WL stacks is a critical issue. State-of-the-art metal-induced lateral crystallization (MILC) techniques 2,3) are some of the most promising techniques in 3D flash memory with ultrahigh (>300) WL stacks; 4–6) this technique is called "single MILC" in this study. Meanwhile, "Regional MILC," a unique technique, is another MILC candidate. 7) In this study, single and regional MILC methods were compared, and the differences in the crystallinity of the channel and cell current distributions in 3D flash memory with over 900 WLs were examined.
2. Experimental methods
2.1. Crystal orientation analysis
The grain maps examined in this study were experimentally obtained using the Automated Crystal Orientation Mapping (ACOM) tool in transmission electron microscopy (TEM). 8) The ACOM-TEM analysis was performed on a sample thinned using a focused ion beam technique to evaluate the crystallinity of the Si channel in the memory hole. These maps were color-coded to represent individual crystal grains, with colored boundaries indicating grain boundaries.
2.2. Channel fabrication
2.2.1. Conventional polycrystalline Si channel
First, cell dielectric films were deposited in a memory hole (MH) and an amorphous Si (a-Si) layer was deposited on these films. After macaroni dielectric formation, 9,10) the a-Si layer was crystallized by annealing, as shown in Fig. 1(a).

Fig. 1. Process flows of (a) conventional poly-Si channel, (b) single MILC Si channel, and (c) regional MILC channel.
Download figure:
Standard image High-resolution image2.2.2. Single-MILC channel
A layer of NiSi2 was formed on top of the MH after a-Si layer deposition to form the channel. NiSi2 migrated downward through the a-Si layer 11–16) and a single-crystallized a-Si layer was obtained by annealing, as shown in Fig. 1(b). Annealing was performed at temperatures that promoted MILC reactions but suppressed solid-phase crystallization (SPC). This phenomenon is attributed to the fact that the lattice constant of NiSi2 is very close to that of single-crystal Si. 17–21)
2.2.3. Regional MILC channel
Ni was introduced into MH to form multiple NiSi2 nuclei in the a-Si channel. 22) The NiSi2 nuclei migrated through the a-Si layer both upward and downward upon annealing. Many single crystallizations occurred simultaneously, as shown in Fig. 1(c). Because each NiSi2 nucleus attains different crystallographic orientations, when the NiSi2 nuclei collide with each other, the nuclei stop at the collision point and single crystallization ceases. Therefore, grain boundaries are formed at the collision points in regional MILC, 23,24) and large grains of polycrystalline Si (poly-Si) are formed in MHs.
3. Results and discussion
3.1. Comparison of crystallinity
Figure 2 shows the grain maps obtained experimentally using ACOM-TEM. Figure 2(a) shows the grain map of the conventional poly-Si channel crystallized by annealing only; this figure panel shows many small grains of size less than 0.2 μm. Figure 2(b) shows the grain map of a single MILC channel. The entire channel in one MH was single-crystallized by NiSi2 nuclei that migrated through the channel from the top to the bottom of the memory hole. Figure 2(c) shows a grain map of the regional MILC channel. Many large crystals of size 0.2 μm or more are observed because many single crystallizations occur simultaneously from each NiSi2 nucleus in the MH.
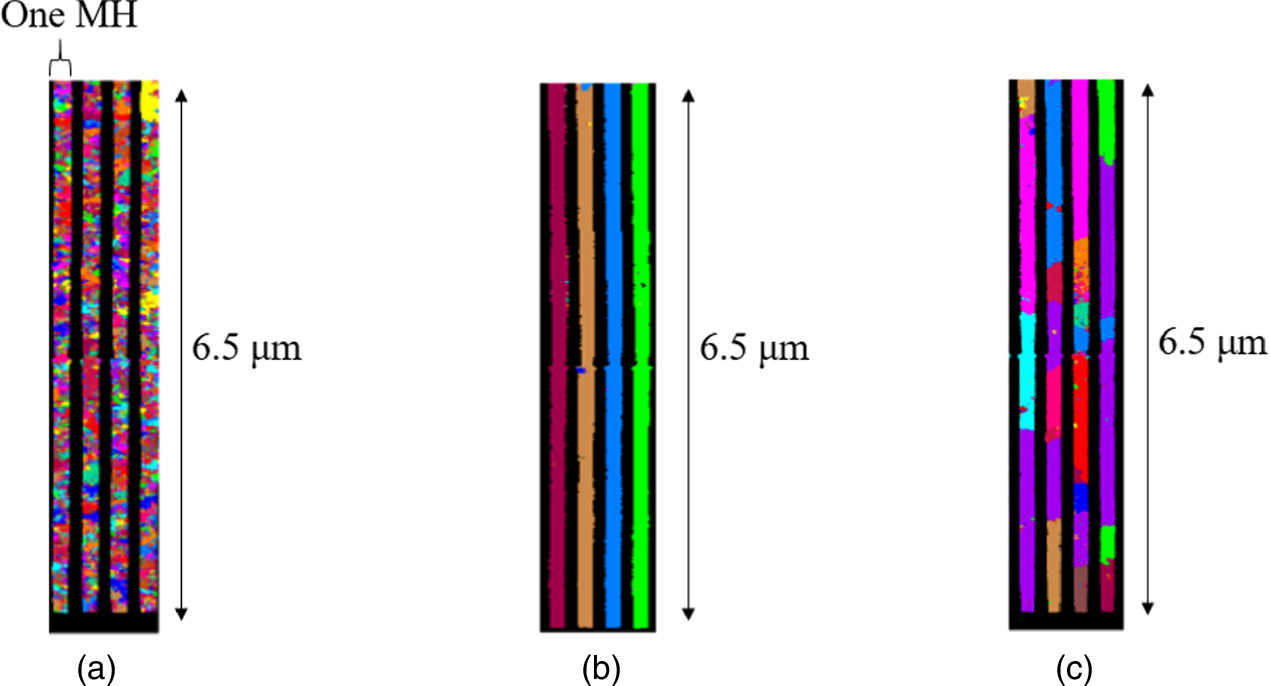
Fig. 2. Experimental grain maps of (a) conventional poly-Si channel, (b) single MILC Si channel, and (c) regional MILC channel.
Download figure:
Standard image High-resolution image3.2. Single-MILC modeling for statistical estimation
Ideally, the whole Si channel in the MH should be single crystallized by single-MILC methods, but in practice, a single MILC is obstructed by the SPC nuclei generated in the amorphous phase, as shown in Fig. 3. MILC ceases when the NiSi2 that migrates from the top of the MH encounters the SPC nuclei. Therefore, unintended SPC nuclei hinder MILC and act as "MILC stoppers." The entire region between the SPC nuclei and MH bottom is not single-crystallized; instead, it comprises various lengths of residual a-Si. To reveal the impact of the a-Si regions on the cell current distribution, the occurrence of residual a-Si regions was modeled based on the MILC stopper density, which is equivalent to the SPC density. The probability density of the residual a-Si length was calculated, as shown in Fig. 4, where H, L, s, and Cs are the MH height [μm], residual a-Si length [μm], average stopper density [pcs/μm], and normalization constant of a single MILC, respectively.
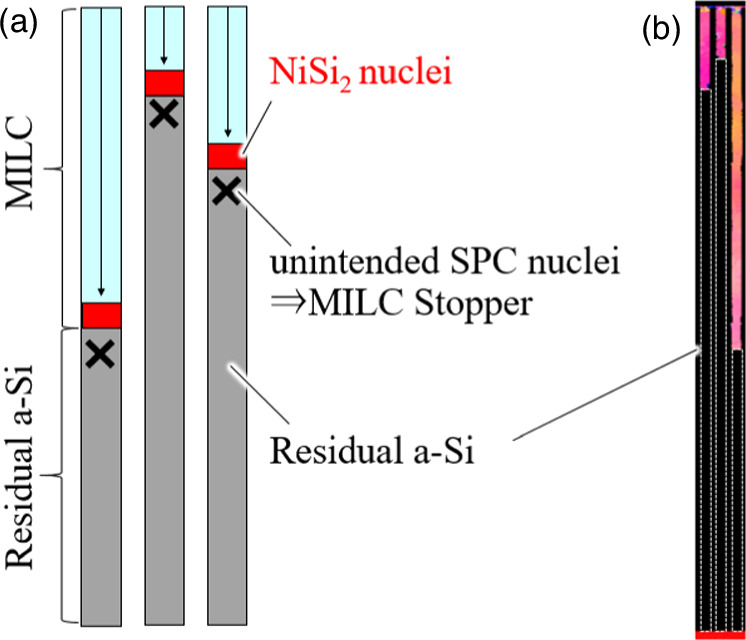
Fig. 3. (a) Single-MILC obstruction by SPC nuclei and (b) experimental grain map when MILC is hindered by SPC nuclei.
Download figure:
Standard image High-resolution image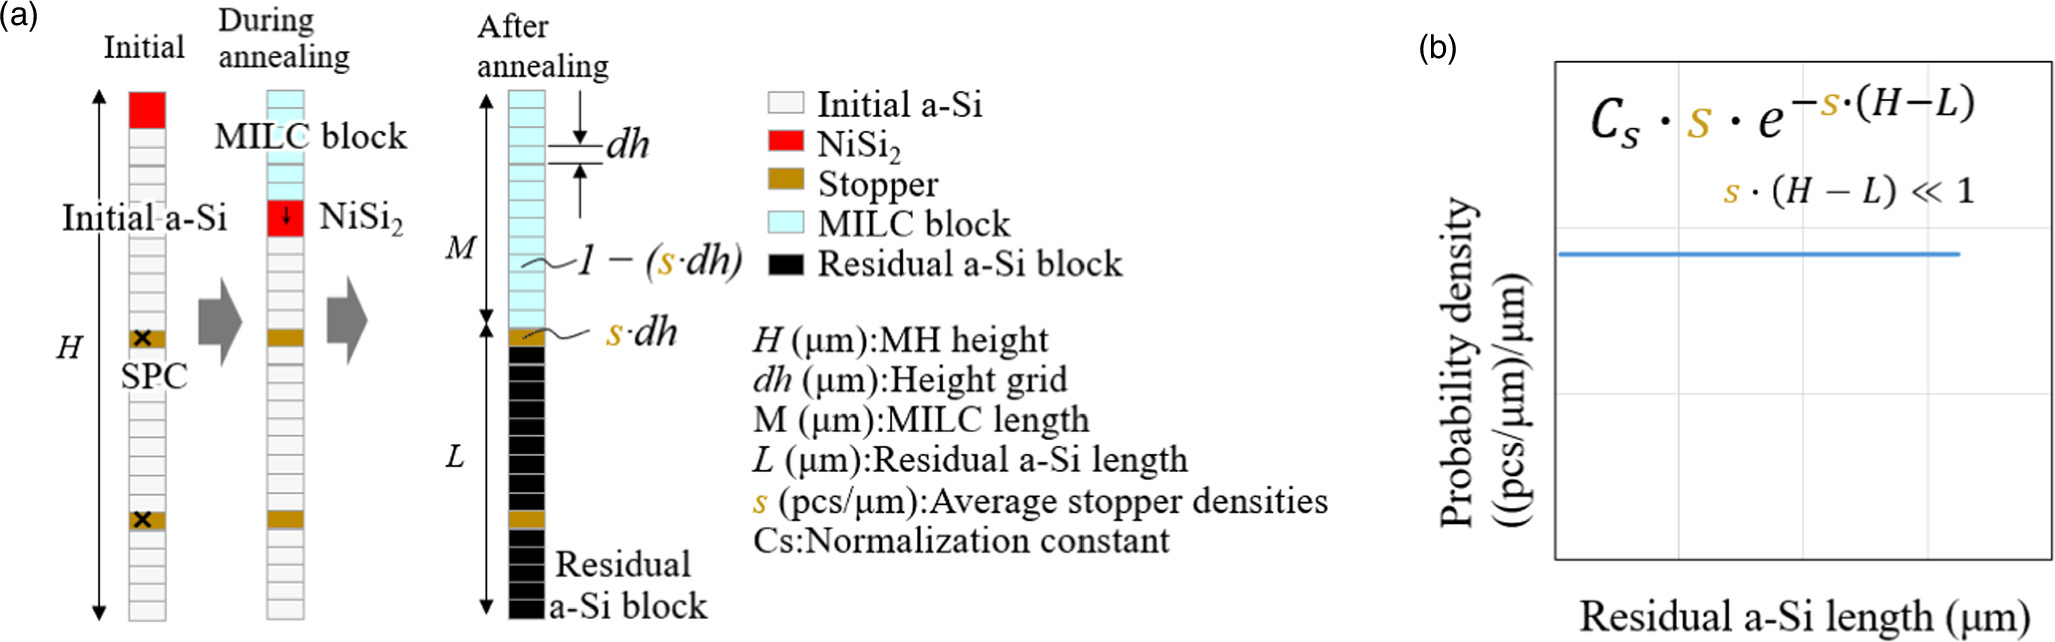
Fig. 4. (a) Residual a-Si formation model for a single MILC and (b) probability density of residual a-Si length.
Download figure:
Standard image High-resolution imageWhen the stoppers are randomly distributed along the MH height H [μm] with a mean density s [pcs/μm], the probability that no stopper exists along the MILC length M [μm] is expressed by Eq. (1).
Now, considering the limit at which H reaches infinity, Eq. (1) can be transformed as follows:
Equation (2) denotes the probability that there is no stopper at length M in an MH of any height, i.e., the probability that an MILC channel of length M exists. This formula is a common exponential function that is also used in yield calculations. 25–27)
Furthermore, by replacing M in Eq. (2) with (H − L), as shown in Fig. 4(a), the equation indicates the probability of the existence of residual a-Si of length L. Thus, the probability density of the residual a-Si length can be expressed as shown in Eq. (3) using Eq. (2), stopper density s, and normalization constant Cs .

If the stopper density is sufficiently low, the probability density of the residual a-Si length is constant in a single MILC, as shown in Fig. 4(b), because a-Si remains below the point where SPC is present.
Through the device fabrication process after MILC, the residual a-Si region was transformed into a high-resistance poly-Si region, 28) as shown in Fig. 5. Hence, the channel resistance is a series connection of the low-resistance MILC (RMILC) and high-resistance poly-Si (Rpoly-Si) which degrades the cell current of the 3D flash memory. Because the length of the residual poly-Si is directly correlated with the resistance, the product of the probability density and residual poly-Si length directly represents the impact on the cell current. Figure 6 shows the calculated result of the impact factor for the cell current (Icell). The impact factor for Icell is proportional to the poly-Si length because the probability density is independent of the poly-Si length. The resistance of poly-Si is proportional to its length.

Fig. 5. Experimental grain maps (a) after MILC and (b) after postprocessing. Residual a-Si is transformed into high-resistance poly-Si via post-thermal processing. (c) Equivalent circuit.
Download figure:
Standard image High-resolution image
Fig. 6. (a) Probability densities of residual poly-Si length, (b) resistance of poly-Si, and (c) impact factor for cell current (Icell) for a single MILC when the stopper (i.e., SPC nuclei) and NiSi2 for the MILC are randomly distributed.
Download figure:
Standard image High-resolution image3.3. Regional MILC modeling for statistical estimation
The regional MILC was also hindered by the SPC nuclei. Because the MILC occurs at multiple locations simultaneously, residual a-Si exists in regions where no NiSi2 nuclei exist between the SPC nuclei, as shown in Fig. 7. Therefore, in the case of regional MILC, it is necessary to consider not only the stopper density but also the NiSi2 density when calculating the probability density of the residual a-Si length. The probability density of the residual a-Si length was calculated, as shown in Fig. 8, where H, L, s, n, and Cr are the MH height [μm], residual a-Si length [μm], average stopper density [pcs/μm], average initial NiSi2 density [pcs/μm], and normalization constant of the regional MILC, respectively.
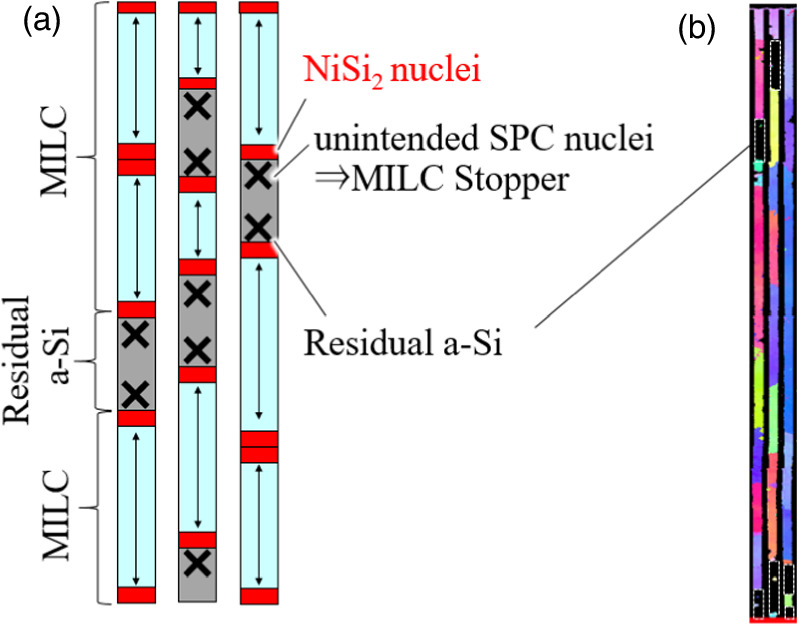
Fig. 7. (a) Regional MILC obstruction model with SPC generation and (b) experimental grain map for MILC obstructed by SPC.
Download figure:
Standard image High-resolution image
Fig. 8. (a) Residual a-Si formation model for regional MILC and (b) probability density of the residual a-Si length.
Download figure:
Standard image High-resolution imageWhen NiSi2 is randomly distributed in the MH with mean density n, the probability that no NiSi2 is present in length L is expressed as shown in Eq. (4) using unit length dL.

Considering the limit, where dL is zero, Eq. (4) can be transformed as follows:
Equation (5) indicates the probability of the absence of NiSi2 within a specific length L, i.e., the probability of residual a-Si of length L. Thus, the probability density of the residual a-Si length can be expressed as shown in Eq. (6) using Eq. (5), stopper density s, and normalization constant Cr.

If the NiSi2 density is sufficiently high, the probability density of the residual a-Si length steadily decreases in the regional MILC, as shown in Fig. 8(b). Residual a-Si is less likely to remain longer in regional MILC than in single MILC, resulting in shorter a-Si regions because regional MILC occurs at multiple locations simultaneously.
The calculated result of the impact factor for Icell is shown in Fig. 9. Long poly-Si with high resistance occurs less frequently in regional MILC; therefore, the major impact of the regional MILC process on the cell current is observed in short poly-Si regions with low resistance.
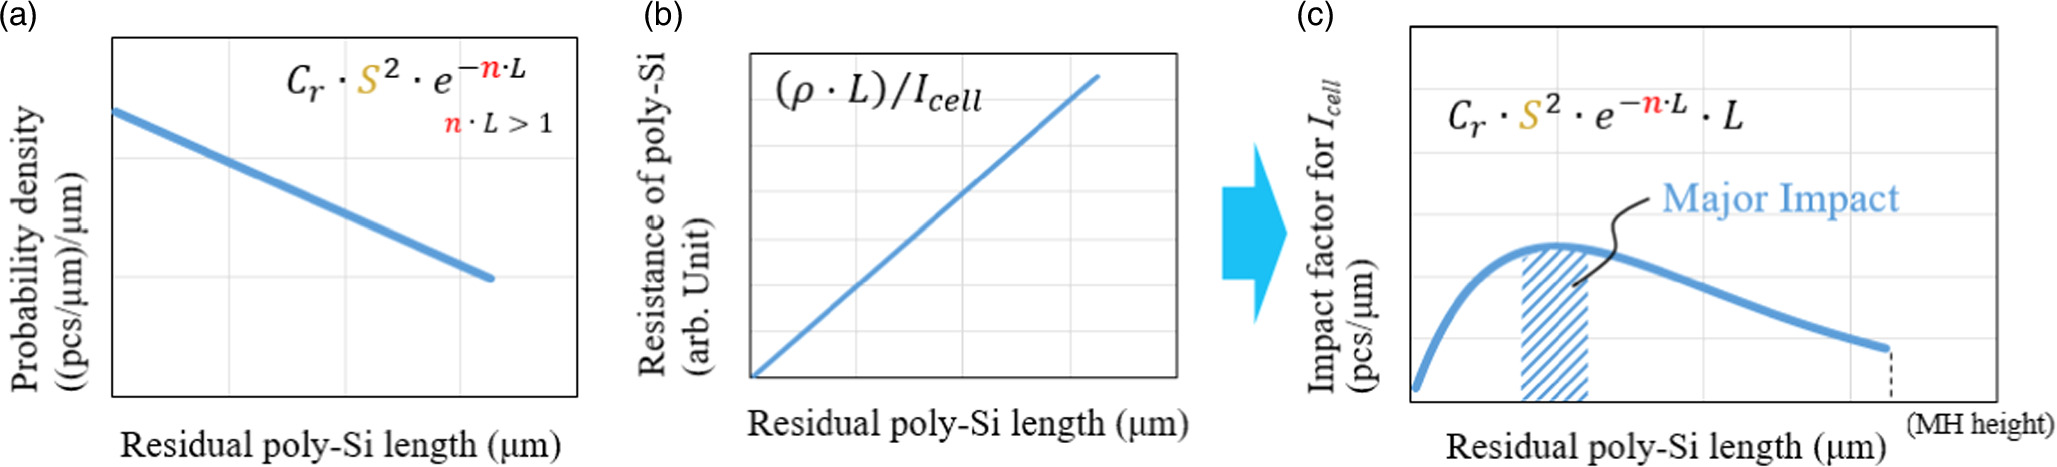
Fig. 9. (a) Probability densities of residual poly-Si length, (b) resistance of poly-Si, and (c) impact factor for Icell for regional MILC when stoppers and NiSi2 for MILC are randomly distributed.
Download figure:
Standard image High-resolution image3.4. Prediction of cell current distribution
The cell current distribution was calculated based on the simulated crystallinity and channel resistance. The MILC channel resistance and poly-Si region resistance were obtained from experimental data. As shown in Fig. 10, the crystal distribution maps of the single and regional MILC methods for 915 WLs and 2250 MHs were simulated using Eqs. (3) and (6), under the assumption that the stopper and NiSi2 are randomly distributed in an MH. In the figure, the black blocks indicate poly-Si with a higher resistance, which was obtained by the transformation of residual a-Si after thermal processing. The stopper density "s," which was fitted to the experimental data, was much higher in the case of the regional MILC than in the case of a single MILC. The experimentally obtained channel resistances for the single-MILC and poly-Si channels are shown in Fig. 11. To evaluate the cell-array characteristics, Ni metal was removed by gettering. 29–32) The Id –Vg acquired by driving all the WLs at the same voltage was considered to represent a quasi-MOSFET with a long channel. Using this approach, the channel resistance can be separated from the parasitic resistance. Clearly, the resistance of the single-MILC channel was approximately 10 times less than that of the poly-Si channel. The same method was used to measure the channel resistance of the regional MILC. The resistance of the regional MILC channel was approximately six times lower than that of the poly-Si channel.
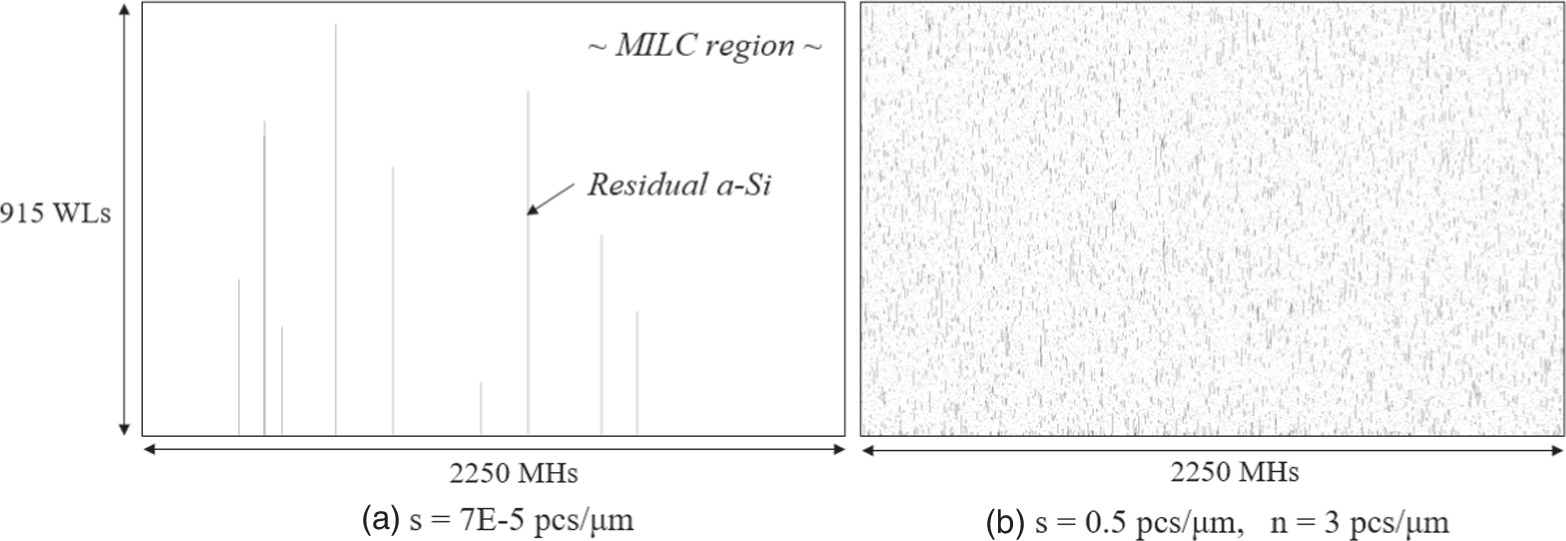
Fig. 10. Calculated residual a-Si distribution maps for 915 WL stacks and 2250 memory holes (MHs) for (a) single MILC and (b) regional MILC. White blocks indicate the MILC region and black blocks indicate the region of residual a-Si, which is transformed to high-resistance poly-Si after thermal processing.
Download figure:
Standard image High-resolution image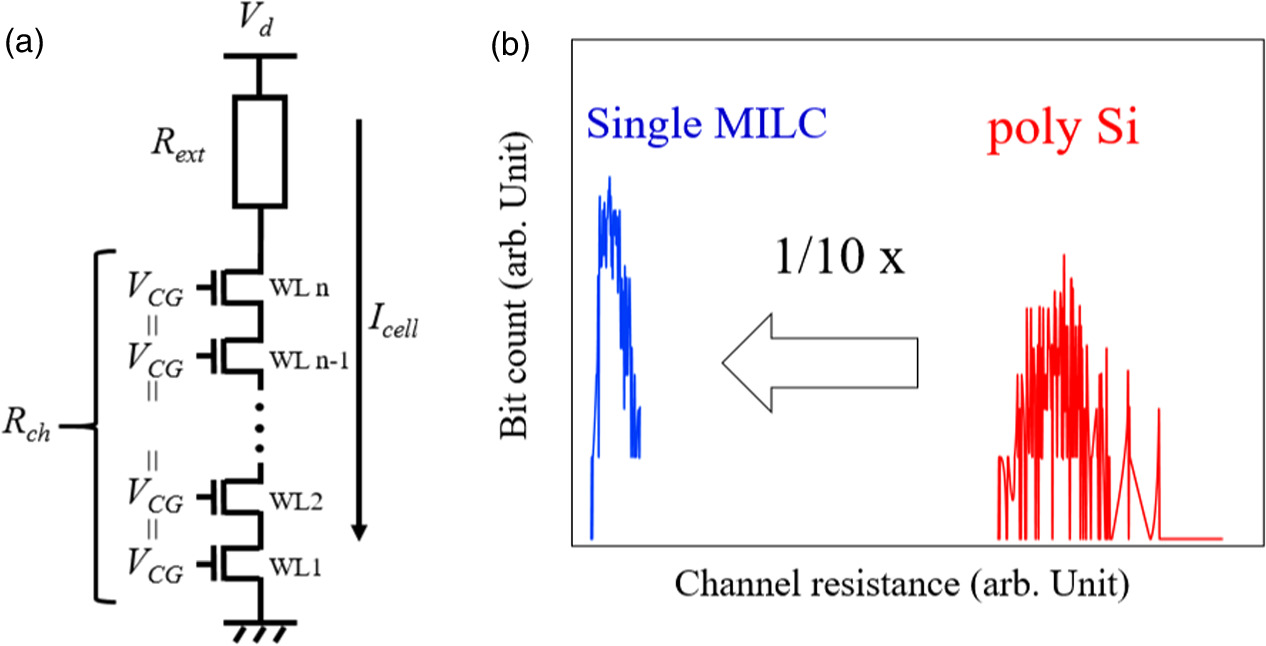
Fig. 11. (a) Equivalent circuit, wherein Rch and Rext correspond to the channel and external resistances, respectively, and (b) experimentally obtained channel resistances of the single-MILC and poly-Si channels.
Download figure:
Standard image High-resolution imageFigure 12 shows the results of the calculated cell current distributions for 915 WLs and 2250 MHs. A single MILC had a higher cell current (median) than a regional MILC; however, the former suffers from rapid degradation of the tail of the cell current distribution because of the long-residual a-Si region. The lower tails of the cell current distribution affect the bit error rate.

Fig. 12. Calculated cell current (Icell) distributions of (b) single MILC and (c) regional MILC with 915 WLs. (a) shows the equivalent circuit, wherein Rp, Rm, and Rext are the poly-Si, MILC, and external resistance, respectively. Single MILC suffers from rapid degradation of Icell (tail) because of the presence of long-residual a-Si regions.
Download figure:
Standard image High-resolution imageTherefore, SPC suppression techniques are required to prevent the formation of long-residual a-Si regions. In contrast, the cell current (median) in regional MILC is lower than that in single MILC; however, in regional MILC, rapid degradation does not occur in the lower tail. Therefore, the regional MILC is more robust against rapid cell current degradation due to the long-residual a-Si regions. The technology used to grow large Si grains is essential for improving the cell current (median).
Figure 13 shows the calculated cell current distribution expected for the single and regional MILCs after the improvement of crystallinity. In a single MILC, the lower tail of the cell current distribution was suppressed by reducing the stopper density. In contrast, in the regional MILC, the cell current (median) is improved by increasing the Si grain size.

Fig. 13. Calculated Icell distributions after process improvement for (a) single MILC and (b) regional MILC with 915 WLs.
Download figure:
Standard image High-resolution image
4. Conclusions
The differences in crystallinity and cell current distribution between the single and regional MILC methods were clarified by TEM studies and modeling. Both MILC methods achieved higher performance than the poly-Si channel. Single MILC resulted in a better median cell current, whereas regional MILC provided a better lower tail cell current for a 3D flash memory with more than 900 WL stacks. Therefore, SPC suppression is essential for preventing residual a-Si retention in single MILC. Meanwhile, technology to enlarge Si grains is necessary to improve the median cell current in regional MILC. Both single and regional MILC are promising candidate technologies for fabricating highly stacked 3D flash memory in the future.