


Abstract
It is well known that noise plays an important role in genetic regulatory networks. It can not only affect the overall characteristics of the genetic regulatory networks, but also produce unique functions through the organism organization. In this paper, we use the effect of stochastic resonance (SR) to study the influence of Lévy noise on genetic regulatory networks. The characteristic correlation time tCCT is used to explore the SR phenomenon. We simulate the concentrations changes of mRNAs and repressor-proteins under different parameters, indicating that noise can induce oscillations of mRNAs and repressor-proteins concentrations. We also present SR effects in dependence on the four different intrinsic parameters and Lévy noise intensities. Our results uncover that the trend of noise on the SR of mRNAs and repressor-proteins is similar. We can achieve simultaneously regulation and optimization of mRNAs and repressor-proteins in genetic regulatory through the SR mechanism. We discover that the stability parameter α has a parallel effect on the scale factor γ, and their increase within a certain range can promote the optimal coordination of SR. In addition, the location parameter δ and the skewness parameter β have great benefits for the resonance effect; their increase can suppress the optimal cooperation of SR. Hence, the stimulation of Lévy noise is crucial to gene expression in genetic regulatory networks. The obtained results can provide a viable path for further biological mechanisms.
Export citation and abstract BibTeX RIS
Introduction
Stochastic resonance (SR) was discovered by Benzi et al. [1], in the context of simulated earth climate conversion. SR exhibited counterintuitive and constructive noise effects. In recent years, SR has been studied extensively due to its potential applications in theory and experiment, and it has a profound impact on many scientific fields, such as chemistry, physics, biology etc. [2]. In particular, it plays a significant role in biology, e.g., it happens in excitable systems, information-transfer, neuronal networks, underdamped periodic potential systems, or bone loss [3–9].
Genetic regulatory networks (GRNS) refer to a network system developed by the interaction between genes and other genes (or within a given genome). Gene expression can be regarded as a stochastic process [10,11]. As McAdams et al. [12] point out, the gene expression process is "It's a noisy business". This "noise" has both internal roots, that is, fluctuations in the chemical reactions from the transcription and translation processes of the genes themselves; there are also external causes, which are caused by fluctuations in the concentration or state of other components in the cell [13]. Stochastic fluctuations are natural phenomena of biochemical reactions that may induce the occurrence of stochastic resonance, so we should consider the role of noises when genes interact in a cell. Many studies illustrate that noise is a key impact factor in genetic regulatory networks [14,15]. The SR phenomenon has been found in genetic transcriptional regulatory networks under the influence of multiplicative and additive noise [16,17]. Chalancon et al. discussed the interaction between expression noise and genetic regulatory networks at different organizational levels [18]. The study on genetic regulatory networks fluctuations was extended to Gaussian colored noise [19]. Hasty et al. showed how noise affects and regulates gene expression [20]. Noise can cause oscillations in small RNA genetic networks [21] and channel noise can affect neural dynamics at the circuit level [22]. Effects of positive and negative feedback loops on the role of noise in genetic regulatory networks were investigated in [23]. Recently, models for genetic networks incorporating noise have become more abundant. Therefore, it is of great significance to study the role of noise in gene expression in genetic regulatory networks.
Gaussian noise has been extensively studied in genetic regulatory networks. Wang studied the effect of Gaussian noise on the genetic oscillations of the synthetic gene network [24]. However, Gaussian noise is only a limitation of an ideal situation of fluctuations and is a special case of Lévy noise [25]. As we know that molecular motion in a cell is random walk [26–30], and Lévy process describe the continuous-time analog of a random walk [30]. Lévy noise has the characteristics of a long heavy tail and large unpredictable jumps [31–33]. Lots of biological experiments have shown that the production of mRNA and protein occur in an unpredictable, sudden, intermittent mode [34–36]. This similar event leads to a high pulse pattern of gene expression, followed by long periods of inactivity showing a heavy tail distribution. Theoretically, features similar to the above seem to be more appropriate to describe with non-Gaussian Lévy motion. For example, Zheng analyzed the dynamic effect of noise fluctuation on the evolution of transcription factor activator concentration, suggesting Lévy noise is more powerful in describing general realistic fluctuations [37]. So we use non-Gaussian Lévy noise instead of Gaussian white noise. And also some scholars pay more attention to genetic regulatory networks under Lévy noise. Lévy noise influenced the concentration of transcription factor activators in a synthetic genetic regulatory network [38]. Wu et al. studied the logical information transmission of a synthetic genetic network under Lévy noise [39]. Through the above discussion, we know that the impact of noise on genetic regulatory networks is meaningful, and its related properties and mechanisms are gradually being discovered.
When the genetic regulatory network exhibits oscillatory kinetics in a stochastic region, SR can provide a physical mechanism whereby intracellular noise plays a positive role in establishing oscillatory behavior and optimizing the model parameters (rate coefficients and noise intensity, etc.), resulting in the optimal cooperativity between genes interact [40,41]. Thus, we aim to study a genetic regulatory network driven by Lévy noise, and characterize the corresponding SR phenomenon by using the characteristic correlation time (CCT) in this paper. We will study the changes in protein and mRNA concentrations corresponding to different parameters. Our discussions mainly focus on the variation of the CCT with four intrinsic parameters of Lévy noise and noise intensity D. Through numerical simulations, we analyze the SR effects of various parameters and deeply investigate the influence of Lévy noise on gene expression in genetic regulatory networks. Hence, we find a mechanism to regulate the parameters, which is helpful to achieve optimal gene expression through proper adjustment.
In our work, firstly, we present the mathematical models related to gene regulatory networks and some related properties of Lévy noise. Secondly, we introduce the numerical simulation method. Lastly, we analyze and study how the parameters of the Lévy noise in the genetic regulatory network affect SR.
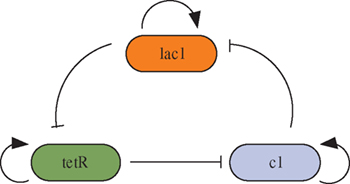
Fig. 1: The loop is composed of three repressor genes, one of which suppresses a specific promoter and regulates the gene expression.
Download figure:
Standard imageModel
Here we consider a synthetic genetic regulatory network involving three transcriptional repression systems [42]. The inhibitor is a cyclic negative feedback loop containing three repressor genes (lacl, tetR, and cl) and its promoter in fig. 1. The mathematical model of the system is represented by six coupled first-order differential equation as follows:

where mi and pi ( ) represent the concentrations of the three mRNAs and repressor-proteins. b denotes the feedback regulation coefficient; c > 0 indicates the ratio of the protein decay rate to the mRNA decay rate; The degree of polymerization n represents the binding strength of the protein to the transcription site. The system incorporates Lévy noise
  ,
,  from environmental disturbances which follow the Lévy process distribution, where these noises are independent of each other. The following equation describes its characteristic function [43,44]:
For 

and for  ,
,

We obtain the probability density function through the inverse Fourier transform of  as follows:

where ![$\alpha\in(0,2]$](https://content.cld.iop.org/journals/0295-5075/127/5/50003/revision1/epl19815ieqn7.gif) is the stability parameter, indicating the asymptotic behavior of the Lévy process distribution;
is the stability parameter, indicating the asymptotic behavior of the Lévy process distribution;  is used to represent the skewness parameter of the asymmetry of Lévy noise; the parameter
  is a scale factor which represents the degree of concentration of the distribution;
  is a location parameter representing the position of the probability density function and
  is the noise intensity.
It is well known that the stable distribution means that the combination of two independent stochastic variables has the same distribution in probability theory, which is known as Lévy α-stable distribution. Hence the Gaussian, Cauchy, and Lévy distribution can be regarded as stable distributions. We plot the sample trajectory of stable distribution in fig. 2. For Lévy random number, as the noise intensity increases, the noise amplitude increases and the peak characteristics become more obvious; The random number change under Gaussian distribution is stable; However, the variation random number of the Cauchy distribution is larger. Figure 3 shows the probability density function of Lévy noise. We see that with the increase of α, the probability density distribution curve is lower and fatter, the tail is smaller, and more close to the horizontal axis. when  , the scale factor
  has a similar trend with α [41]. From fig. 3(c), we see that if
  , the distribution curve goes to the right, and with β decreases, its peak shifts from the right to the left. This is the opposite of fig. 3(d). When
  , the curve is horizontally symmetrical. Therefore, the SR problem of the genetic regulatory network under a Lévy process explored develops to the more general noise distribution and is not limited to diversity-induced resonance [45].
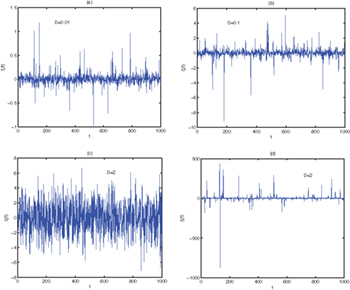
Fig. 2: The trajectory of the  . (a), (b):
  ,
,  ,
,  . (c) Gaussian distribution:
  ,
,  ,
,  ; (d) Cauchy distribution:
  ,
,  ,
,  .
.
Download figure:
Standard image
Fig. 3: Probability density function of stable distribution noises. (a) Varying α when  ,
,  ,
,  ; (b) varying γ when
  ,
,  ,
,  ; (c) varying β when
  ,
,  ,
,  ; (d) varying β when
  ,
,  ,
,  .
.
Download figure:
Standard imageNumerical simulation method
In this section, we introduce the simulation method in this paper. Since Lévy noise is added to the synthetic genetic regulatory network, we combine the Chambers-Mallows-Stuck (CMS) algorithm [46] and the Euler algorithm to simulate six coupled first-order differential equations. The random variable ξ of Lévy noise is generated by CMS method, when 

the random variables V and W follow Normal distribution  and exponential distribution e(1) respectively, which are independent of each other. Here,


when 

we simulate (1) by using the following discrete form [47]:

where  ; F represents the right side of eq. (1);
  .
.
In order to quantify the system to Lévy noise and represent the effective signal-to-noise ratio (SNR), we adopt the characteristic correlation time (CCT) [48]

where  is defined as the normalized autocorrelation function

and

Main results
In this section, we will use eqs. (9)–(12) to simulate the tCCT function vs. noise parameters. The presence of a maximum in the characteristic correlation time tCCT will indicate the occurrence of SR in system (1). In the following, we take the parameters as  , c = 1, n = 2 [44].
We analyze the effects of Lévy noise on the genetic regulatory network. The dynamic concentrations of the three mRNAs and repressor-proteins for different noise intensities are depicted in fig. 4. We find that noise can induce oscillations of the mRNAs and repressor-proteins. When D = 0, the concentration gradually approaches a certain stable value. When a positive noise intensity is added to the genetic regulatory network, the steady state becomes disintegrated and begins to oscillate. As the noise intensity D increases, the concentration oscillations of mi and pi become stronger. At  , the curve has a weak oscillation. When D is 0.02 and 0.05, the oscillation amplitude jumps. Statistically or in the concentration sense, the biologically relevant state is a stable steady state. However, as an individual gene, its expression is transient [49–51], so it can show the oscillatory behaviors. However, if these random spiking satisfies the optimal condition of CCT, this implies that there is inner harmony in the process of random spiking. So the optimal condition corresponds to SR. Hence noise -induced random spiking can be considered as SR.
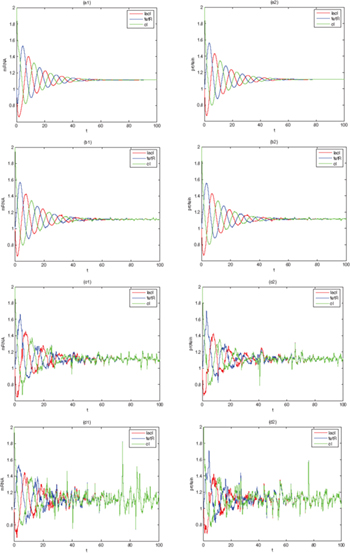
Fig. 4: The mRNAs and repressor-proteins concentrations for system (1) with different noise intensities.  ,
,  ,
,  . (a) D = 0; (b)
  ; (c)
; (c)  ; (d)
; (d)  .
.
Download figure:
Standard imageThe tCCT of the mRNA and the repressor-protein is shown as a function of the noise intensity under different noise parameters in fig. 5 [52]. Since the three mRNAs and repressor proteins are symmetrical, only the map corresponding to lacl mRNA and its repressor is shown here. The trend toward the tCCT of the mRNA and repressor-protein is very similar, i.e., the trend of the SR mechanism is similar. Therefore, a simultaneous regulation optimization of the mRNA and the repressor protein can be attained by the SR mechanism.

Fig. 5: The characteristic correlation time tCCT as a function of D of the genetic regulatory network model (1). Panels (a1), (b1), (c1) and (d1) represent tCCT of the mRNA, the rest represent the tCCT of the protein. (a1), (a2): tCCT for different α when  ,
,  ; (b1), (b2): tCCT for different γ and when
  ,
,  ; (c1), (c2): tCCT for different β when
  ,
,  ; (d1), (d2): tCCT for different δ when
  ,
,  .
.
Download figure:
Standard imageThe role of Lévy noise on the characteristic correlation time tCCT under different stability parameters α is shown in figs. 5 (a1) and (a2). As D increases, tCCT begins to increase, reaches a maximum and then decreases under different α. Hence, it is obvious that the SR phenomenon occurs. As α increases, the peak shifts to the right and increases. This is because for smaller α, the noise is more unstable and SR is suppressed. From figs. 5 (b1) and (b2), we find that the scale factor γ and the stability parameter α have similar effects on SR under Lévy noise intensity. It is observed that a resonance occurs as D increases. We uncover the resonance effect by changing D under different γ. Especially when γ is increased, selecting a larger D will result in a more pronounced SR behavior.
The Lévy noise asymmetry causes special fluctuations in the genetic regulatory network. In figs. 5 (c1) and (c2), we plot tCCT vs. D for different skewness parameters β. As β increases, the asymmetry of the noise becomes stronger, and the peak shifts to the right and decreases, so that the fluctuation increases. When β is larger, a larger D can lead to a more pronounced resonance behavior. Figures 5 (d1) and (d2) plot the effect of Lévy noise for different δ. This has a similar trend with different β. As δ increases within a certain range, the maximum value of tCCT decreases and moves to the right. When δ is smaller, choosing a smaller D will lead to a stronger SR effect.
The curve of tCCT with the stability parameter α, the location parameter δ, and the scale factor γ is shown in fig. 6. SR still has a similar mechanism for the tCCT of the mRNA and the repressor-protein. Figures 6(a1) and (a2) plot the tCCT versus δ for different α. There is obviously a resonance behavior in different δ under a certain α. The peak increases when α goes up. It can be seen from figs. 6(b1) and (b2) that γ plays a similar role as α, which was also studied in [45,53].
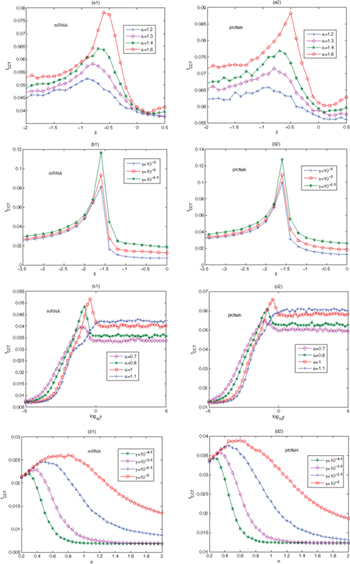
Fig. 6: The characteristic correlation time tCCT as a function of Lévy noise parameters of the genetic regulatory network model (1). Panels (a1), (b1), (c1) and (d1) represent tCCT of mRNA, the rest represent the tCCT of the protein. (a1), (a2): tCCT as a function of δ for different α when  ,
,  ; (b1), (b2): tCCT as a function of δ for different γ when
  ,
,  ; (c1), (c2): tCCT as a function of γ for different α when
  ,
,  ; (d1), (d2): tCCT as a function of α for different γ and when
  ,
,  .
.
Download figure:
Standard imageNext, tCCT of the global variable as the function of γ for different α is shown in figs. 6(c1) and (c2), where we can observe the resonance effect by changing γ. As γ increases, a larger α will produce a better SR behavior of the genetic regulatory network. In particular, the tCCT maximum is reached for  . When
  , the curve increases monotonically and finally reaches a saturation, i.e., there is no SR. The effect of the varied γ of the Lévy noise on tCCT has a similar mechanism as shown in figs. 6(d1) and (d2). As α further increases, there is a resonance behavior in different γ; the peak of tCCT increases and shifts to the right, and it can be seen that a too large or a too small γ and α do not cause SR. Therefore, choosing a proper γ and increasing α is one way to maximize the SR behavior.
We plot the tCCT curve with the variation of δ and β in fig. 7. It is obvious that the optimal parameters can lead to the occurrence of SR. The tCCT curve has similar trends for the mRNA and the repressor-protein under β and δ. We see from figs. 7(a) and (b) that when  , as β increases, the tCCT peak appears and moves slightly from the right to the left. More importantly, a smaller γ will induce a better resonance effect on the system. When
  , as β increases, the peak shifts to the right and decreases in figs. 7(c) and (d), and a larger γ will induce a better resonance effect on the system. This suggests that a slow decreasing of β can promote cooperation of SR. In summary, the adjustment among these parameters plays a significant role in improving the efficiency of SR.
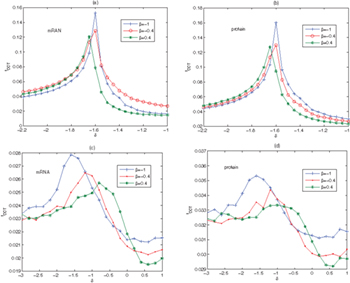
Fig. 7: The characteristic correlation time tCCT as a function of δ under different β of the genetic regulatory network model (1). (a), (b):  ,
,  ; (c), (d):
  ,
,  .
.
Download figure:
Standard imageConclusion and discussions
In this paper, we have studied the effects of Lévy noise on genetic regulatory networks involving in mRNAs and repressor-proteins. This system reveals a richer behavior than systems driven by white Gaussian noise only (we also verified it with the Gillespie algorithm). In addition, we used the characteristic correlation time tCCT to quantify the SR effect. It is shown that the SR effect can also be induced by Lévy noise.
Through numerical simulations, we conclude that the Lévy noise intensity can induce oscillations of the mRNA and the repressor-protein at an appropriate value. We have further studied the SR phenomenon of the mRNA and the repressor-protein by varying the noise parameters and found that these parameters have synchronized the optimization of the SR mechanism. The stability parameter α has a parallel SR effect on the scale factor γ. Their increase within a certain range can improve the maximum of the tCCT and promote the optimal cooperation mechanism of SR. The increase of the location parameter δ and the skewness parameter β within a specific range reduces the maximum value of tCCT. In particular, when  , as β decreases, a smaller δ and a larger γ will lead to a better resonance. This is opposite when
  . In summary, we can achieve a good effect on the concentration of mRNA and repressor-protein by appropriately adjusting the parameters of noise and noise intensity D.
In conclusion, the SR effect induced by Lévy noise is observed in the genetic regulatory network system. In biological systems, noise refers to variability at the level of gene expression. On the one hand, Lévy noise is more powerful in describing general realistic fluctuations, and its role is to compensate for the inherent nonlinear processes produced by spikes; on the other hand, for the biological sciences, SR is usually not considered as a specific defined phenomenon of a limited range, but is based on the broad idea of "noise benefits". Therefore, we can use the SR mechanism to simultaneously optimize the concentration of mRNAs and repressor-proteins. The results presented above are conducive to the optimization of genetic networks, and it is expected that synthetic genetic regulatory networks can work more harmoniously in the face of inherent fluctuations. This may provide a viable path for other biological mechanisms.
Acknowledgments
This work is supported by the National Natural Science Foundation of China (11772291, 11572278, 61573102) and the Natural Science Foundation of Jiangsu Province of China (BK201700190).