


Abstract
The required experimental E-field across plasma to generate significant runaway electrons and hard X-rays during the pinch phase and the phase with anomalous resistance has been investigated in a dense plasma focus. The plasma voltage and inductance have been measured in a plasma focus with two different anode tip structures. The results show a significant generation of charged particles and hard X-rays at smaller E-field across the plasma column in the phase of anomalous resistances compared to the pinch phase. Plasma heating process may enhance the rate of runaway-charged-particle generation due to the combined effects of a reduced Dreicer field and the avalanche effects during the phase of anomalous resistance.
Export citation and abstract BibTeX RIS
Introduction
In a plasma focus device magnetohydrodynamic (MHD) instabilities in a plasma sheath prevent the proper formation of the pinching plasma at the end of the compression phase. The occurrence of MHD instabilities during the compression phase may be prevented by a) a proper transition from the axial to the radial phase, b) uniform and symmetric formation of a plasma sheath, and c) reduction of the impurity transport into the plasma sheath [1–4].
The plasma pinch may be influenced by anode tip structures, such as tip curvature or the structure (solid or hollow tips, for example) [5]. The effects of the anode tip structure on the formation of a stable pinching plasma column, charged-particle beam emissions, neutron generation and soft X-ray radiations, have been reported [6,7].
During the pinch phase, the plasma resistance is negligibly small and the plasma circuit is highly inductive. The anomalous resistance in the post-pinch phase is often attributed to micro-instabilities and turbulences provoked by ion acoustic and low hybrid instabilities (LHI) [8].
The previously reported results showed multiple radiation peaks of ion beams [9,10] and X-ray signals [11], presumably caused by anomalous resistance during the final stage of plasma focus. The common features of the charged-particle beam and X-ray emission have been analysed quantitatively based on the voltage across the plasma column during the pinch phase [12]. The analyses have shown that plasma resistance may reach  during the phase with anomalous resistances and the minimum anode voltage to generate hard X-rays in this phase is about 13 kV [12]. Single and multiple peaks of an electron beam that are highly correlated with the radiated X-rays and anode voltage have been studied [13].
This article will report on the studies of the time evolution of plasma voltage and impedance to get an insight into plasma compression at different stages of focusing [14–19]. Solid and hollow anode tip structures have been chosen for comparison studies. The generation of runaway electrons and ion beams during the pinch and the post-pinch phase with anomalous resistances has been investigated and related to the Dreicer theory [20]. The results show a smaller amplitude of the experimental E-field across the plasma column in the phase of anomalous resistances compared to the pinch phase for the generation of significant charged particles and hard X-rays. The plasma heating process may be attributed to a decrease in the Dreicer field and to an increase in the rate of the runaway-charged-particle generation in plasma during the phase of anomalous resistance.
Experimental setup and results
The experiment has been carried out using a low-energy Mather-type plasma focus device with a total stored energy up to 2 kJ. The diagnostics tools include a hard X-ray detector and a four-channel diode X-ray spectrometer (DXS), both measuring the X-ray radiation generated by interactions between the runaway electrons and the copper anode or the dense plasma. A Faraday cup working in the secondary electron emission (SEE) mode has been used to detect an ion beam generated from pinching plasma. The electron beam is detected by a Rogowski coil located 50 cm away from the pinch region. A high-voltage probe with a rise time of about 2 ns is used to measure the anode voltage. The working gas is argon [9–13]. The solid anode is 2 cm in diameter with a flat top of 1 cm in diameter at the center and a rounded edge. The hollow anode tip is modified from the solid tip with a hole with a diameter of 1 cm at the centre.
Figure 1 shows the waveforms of the discharge current and anode voltage for both hollow and solid anodes with a typical bank voltage of 15 kV and a gas pressure of 0.5 mbar. The current waveform for the hollow anode tip shows one sharp drop, corresponding to the pinch phase, followed by a gradual decrease. The duration of the current drop and anode voltage peak in the hollow anode case is about 200 ns. When the plasma focus shows a strong focusing effect that occurs at low operating pressures (0.2–0.8 mbar), the anode voltage has a peak up to 35 kV, composed of three sub-peaks, marked 1, 2 and 3 in fig. 1(a). In the solid anode case, shown in fig. 1(b), the anode voltage waveform has three peaks within the 500 ns interval and has a peak up to 20 kV [9–12].
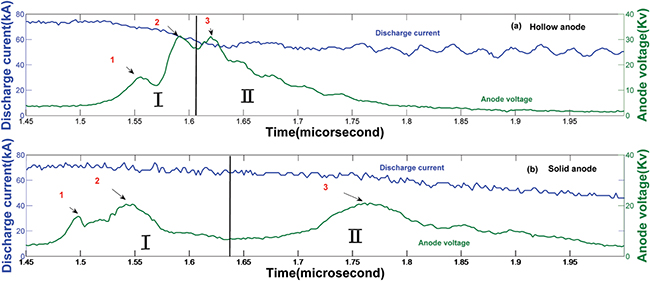
Fig. 1: (Colour online) Anode voltage and discharge current signals (charging voltage of 15 kV and argon gas pressure of 0.5 mbar) for hollow and solid anode tip structures.
Download figure:
Standard imageFigure 2(a) shows a significant generation of electron beams in the hollow anode case even when the anode voltage has decreased significantly. The electron beam signal shows a fast rise time of about 20 ns and a long decay time of about 300 ns similar to the decay time of the third peak of the anode voltage signal. The X-ray signals gathered from two of the DXS channels are shown in fig. 2(b). It should be noted that the PIN-1 diode is masked with a copper filter and allows transmission of X-rays in the range 4–9 keV. This channel with the Cu filter has the highest sensitivity in the energy range that includes both Cu-kα and Cu-kβ lines. The PIN-2 diode is covered by a cobalt filter and provides a transmission window of the X-ray energy in the range 4–7.7 keV. The cobalt filter absorbs the Cu-kα line and detects mainly the Cu-kβ line. Therefore, by comparing the signals from the two channels, the contributions of Cu-kα and Cu-kβ lines in the X-ray emission can be estimated [11,13].
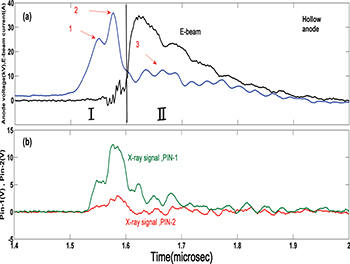
Fig. 2: (Colour online) Electron beam and X-ray signals along with plasma voltage (charging voltage of 15 kV and argon gas pressure of 0.5 mbar).
Download figure:
Standard imageFigure 3 shows two peaks in the ion beam signal with the same rise time of about 200 ns corresponding to two main peaks in the anode voltage signal for the case with solid anode. The amplitude of the last ion beam signal peak is the same as that of the first peak. In contrast, the amplitude of the last anode voltage peak (the peak marked 3) is much smaller than that of the first main peak (composed of the peaks 1 and 2). Figure 4 shows a typical hard X-ray  signal in the solid anode case with two main peaks correlated to the main peaks of the anode voltage signal. The hard X-ray signal corresponding to the first peak shows a rise time of about 30 ns and the hard X-ray signal corresponding to the second peak shows a rise time of about 15 ns. The second hard X-ray peak shows a higher amplitude compared to the first one, while the anode voltage shows two peaks with approximately the same amplitude. Figure 4 also shows a delay time of 30 ns between the start of the hard X-ray signals and the corresponding anode voltage peaks.

Fig. 3: (Colour online) Anode voltage signal and current trace along with ion beam signal for solid anode tip structure (charging voltage of 15 kV and operating argon gas pressure of 0.5 mbar.
Download figure:
Standard image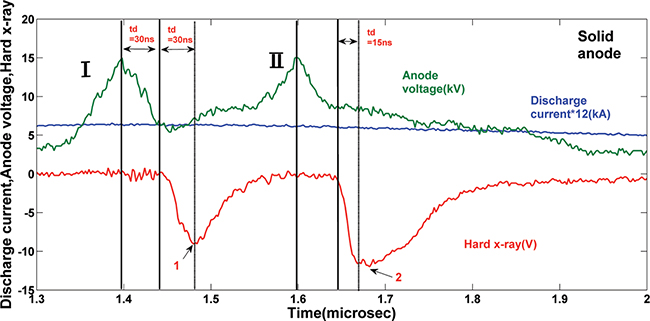
Fig. 4: (Colour online) Anode voltage signal and current trace along with hard X-ray signal for solid anode tip structure (charging voltage of 15 kV and operating argon gas pressure of 0.5 mbar).
Download figure:
Standard imageCircuit analyses and discussion
The plasma dynamics was investigated previously by Bruzzone et al. and Barbaglia et al. [14–19]. From the experimentally measured anode voltage  and the discharge current, I(t), the voltage across the plasma column during the radial implosion phase can be derived based on the following equation:

where  is the tube inductance from the anode voltage probe to the tip of the discharge electrodes (about 40 nH) [12]. The evolution of the plasma inductance can be calculated by integrating eq. (1) [15–20]:

where  is the start time of the compression phase. The change in the plasma inductance
  , as a parameter in this article, is plotted in fig. 5.

Fig. 5: (Colour online) Change in the plasma inductance  in solid and hollow anodes during the compression phase (charging voltage of 15 kV and argon gas pressure of 0.5 mbar).
Download figure:
Standard imageIt is important to note that the anode voltage starts to increase significantly at the times  and
and  in solid and hollow anodes, respectively. The first and second peaks in the anode voltage are related to compression and elongation of the plasma column. The duration of the compression phase is about 100 ns, as is usually seen in a low-energy device [21–27]. It has been often assumed that the plasma resistance during the phase of compression and elongation of the plasma column, corresponding to the first and second peaks in the anode voltage, is negligibly small. The plasma inductance, derived from eq. (1) and eq. (2) based on this assumption, is shown in fig. 5 for both the solid and hollow anodes during the first and second peaks of the anode voltage. The change in the plasma inductance
  reaches up to 10 nH at the first anode voltage peak for the solid anode case and up to 25 nH for hollow anode. A higher value in
  at the first voltage peak in the hollow anode case suggests a stronger compression or a longer length of the plasma column in the hollow anode tip case compared to the solid anode case.
It is interesting to compare the runaway electrons produced in the plasma focus with those in tokamaks by primary (Dreicer theory) and secondary (avalanche theory) runaway-electron production [28] using the rate equation  , where
  is the density of runaway electrons, and SD and Sa are the density production rates for primary and secondary runaway electrons. The primary rate reads
  , where
  is the collision frequency of the thermal electrons,
  the ratio of the electric field E along the magnetic field to the critical electric field
  , and
, and  the electron density [29]. The secondary rate reads
  , where
  . It has been reported by Granetz et al. that the generation of hard X-rays in a tokamak has observed when
  is on the order of
  and
and  [30].
[30].
In our pinch device, the characteristic time for an avalanche is about  assuming that E, along the helical magnetic field, is about 1 kV/cm [31]. By considering the minimum experimental E-field for hard X-ray generation, the primary and secondary runaway density in argon plasma are about
  ,
,  , respectively. The solution can be expressed by
  , where t is in the unit of ns. The ratio of the rates is
  . It is interesting to note that
  when
when  when
when  and the estimated ratio
  , consistent with that observed in tokamaks even though the two kinds of devices are operated in vastly different time scales.
Even though the secondary electron production starts to dominate over the primary electron one after a short time on the order of 1 ns in the plasma focus, the Dreicer field still has to be considered to produce initial seeding runaway electrons to cause an avalanche. The Dreicer field across the plasma is about 40 kV/cm for a plasma with a density of  and a temperature of 1 keV during the maximum compression of the plasma [12]. A significant radiation of hard X-rays in a solid anode has been observed when the plasma voltage is within the range from 18 to 32 kV [12]. The first anode voltage corresponding to the first hard X-ray radiation peak reaches 15 kV, approaching the minimum anode voltage required for significant hard X-ray radiation [12]. The corresponding plasma voltage derived is 18 kV according to eq. (1). Based on the geometry of the electrode (anode radius of 1 cm and cathode radius of 3 cm) and from the calculated plasma inductance in fig. 5 for the solid anode case, the length of the plasma column is 0.7 cm at the time when the plasma reaches the center of anode (i.e. the first peak in fig. 4). Therefore, the electric field across the plasma column in the solid anode case corresponding to the first period of the hard X-ray radiation ranges from about 25 kV/cm to 45 kV/cm.
The elongation speed of the plasma column after the plasma reaches the center of the anode is about  [22,24], suggesting that the actual length of the plasma column would be more than 2 cm in the solid anode case during the second peak of the hard X-ray radiation in fig. 5, corresponding to a total electric field across the plasma column less than 10 kV/cm. It is important to note that the radiation of hard X-rays has not been observed when the total electric field across plasma is lower than 25 kV/cm during the first peak of the anode voltage. Figure 2 shows a significant generation of runaway electrons in the hollow anode case for a long time
  while the anode voltage is as low as 10 kV (corresponding to a 13 kV plasma voltage). Similarly, ion beam radiation lasts also for 450 ns as show in fig. 3. The electric field across the plasma column at the third anode voltage peak is also about 10 kV/cm while the energy of the ion beam reaches 1 MeV based on the time-of-flight (TOF) analyses (200 ns delay between the third peak of the anode voltage and the second peak of the ion beam signal over a 40 cm distance between the Faraday cup and the anode tip). The signature of anomalous resistance has been found during the radiation of charged particles and X-rays in the post-pinch phase [12]. The time evolution of the plasma resistance can be approximately expressed by
 ![$R=R_{0} [e^{\frac{-t}{t_{2}}}-e^{\frac{-t} {t_{1}}}]$](https://content.cld.iop.org/journals/0295-5075/113/5/55001/revision1/epl17740ieqn44.gif) , where R0 is a constant of the order of
, where R0 is a constant of the order of  [8], t1 is the characteristic rise time of the anomalous resistance, and t2 is likewise the characteristic fall time. The hard X-ray caused by anomalous resistance has a fast rising time corresponding to the sudden occurrence of instabilities at the pinching time [32]. Experimentally, the fast rising time of the electron beam signal within 20 ns and the fast rising time of the second peak of a hard X-ray signal within 15 ns (that is even shorter than the rising time of the observed first peak of the hard X-ray signal) have been observed. The observed hard X-ray rising time t1 in the range 15–30 ns and the falling time estimated by
  (a characteristic time to transfer energy from the stored magnetic energy into plasma through anomalous resistance) are used to recover plasma current and voltage waveforms by the Lee model [9]. The plasma inductance on the order of
  as discussed earlier and the plasma resistance on the order of
  [12] lead to a falling time
  , corresponding to the observed decay time of the electron beam signal. Gribkov et al. suggested that the anomalous resistance induced a vertex electric field along the axial direction in the center of the focus where the magnetic field vanishes [32]. Highly collimated charged-particle beams are therefore expected and are also inferred from the experimental observations.
A significant generation of charged particles and X-rays during the post-pinch phase at weaker electric field across plasma than the field during the pinch phase might be interpreted by the dependence of the Dreicer field for runaway charged particles on the plasma temperature and charged-particle density in the form  [18,20,33], where
  is the ion and electron density and
  the ion and electron temperature. The decrease in the density of charged particle or the increase in the plasma temperature can reduce the required Dreicer field for runaway charged particles. In a plasma focus anomalous resistance caused by LHI is driven by axial mass loss, evaluated by axial elongation of a plasma sheath [34], due to the pressure gradient along the plasma column. The dissipated (Joule) energy by anomalous resistance heats ions and electrons based on the Vikhrev and Braginskii theory [35]. The previously reported results by Bruzzone et al. also showed that the ions and electrons can be heated by anomalous Joule heating up to several hundreds of keV [34]. It has been suggested that the electron beam generated by anomalous resistances can also heat the plasma [36]. During the post-pinch phase with anomalous resistance in this experiment, the decrease in the maximum plasma density in the centre of the plasma and the anomalous plasma heating may well lead to a significantly decrease in the Dreicer threshold field and it serves as a possible explanation of the significant emission of charged particles at the observed lower electric field during the post-pinch phase. In the case of runaway ions, reducing the ion density in the post-pinch also can depress the required Dreicer field for ions.
Conclusion
In conclusion, the evolution of the plasma impedance at different focusing stages in a Z-pinch (plasma focus) device has been investigated based on circuit analyses. The results show that the change in the plasma inductance in the phase of plasma implosion depends on the anode tip structure. The observed hard X-ray waveform has been used to estimate the rising time, decay time, and the duration of electron beam emission and those resultant characteristic times have been be used to recover the observed plasma current and anode voltage waveforms reported in a previous paper [9]. The experimental results show a significant generation of charged particles in at lower E-field across the plasma in the phase of anomalous resistances compared to the pinch phase. It is possible that the anomalous plasma heating and particle loss may have played an important role in reducing the Dreicer field to facilitate the generation of runaway-charged-particles emission during the post-pinch phase with anomalous resistances. It has been found that the runway-electron generation conditions in tokamaks and in a plasma focus are consistent in terms of ratios between E and  and between
  and
and  .
.
Acknowledgments
This work was sponsored by the Sylvia Fedoruk Canadian Center for Nuclear Innovation, the Natural Sciences and Engineering Research Council of Canada (NSERC), and Canada Research Chair (CRC) program.