

Abstract
Although damages to local distribution systems from wind and fallen trees are typically responsible for the largest fraction of electricity outages during hurricanes, outages caused by flooding of electrical substations pose a unique risk. Electrical substations are a key component of electric power systems, and in some areas, the loss of a single substation can cause widespread power outages. Before repairing damaged substations, utilities must first allow floodwaters to recede, potentially leaving some customers without power for weeks following storms. As economic losses from flooding continue to increase in the U.S., there has been increasing attention paid to the potential impacts of flooding on power systems. Yet, this attention has mostly been limited to geospatial risk assessments that identify what assets are in the path of flooding. Here, we present the first major attempt to understand how flooding from hurricanes and other extreme precipitation events affects the dynamic behavior of power networks, including losses of demand and generation, and altered power flows through transmission lines. We use North Carolina, hit by major hurricanes in three of the past seven years, as a test case. Using open-source data of grid infrastructure, we develop a high-resolution direct current optimal power flow model that simulates electricity production and generators and power flows through a network consisting of 662 nodes and 790 lines. We then simulate grid operations during the historical (2018) storm Hurricane Florence. Time series of flooding depth at a discrete set of 'high water' mark points from the storm are used to spatially interpolate flooding depth across the footprint area of the storms on an hourly basis. Outages of substations and solar farms due to flooding are translated to location-specific losses of demand and solar power production throughout the network. We perform sensitivity analysis to explore grid impacts as a function of the height of sensitive equipment at substations. Results shed light on the potential for localized impacts from flooding to have wider impacts throughout the grid (including in areas not affected by flooding), with performance tracked in terms of transmission line flows/congestion, generation outputs, and customer outages.
Export citation and abstract BibTeX RIS

Original content from this work may be used under the terms of the Creative Commons Attribution 4.0 license. Any further distribution of this work must maintain attribution to the author(s) and the title of the work, journal citation and DOI.
1. Introduction
The operations of electric power systems are frequently disrupted by extreme weather events such as hurricanes, floods, and wildfires [1–5], and these impacts are projected to increase due to climate change [6]. Mitigating the power grid's vulnerability to such events will be critical, as they can lead to widespread disruptions in power supply, which is increasingly essential to modern life [7]. In the United States (U.S.), hurricanes are the leading cause of major power outages, with nine out of ten major outages (i.e. outages affecting >50 000 customers and/or loads >300 MW) being attributed to hurricanes [8–10]. Outages caused by hurricanes are predominately caused by damages to low voltage distribution lines [3, 11] from fallen trees, which are felled by the combination of high winds and soil saturation [3, 12]. Hurricanes also bring about inland and coastal flooding from heavy rainfall and storm surges [13]. Floodwaters can cause serious damage to power system infrastructure, notably electrical substations, which are crucial grid components that serve as interfaces between power plants, high-voltage transmission, and end-use customers [14, 15]. During flood events, impacted substations may be inoperative until the floodwaters recede [3, 16], which can cause long delays in the power system restoration process [13]. These disruptions can have outsized impacts on smaller, rural communities that rely solely on a few substations for bringing in power supply from the wider grid; these smaller communities may thus endure longer power outages and much slower and uneven restoration times [17].
Quantitative evaluations of the effects of hurricanes on the power grid have been conducted in the past. For instance, in [18], an approach using a geospatial tool that incorporates high wind speed estimates overlaid with a U.S. electric service area map was employed to identify impacted grid assets during Hurricane Sandy. The importance of incorporating maintenance and system hardening for critical power infrastructure components was analyzed in [19] using the relationship between El Niño/La Niña and their seasonal effects on hurricane arrivals over a long-term climatological horizon. In [20], a probabilistic model to quantify hurricane resilience in modern power systems was proposed. This model included a hurricane hazard assessment, component fragility models, a power system performance model, and a system restoration model. These interconnected models allowed for measuring resilience and predicting economic losses related to hurricanes. A redispatch strategy was proposed by [21] to enhance the operation resilience of power grids during hurricanes considering the unavailability of renewable energy sources, while in [22] an event-driven resilience-based unit commitment model that considers simultaneous failures of system components due to predefined hurricane events has been proposed. Moreover in [3], an energy system optimization model that incorporates hurricane risks by combining storm probabilities with infrastructure fragility curves was proposed. This model optimized investment in grid architecture, fuel mix, and grid hardening measures while considering climate mitigation policies.
Yet, comparatively little research has addressed the specific impacts of flooding on the grid. In [23], researchers explored a GIS tool for strategic planning and operational decision-making, aiming to mitigate issues stemming from severe flooding in the electrical network. This tool incorporated risk assessment, identification of major electrical asset vulnerabilities, and cost estimation. Additionally [15], introduced a stochastic resource allocation approach to identify critical substations, maximize grid resilience, and account for flood scenarios, substation fragility, and historical damage data. Cruse and Kwasinski [13] established regression curves linking hurricane intensity, outage metrics, and flooding effects on power restoration. Authors in [24] developed a methodology to assess the economic losses endured by electrical assets during flooding events. These previous studies largely focused their analysis on asset vulnerability assessment and statistical estimation of performance metrics. They do not delve into the real-time impacts of flooding on system dynamics, including the potential for network connectivity effects. This research contributes in two significant ways: first, by advancing our understanding of the hour-by-hour chronology of flooding impacts on the grid, such as the sequence of outages in different parts of the system. Second, it explores the network effects of flooding, including the potential for outages to occur outside flooded areas due to failures elsewhere on the grid.
Here, we help close this gap in knowledge by analyzing the operations of the North Carolina bulk power grid using a newly developed open-source, direct current (DC) optimal power flow (OPF) model that simulates grid behavior while integrating hourly impacts of flooding on power system components across space. As a test bed, we simulate the operations of this system during a historical major hurricane: Hurricane Florence, which struck the state of North Carolina in 2018, causing power service losses to over 1 million customers [25, 26]. We estimate flooding impacts on the North Carolina grid by using a data assimilation approach for space-time estimation of flooding depth. Chronological impacts of flooding on individual grid assets are then incorporated into the power system model, which simulates power network dynamics, measuring generation on an asset level, transmission line flows and congestion, system reliability (unserved electricity load), and locational shadow prices.
This study represents the first major assessment of flooding and its repercussions on bulk power system behavior at an hourly temporal scale, taking into consideration disruptions in both power generation and customer service precipitated by flood-induced outages. A second, important dimension of this research involves quantifying the flooding-related grid impacts on affected communities through a socio-economic lens, with a particular focus on the potential for disparate impacts experienced by minority demographic groups during extreme meteorological occurrences like hurricanes. While our approach in this paper was specifically tailored for the North Carolina grid, the methodology can be easily applied to other systems.
The next section will detail the experimental design and methods used in this study. It includes information on the space-time estimation of flooding depth and the impacted grid assets. Additionally, it provides details on the power system model, time series inputs, and simulation of flooding impacts. In section 3, we present the results of our modeling experiment. This section discusses the impacts of flooding on the North Carolina grid assets and the power system dynamics. In section 4, we discuss the limitations of the study. We offer concluding thoughts in section 5. Lastly, we share open-source software data and funding resources.
2. Methods
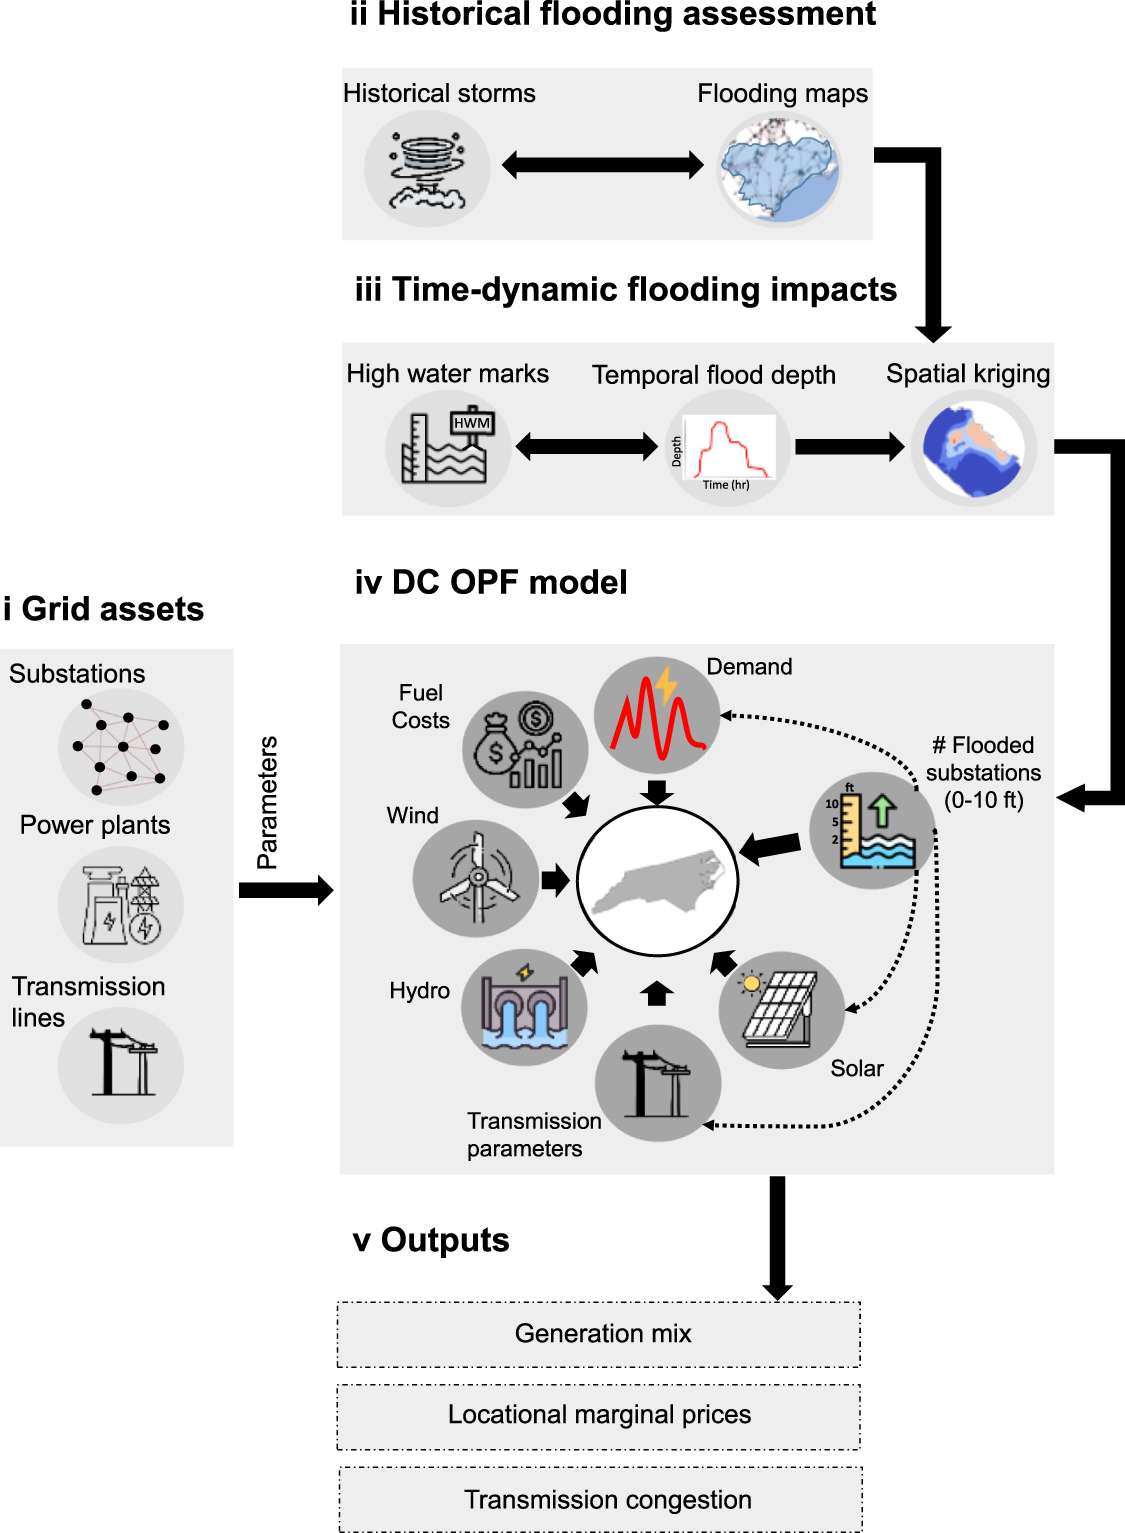
Figure 1 provides an illustrative overview of the data and models used in our analysis. We begin with a description of the nodal DC OPF model (see panel (iv) of figure 1) used to simulate operations of the North Carolina bulk power system, physical system characteristics (including the generation fleet), and time series inputs to the model. Then we describe our flooding analysis and approach for incorporating flooding impacts into the power system model (see panels (ii) and (iii) of figure 1).

Figure 1. (i) Primary inputs utilized in establishing the DC OPF model topology; (ii) maximum extent of Hurricane Florence accounted for in the analysis; (iii) flood depth time series derived from high water marks, estimated via data assimilation process involving USGS stream gauge records, subsequently employed in the hourly spatial kriging process; (iv) the DC OPF model incorporates all pertinent weather inputs, topology, and flooded grid asset impacts, thereby assessing the performance of the North Carolina bulk power grid; (v) the model's key outputs encompass metrics like generation mix, locational marginal prices, and transmission congestion for all the assumed flooding depths from 0 to 10 ft.
Download figure:
Standard image High-resolution image2.1. DC OPF model
The North Carolina grid is responsible for supplying electricity to a vast population of 10.4 million people residing in the state [27]. In 2018, the total annual net generation of all power plants in North Carolina was 2189 TWh. The generation mix is dominated by natural gas (34%) and then followed by coal, nuclear, wind, hydro, and solar power plants [28]. For this study, we developed a new, open-source DC OPF formulation of bulk power system operations in North Carolina (see figure 2).

Figure 2. (a) Power plants considered for the DC OPF model; (b) substations and transmission lines used for the topology of the DC OPF model.
Download figure:
Standard image High-resolution imageThe DC OPF model represents the North Carolina grid as a network of over 662 nodes and 790 high-voltage transmission lines. We made use of an existing network topology for North America produced using OpenStreetMap data from Gridkit [29], and selected all nodes in North Carolina and connecting lines, ensuring a connected graph. We collected publicly available geographic information data that provides details about the locations of various electric power generation assets (including nuclear, coal, natural gas, oil, biomass, and utility-scale solar power), substations, and transmission lines (refer to figure 2). The power plant locations were sourced from [28], while the transmission asset locations, including substations, were obtained from [30]. Each generator was repositioned to the nearest node in the network. We adopted the values documented in [30] for the voltage class and used these estimates and line distance to calculate reactance and surge impedance loading (depicted in figure S2).
The primary inputs to the DC OPF model are hourly time series describing the hourly amounts of available solar power production, nuclear power production, hydropower production, and electricity load (see figure S1). Time series data for solar and nuclear power and load are used as inputs to the DC OPF model, as depicted in figure S1 in the supplementary information. Hourly nuclear generation data was sourced from [31–33]. Historical hourly generation data for solar was obtained from the US EIA for 2018 [34–36], along with corresponding hourly records of hydropower production [37–39]. Additionally, the hourly demand records were obtained from the US EIA for 2018 [40]. A state-level time series of load was disaggregated by node based on population weighting, and a state-level time series of solar power production was disaggregated by node based on installed solar capacity.
The DC OPF model is written in Python using the Pyomo [41, 42] mathematical programming library and Gurobi [43] to solve the deterministic optimization. The model's objective is to minimize the costs associated with meeting hourly electricity demand and maintaining operational reserves in North Carolina. This is done while adhering to constraints on individual power generators, transmission lines, nodal power balances, as well as Kirchoff's current and voltage laws. The model operates on a user-defined 24 hour horizon and the temporal resolution of the model outputs is hourly. The primary decision variables of the model are binary (on/off) decisions and continuous electricity production from each generator, voltage angle at each node, load-shedding at each node, and power flow on each transmission line. Model outputs include the least cost generation schedule, identified down to the individual generator level, hourly nodal shadow costs (equivalent to locational marginal prices in restructured markets), loss of load at each node (if applicable), and power flows through transmission lines. A more detailed description of the model and all its sub-components can be found in the supplementary material. Validation of the DC OPF was conducted using the generation mix reported by [28], further details on the validation of the model can be found in the supplementary information.
2.2. Flooding analysis
Assessing the impacts of flooding on power system operations requires having high-resolution space-time estimates of flooding depth. In this study, we use a purely data-driven approach [44], following a similar assimilative approach to [45, 46], integrating different types of data to achieve flooding estimates (as opposed to physical hydrologic models). We start with records of 'high water marks' (maximum flooding depth) that were collected during Hurricane Florence from [47] (see blue dots in figure 3(b)). The locations of these points are then paired with the nearest available US Geological Survey (USGS) stream gauge [48] each of which contains a dynamic hourly record of flood stage (see figures 3(a) and (c)).

Figure 3. (a) USGS stream gauges in North Carolina; (b) High water marks during Hurricane Florence in North Carolina; (c) matching each HWM with the nearby USGS stream gauge for the data assimilation process.
Download figure:
Standard image High-resolution imageThen a bias correction was implemented. This procedure entailed calculating the difference between the maximum flooding depth indicated by a high-water mark and the highest stage height reading at the nearest USGS stream gauge. The difference was deducted from the time series data of the stream gauge. This process was performed for every combination of USGS stream gauge and high-water mark, yielding estimated hourly flooding depths at each high-water mark. Each resulting hydrograph crests at the exact observed value in the original dataset.
Figure 4 illustrates the results of this procedure. In figure 4(a), we show estimated chronologies of flooding depth at each high water mark location in the Lumber River basin during Hurricane Florence. Each line on the graph corresponds to a high-water mark. Figures 4(b)–(f) present hourly snapshots of estimated flooding depth at every high water mark in the Lumber River basin for five selected hours before, during, and after the storm. This analysis was repeated for every major river basin affected by the storm, namely White Oak, Lumber, Cape Fear, Neuse, and Tar Pamlico.

Figure 4. (a) Time series of flooding depth for each high water mark in the Lumber basin; (b)–(f) snapshots of flooding depths at different hours during Hurricane Florence.
Download figure:
Standard image High-resolution image2.2.1. Variogram analysis
Hourly estimates of flooding depth at high water marks were then utilized to interpolate flooding depth across the entire study area. As a first step, we used the flooding depth time series as inputs in a spatial variogram analysis. The variogram is a function that describes the degree of spatial statistical dependence observed in a spatial random field, a characteristic known as spatial autocorrelation [49]. In our case, after identifying the best-fit variogram for each river basin, we can use these functions to interpolate a geospatial raster of flooding depth across the entire study area.
The semi-variogram model used for the analysis is Matheron's (1963), in which the semi-variogram function is the one presented in equation (1).

where γ(h) is the sample semi-variance at lag h, which is a vector in both distance and direction, zi and zj are flooding depth values at spatial locations (high water marks) i and j, and │N(h)│is the number of distinct pairs in N(h). For each individual hour, and for each river basin, we identify the best fit empirical variogram that estimates spatial autocorrelation in flooding depth as a function of lag h using least squares regression. Figure 5 shows an example using the same flooding depth data displayed in figure 4.

Figure 5. (a) Time series of flooding depth for each HWM in the Lumber basin; (b)–(f) variogram estimations for each of the flooding depth snapshots in the Lumber basin.
Download figure:
Standard image High-resolution image2.2.2. Ordinary kriging
The empirical spatial variograms identified in the previous section then allow us to perform a spatial interpolation, or 'kriging' flooding depth across the entire study area on an hourly basis. The estimated variograms are essentially used as weights to predict values of flooding depth in areas where there are no historical observations. When predicting flooding depths for a given area, nearby high water marks more strongly influence the prediction than high water marks that are further away. Predictions of flooding depth are made for each of the studied river basins (White Oak, Lumber, Cape Fear, Neuse, and Tar Pamlico) for every hour between 11 p.m. on 15 September 2018, and 11 p.m. on 26 September 2018. Figure 6 shows a snapshot of results in different hours for the Lumber River basin.

Figure 6. (a) Time series of flooding depth for each HWM in the Lumber basin; (b)–(f) kriging interpolation of the flooding depth for a few selected hours in the Lumber River basin.
Download figure:
Standard image High-resolution image2.3. Flooding impacts on grid assets
We then further extend our spatial-temporal analysis of flooding depth to assess the impacts on grid assets, especially substations, and connected utility-scale solar farms, by utilizing the flooding depth outputs obtained from the kriging analysis in the previous section. Our underlying assumption is that if the flooding depth at the location of a substation is greater than or equal to the height of sensitive equipment, it is rendered inoperable. When a solar farm is flooded, we assume that all energy output from that farm ceases. When a substation is impacted by flooding, we assume several direct consequences: (1) demand for electricity behind that substation is unserved, meaning customers experience electricity service outage; (2) generators 'behind' that substation are also rendered inoperable; and (3) all high voltage transmission lines directly connected to that node in the network are rendered inoperable.
Relatively little information is publicly available about the height of sensitive equipment at electrical substations. As a result, We test a wide range of scenarios that assume a uniform height of sensitive equipment at grid assets, ranging from 0 feet (i.e. any water on the ground equals flooding damage) to 10 feet (i.e. any flooding less than 10 feet equals no damage). We estimate the number of substations and solar farms impacted on an hourly basis across the study area and alter the time series inputs to the DC OPF model accordingly.
2.4. Impacted communities
During Hurricane Florence, a significant amount of end-customer demand could not be met [50]. While the majority of this 'unserved energy' was the result of damage to the distribution network caused by tree damage, here we are interested in isolating potential impacts from flooding. In our analysis, unserved energy caused by flooding can occur in two ways: (1) direct due to the loss of a substation, which knocks any customer directly served by that station; and (2) indirect due to the loss of load due to supply and demand imbalance. Note that indirect unserved energy can be caused by altered generation capacity at solar farms, and changes in the network topology (losses of transmission lines) that make it impossible for electricity flows to travel through the network to meet customers or both. The DC OPF quantifies indirect losses of load using load-shedding variables that are triggered as a last resort to maintain the nodal power balance.
We estimated both direct and indirect unserved energy for each county, and then each demographic group based on the most recent census data [51], assuming losses are felt proportional to county-level demographic percentages. This information was then used to estimate both direct and indirect unserved energy during Hurricane Florence for different demographic groups. Additionally, utilizing county-level estimates of the Social Vulnerability Index (SVI), we assessed how unserved energy impacted communities that were already vulnerable to adverse human health effects from external stressors, including natural or human-induced disasters, or disease outbreaks [52].
3. Results and discussion
Our discussion of results is divided into four main sections. The first section explores the findings from the flood risk assessment, focusing on the number and type of assets impacted during Hurricane Florence. The second section delves into detailed results from the DC OPF model. The third section evaluates how these flooding impacts on the grid may affect people at the county level. Then we discuss methodological limitations encountered in our analysis.
3.1. Vulnerable grid assets
This subsection provides an overview of flooding-related impacts on grid assets during Hurricane Florence, specifically focusing on substations and solar generation. The results are summarized in figure 7, which shows selected results for four different scenarios in which we assume the height of sensitive equipment at grid assets are 0 ft (most vulnerable), 2 ft, 5 ft, and 10 ft (least vulnerable). Figure 7(a) shows that at an equipment height of 0 ft, the analysis identified a peak of 93 inoperable substations. This number decreases to 60 inoperable substations at a height of 2 ft and further diminishes to 7 inoperable substations at a height of 5 ft. No substations were impacted at a height of 10 ft.

Figure 7. Impacted substations (panel (a)) and solar generation (panel (b)). The line colors indicate the extent of grid assets affected by flooding during Hurricane Florence at specific equipment heights, with 0 ft represented in blue, 2 ft in orange, 5 ft in green, and 10 ft in red.
Download figure:
Standard image High-resolution imageA similar trend is observed in terms of impacts on solar generation figure 7(b). At a sensitive equipment height of 0 ft, there was a peak reduction of 305 MWh in solar generation. This reduction decreased to 148 MWh at a height of 2 ft and subsequently dropped to 33 MWh at a height of 5 ft. There was no recorded impact on solar generation at a height of 10 ft.
While specific details regarding the number of substations affected by Hurricane Florence in North Carolina are not publicly available, estimates do exist. According to [25], a total of 64 substations were rendered inoperative during the hurricane, a figure aligning roughly with the impacts observed in our model assuming a height of sensitive equipment of 2 ft (see panel (a) in figure 7). The highest reported flooding depth during Hurricane Florence was 9 feet [53].
3.2. Flooding impacts on power system dynamics
3.2.1. Generation mix
Figure S28 in the supplementary material explores the impact of flooding on the generation mix in the North Carolina grid during Hurricane Florence. Demand decreases during the storm (a product of outages and mandatory evacuation), and solar production decreases (a product of cloud effects and flooding). It is also noteworthy that there was a decrease in nuclear power contribution during the storm, which reflects the standard practice of shutting down nuclear power plants as a precautionary measure before hurricane landfall.
3.2.2. Network effects
This section delves into the detailed impacts of flooding on bulk power system dynamics using the results of the DC OPF model. Our discussion here concentrates on a relatively short window of time during which Hurricane Florence impacted the grid, and we focus on two different equipment height scenarios: 2 ft and 8 ft. We explore these two scenarios specifically as a way to demonstrate the potential benefits and effects of substation hardening (in particular, equipment elevation) as a risk mitigation strategy. However, additional simulation results are available for the remaining scenarios in our sensitivity analysis (equipment heights spanning 0–10 ft) in the supplementary material.
Figures 8 and 9 show hourly snapshots of the NC bulk power system during Hurricane Florence, assuming equipment heights of 2 ft and 8 ft, respectively. The left column of each figure shows transmission lines (in red) that are lost due to flooding damages at connected substations. The right column of each figure shows resultant changes in the magnitude of power flows on each line, compared to a scenario with no impacts from flooding. The four hourly snapshots depicted are: September 9th at 6:00 a.m., September 16th at 11:00 p.m., September 18th at 11:00 p.m., and September 20th at 11:00 p.m. The impacts on the network topology and power flows are clearly higher when we assume damages are triggered at a flooding depth of 2 ft.

Figure 8. Impacted lines and flow differences during Hurricane Florence assuming the height of sensitive equipment at 2 ft.
Download figure:
Standard image High-resolution image
Figure 9. Impacted lines and flow differences during Hurricane Florence assuming the height of sensitive equipment is at 8 ft.
Download figure:
Standard image High-resolution imageTable S2 focuses on transmission lines that are directly impacted by flooding (i.e. attached to a damaged substation) in a single hour, September 18th at 11:00 p.m. (corresponding to panel c in figures 8 and 9). When an equipment height of 2 ft is assumed, we detect 30 inoperable transmission lines. This number decreases to 7 if the equipment is elevated to 8 ft. The most significant changes in power flows assuming a 2 ft equipment height occur on lines 'n_1924_n_28663' and 'n_1837_n_1924', with changes of −2566.70 and −2357.05 MWh, respectively. These values change substantially (to −148.89 MWh, and −346.94 MWh, respectively) when equipment is elevated to 8 ft.
Yet, in figures 8 and 9, note that in the right column, we see that changes in power flow affect a much larger number of transmission lines than those that are directly impacted by flooding. We frequently see transmission lines along the same path as an impacted line that simultaneously experience a large reduction in power flows (blue shading), because the operator (i.e. the DC OPF model) must find an alternative route through the network to deliver electricity due to the loss of a small number of lines. In fact, we find that the largest magnitude changes in power flows are not on lines that are directly impacted by flooding, but rather on neighboring lines.
Table 1 likewise focuses on results from September 18th at 11:00 p.m. (corresponding to panel c in figures 8 and 9). Here, we evaluate changes in power flows on transmission lines on the same path as lines that are directly impacted by flooding. When assuming a substation elevation of 2 ft, the highest change in power flow occurs at line 'n_31027_n_28663' with a value of −3153.13 MWh, which is later reduced after elevating the substations up to 8 ft, reducing the changes in power flows to −51.11 MWh.
Table 1. Major impacted neighbor transmission lines at 11:00 p.m. on 09/18/18.
| Neighbor lines: 09/18/18 11:00 PM Flow in MWh | Changes in power flows | ||||
|---|---|---|---|---|---|
| Lines | No flood | 2 ft | 8 ft | 2 ft | 8 ft |
| n_31027_n_28663 | 3329.68 | 176.55 | 3278.57 | −3153.13 | −51.11 |
| n_4472_n_6922 | −3524.15 | −419.21 | −3472.66 | −3104.94 | −51.49 |
| n_28719_n_7062 | 190.40 | 0 | 381.80 | −190.40 | 191.39 |
| n_6687_n_7062 | −189.02 | 0 | −380.41 | −189.02 | 191.39 |
| n_4093_n_28470 | −936.07 | −1892.61 | −1046.52 | 956.55 | 110.45 |
| n_4093_n_7049 | 936.07 | 1892.61 | 1046.52 | 956.55 | 110.45 |
| n_6967_n_6682 | 1155.45 | 2155.86 | 1273.75 | 1000.41 | 118.30 |
| n_6682_n_7011 | −358.52 | −1521.11 | −543.73 | 1162.59 | 185.22 |
During the storm, we also observe that flooding causes some lines to experience large increases in power flows (red shading in right column panels of figures 8 and 9); these lines represent the alternative paths the DC OPF chooses through which to deliver electricity. In this sense, figures 8 and 9 allow us to observe the adaptive capabilities of the network to respond in real-time to asset losses due to flooding.
3.2.3. Nodal shadow costs and reliability losses
In addition to direct unserved energy caused by flooding of substations (which, in this study, are assumed to result in outages for all connected customers 'behind' that substation), we can also measure the potential for wider (indirect) reliability losses caused by nodal imbalances of supply and demand. The DC OPF model includes a load-shedding variable representing load-shedding (akin to a rolling blackout), which is penalized at $10 000/MWh. This is an order of magnitude higher than the marginal cost of any generator in the system, so the operator will only choose to shed load if it is the only way to maintain the nodal balance in supply and demand. Figures 10 and 11 show results for the same two equipment height scenarios (2 ft and 8 ft, respectively), and for the same hourly snapshots as figures 8 and 9.

Figure 10. Left column: Panels (a)–(g) illustrate reported outages at the county level ('Outages in MWh'), with small dots representing the total flood-related losses of load in MWh at a flooding depth of 2 ft. Right column: Panels (b)–(h) show locational marginal prices (shadow prices) at specific hours for a 2 ft flooding depth during Hurricane Florence.
Download figure:
Standard image High-resolution image
Figure 11. Left column: Panels a-g illustrate reported outages at the county level ('Outages in MWh'), with small dots representing the total flood-related losses of load in MWh at a flooding depth of 8 ft. Right column: Panels b-h show locational marginal prices (shadow prices) at specific hours for an 8 ft flooding depth during Hurricane Florence.
Download figure:
Standard image High-resolution imageIn the left column, counties are colored by the actual level of outages reported by [54] during Hurricane Florence (the vast majority of these reported outages are caused by wind and tree damage, not flooding). Using records of actual customer outages reported by [54], we translate these to MWh of unserved energy, adopting an average residential consumption rate of 0.08 MWh per customer, in accordance with the findings of [55]. Layered on top of these values, the circles indicate the positions of nodes that experienced flooding-related losses of load. These are total losses of load caused by both indirect and direct unserved energy. The magnitude of these losses is represented by the color of the circles, using the same scale as the reported outages.
The right column of each panel shows the corresponding values of LMPs (locational marginal prices) at each node. When the load-shedding variables are triggered, the nodal 'shadow cost' (also referred to as LMPs in restructured power markets) increases to very high levels.
In general, the DC OPF model's estimate of where unserved energy occurred during Hurricane Florence aligns with reported outages, as illustrated in figures 10 and 11. Notably, the magnitude of unserved energy attributed to flooding is consistently lower than the officially reported outages. This is expected because most outages are caused by fallen trees impacting distribution lines.
On September 18th at 11:00 pm, our model indicated that 65 nodes experienced unserved energy (see also table S5 in the supplementary material), assuming an equipment height of 2 ft; 36 of these nodes experienced direct unserved energy, whereas 29 nodes experienced indirect reliability losses. These numbers drop significantly to only four nodes (1 direct, 3 indirect) when the equipment is elevated to 8 ft (see table S7 in the supplementary material). Tables S8 and S9 in the supplementary material show the nodes experience the highest flood-related unserved energy (total unserved energy) across different snapshots in time and for equipment heights of 2 ft and 8 ft.
In general, nodes that experience indirect unserved energy also have shadow costs of $10 000/MWh, indicating load shedding; but high shadow costs do not necessarily indicate that load shedding is occurring at a node, only that that part of the grid is experiencing extreme scarcity. Raising the height of equipment decreases these shadow costs.
Additional results describing the relationship between shadow costs (LMPs) and total unserved energy for different equipment elevations can be found in the supplementary material (see figures S16–S27).
Our analysis of altered network topology, changes in power flows, flooding-related losses, and high LMPs are closely interconnected. In particular, these results underscore the potential for flooding impacts at substations to alter the network topology (and production of solar generation) to create significant unserved energy outside the areas that experience severe flooding. These disturbances force the DC OPF to reroute large amounts of power through the network, which can result in physical infeasibilities that make it impossible to achieve a supply-demand balance everywhere, leading to higher LMPs in areas experiencing outages and sometimes load-shedding.
3.3. Impacted communities
Figure 12(a) shows that outages caused directly by substation damages (gray bars) on September 18th at 11:00 pm represent the largest proportion of flooding-related unserved energy for an equipment height of 2 ft, compared to indirect (scarcity-driven) load-shedding. However, this shifts at an equipment height of 8 ft (figure 12(c)), and indirect losses become a larger driver of the overall loss of load. Figures S21–S24 in the supplementary material show that equipment elevations in the range of 0–3 ft are mostly driven by direct unserved energy, while higher elevations are driven by indirect unserved energy as fewer sites are impacted. Moreover, figures 12(a) and (c) display the total unserved energy per capita for each racial group (dotted line). Specifically, figure 12(a) shows that, for a 2 ft equipment height, communities of color experience higher unserved energy. However, this shifts in 12 c for an 8 ft equipment height.

Figure 12. (a) For a 2 ft equipment height: The dotted black line represents the total unserved energy per racial group (MWh/person) on September 18th at 11:00 pm within each racial group. Load shedding (representing indirect mean unserved energy) is indicated by the turquoise portion, while the gray portion signifies the direct unserved energy resulting from impacted substations; (b) the black dots represent the total unserved energy at a 2 ft equipment height within each county, with the colors of the counties reflecting the respective Social Vulnerability Index; (c) similarly to point (a), but for an 8 ft equipment height; (d) the black dots represent the total mean unserved energy at an 8 ft equipment height, while the colors of the counties indicate the percentage of people identifying as people of color in North Carolina.
Download figure:
Standard image High-resolution image
Figure 12 also delves into the distribution of total flood-related unserved energy across various counties and communities in North Carolina. Figures 12(b) and (d) show total flood-related unserved energy for 2 ft and 8 ft equipment heights, respectively, on September 18th at 11:00 pm during Hurricane Florence. In figure 12(b), the colors of each county correspond to values on the SVI. In figure 12(d), the colors of each county indicate the percentage of residents identifying as people of color. A significant correlation (r = 0.77) exists between a county's SVI and its percentage of individuals identifying as people of color (see figure S34 in the supplementary material).
Figure 12(b) indicates that counties with a higher SVI are more susceptible to flood-related unserved energy when the equipment height is 2 ft; flood-related losses and SVI are correlated (Pearson R = 0.53, as shown in figure S34 of the supplementary material). At an equipment height of 8 ft (figure 12(d)) only two counties experience flood-related unserved energy.
Overall, figure 12 suggests that elevating substations would be an effective strategy for mitigating the incidence of flood-related outages during Hurricane Florence, especially for vulnerable counties. Additional results for other equipment height scenarios and dates are available in the supplementary information.
4. Limitations and outlook
This study represents a step forward toward better assessing the impacts of flooding on the North Carolina grid (and power systems in general). However, some limitations remain, as detailed below.
First, our flood risk assessment relies on data from coastal basins, including White Oak, Lumber, Cape Fear, Neuse, and Tar Pamlico, as these areas were most affected by Hurricane Florence. We use high-water marks (HWMs) hourly time series of flooding depth to perform hourly ordinary spatial kriging within each of these basins. However, it is important to note that the time series obtained as a result of the data assimilation process do not account for restoration times or component replacement needs within the electrical substations. The durations of flood-caused outages represented in our modeling are likely to be underestimated. The method adopted relies solely on the HWM data within each basin, and these estimates can be significantly affected by the amount of data and the distance between points, as exemplified in [56]. To improve spatial flooding depth interpolation, future research endeavors could increase the amount of input flood depth data by incorporating additional sources of flood depth data, such as crowd-sourced images [2], or leveraging remote sensing data, as exemplified in [57]. Additionally, repair time can be used as a metric associated with damage categories, as outlined in [58].
Second, it would be more accurate to model the entire Duke Energy system, encompassing both North Carolina and South Carolina, using the DC OPF. This broader scope would provide a more comprehensive view of generator dispatchment dynamics across the entire Duke Energy territory. Moreover, it is worth noting that this study focuses solely on one specific extreme weather event. To gain a deeper understanding of grid dynamics, future research should expand the analysis to include past and future storms and their potential impacts on both current and future grid infrastructure.
Third, we did not conduct a comprehensive assessment of the grid's resilience against hurricane flood-related power outages and their effects on communities. To improve our understanding and develop more effective strategies for disaster management and community support, additional metrics should be explored. This could include considering different hurricane intensity levels, probabilistic grid asset failures and restoration times, and first-response strategies, as in [59]. Our study did not consider alternative methods to strengthen the resilience of the grid, such as microgrids [60]. Additionally, many other metrics could be considered when choosing the best resilience strategy [61].
5. Conclusions and future work
This work investigates the ramifications of flooding from Hurricane Florence on the system dynamics of the North Carolina bulk electric power grid. The study makes three contributions. Initially, it identifies the grid assets that were impacted during Hurricane Florence through a purely data-driven flood risk assessment facilitated by spatial kriging. These impacted assets are subsequently translated to time series inputs that alter demand (due to flooded substations), generation (owing to flooded solar panels), and transmission (as a result of impacted lines). Secondly, we leverage a detailed nodal DC OPF model to simulate the grid dynamics during Hurricane Florence, yielding estimates of both direct and indirect impacts of flooding on the grid in terms of physical behavior (e.g. power flows through the transmission network), locational measures of scarcity assessed through the deployment of LMPs, and loss of electricity service. Last, we deploy our analysis framework to estimate the total unserved energy across various counties and communities, adding some to the discernment of impacts on the state's vulnerable communities.
When running the DC OPF model, several critical insights were obtained for policy and infrastructure decisions. First, the model demonstrated the significant role of substation equipment elevation as a hardening method during extreme weather events. Elevating substations to higher heights, such as 8 ft, significantly reduces total unserved energy. Second, the findings unveiled a significant connection between substation outages, power flow disruptions, and extreme (elevated) LMPs during Hurricane Florence. Substation outages caused by flooding alter the transmission network topology, altering power flows and causing ripple effects (namely, supply scarcity) elsewhere in the grid, even in places where no flooding is occurring. Finally, impacts were evaluated spatially among the communities in North Carolina, revealing that communities with a higher SVI were much more heavily impacted, not only in terms of the actual outcomes of the model but also when compared to the actual reported outages.
The findings presented here can serve as a benchmark for future studies aiming to conduct even more precise analyses of flooding impacts on power system operations, which should be conducted proactively to plan cost-effective mitigation strategies to enhance the grid's resilience and the resilience of vulnerable communities.
Acknowledgments
This research was supported by the North Carolina Policy Collaboratory.
Software and data availability
The model is open-source and publicly available. All codes of the model and data used are available under MIT free software license [62].
Data availability statement
The data that support the findings of this study are openly available at the following URL/DOI: https://github.com/lprieto1409/DC_OPF_model.
Supplementary data (7.8 MB PDF)