

Abstract
This article presents a detail experimental procedure to perform float-and-sink tests for classifying coal samples according to their densities. Moreover, this article emphasizes obtaining 'partition curves' for three different coal samples (heavy media bath, big barrel and small barrel), which helps in evaluating and demonstrating classifier performance. Calculations of independent variables such as 'Probable Error' and 'Imperfection' are also discussed for partition curve that helps in evaluating the effectiveness of various beneficiation equipment used for the upgradation of quality of coal received from different coal mines. It was observed that there is a tendency for the partition curves to steepen as the density of separation decreases. In other words, separations at lower density is sharper than separations at higher density.
Export citation and abstract BibTeX RIS

Original content from this work may be used under the terms of the Creative Commons Attribution 4.0 licence. Any further distribution of this work must maintain attribution to the author(s) and the title of the work, journal citation and DOI.
1. Introduction
The process of separating particulate materials on the basis of their specific gravities is referred to as gravity separation. The objective of the coal washability principle is to develop routine protocols that include the float-and-sink test, ash analysis, and evaluation of partition curves to obtain maximum possible separation performances for a given mineral (or coal) feed [1, 2]. The float-and-sink method helps in separating coal samples according to the difference in their respective specific gravities in a heavy liquid medium. This heavy fluid separation method is independent of the particle size and only a function of the difference in the densities of two substances. The particles of higher specific gravity sink in the liquid medium, whereas the lighter particles float on the liquid surface [3, 4]. During the float-and-sink test, the material that floats on the liquid surface is removed followed by drying for further examinations. However, the residual material that sinks is further transferred to another bath or dried for additional investigations [5]. The desired range of relative densities for a float-and-sink test typically includes from 1.3 to 1.8 and in some cases it can be as high as 2.2 [6].
1.1. Partition curve
The partition curves are more suitable for evaluating and demonstrating classifier performance by knowing the fineness of grind than the cyclone cut-size. The partition curve can be obtained by sampling the float-and-sink coal samples and conducting heavy liquid tests to acquire the amount of material in each density fraction [7]. The separation efficiency of coal samples is represented by the partition curve, which is a plot of partition coefficients against relative density. The partition coefficient is expressed as the fraction of a specific relative density fraction reporting to reject [8]. Partition curves are independent of the feed materials and described as a function of particle density [9].
1.2. Probable error and imperfection
There are a few independent criteria that include parameters such as 'Probable Error' and 'Imperfection' of coal samples, which are used to evaluate the effectiveness of different equipment for application to a specific coal reserve. The concept of 'Probable Error' or 'Ecart Probable Moyen (Epm )' are used as a criterion to represent the sharpness with which the coal and impurities are separated. Epm is a measure of the deviation of the distribution curve from a perfect separation. Numerically, the Epm is defined as half of the specific gravity interval spanned by the distribution curve in passing from the 25%–75% recovery ordinates. Mathematically, it can be expressed as follows:

where d75 and d25 are the heavy liquid densities representing the points on the partition curve, respectively. Generally, the steeper the distribution curve, the lower the Epm value. In other words, a lower Epm value designates a sharp separation, whereas a higher Epm value denotes that separation is not sharp [10, 11]. In other words, lesser Epm value for any gravity separation indicates less misplacements [9]. The usual range of Epm is from about 0.02–0.3.
Imperfection (I) involves the influence of the specific gravity of separation on the shape of the distribution curves. Previously, the distribution curve was found to be independent of the density of separation. However, with more experience, this concept changed, and it was observed that with a decrease in density of separation, the curve steepens. In other words, separations at lower density tend to be sharper than those at higher density [10]. In an effort to develop a criterion for sharpness of separation that would be independent of the density of separation, the term 'Imperfection' was originated, for which the symbol is I. Imperfection indicates the degree of fluctuation from the perfect separation [9]. The formula for the imperfection is

where, I is imperfection,  is Probable Error, and d50 is specific gravity of separation at 50% of the recovery ordinate. The above formula can be applied for a Jig cleaning unit. The following formula is applied for a dense cleaning unit:

For wet processing units such as 'Wet Jig (dimension: 10 mm × 3 mm)' and 'Water only cyclone' have Epm and I values are in the range of 0.1–0.15 and 0.14–0.23, respectively. Similarly, for dry processing units such as 'Shaking table' and 'Dry jig' have Epm and I values are in the range of 0.02–0.03 and 0.04–0.25, respectively. Imperfection is a coefficient that describes a specific cleaning device irrespective of the separating gravity and expresses the performance of a washer [10]. The d50 (also known as 'effective density cut point') can be easily read-off from the partition curve. For perfect (or ideal) separation, the Epm and I would be zero [12]. Furthermore, as reported by Wolosiewicz-Glab et al (2018), the partition curves are modeled in terms of non-linear functions such as probable error (Epm ) and imperfection (I) parameters, which helps in studying the performance of classifiers [11]. In this article, we will be discussing methods to conduct float-and-sink tests and ash analysis. Moreover, a procedure to obtain partition curve and from the partition curve, how to calculate 'Probable Error' and 'Imperfection' have been discussed in this article.
2. Materials and methods
2.1. Materials and equipment
Three different types of coal samples i.e. 'heavy media bath', 'big barrel' and 'small barrel' were procured from Mahanadi Coalfields Limited (MCL), Talcher, India. An aqueous solution of zinc chloride was used for a float-and-sink test for the 1.2–1.8 density range. For the 1.8–2.0 density range, a mixture of bromoform and carbon tetrachloride was used. A hydrometer and a specific gravity bottle were used for density measurement of the solutions.
2.2. Methodology
2.2.1. Sample collection
The study was carried out to ascertain the performance of three different types of coal samples i.e. 'heavy media bath', 'big barrel' and 'small barrel', which are being utilized for the beneficiation of high ash non-coking coal located at coal mines of the Talcher area under MCL, India. As per the testing procedure, the coal samples were collected from the feed, clean, reject coal conveyor belts as per IS (Indian Standard) 436. During the sample collection, the plant was operating at 320 MT/hr and the bath density was maintained at 1.63 to 1.64. Approximately 100 kg of samples were collected from each stream and brought to the Chemical Engineering Department, Indira Gandhi Institute of Technology (IGIT), Sarang, India, for a float-and-sink test. The total collected sample was sieved at 100 mesh size. The –100 mesh size fraction was rejected and +100 mesh size fraction was subjected to coning-and-quartering.
2.2.2. Coning-and-quartering
The dried coal samples were thoroughly mixed and piled up into a cone-shaped heap as shown in the figure 1(a). The top of the cone was flattened by pressing over it as depicted in figure 1(b). Two lines were drawn approximately at right angles across the flattened top of the heap. Further, the flattened sample was divided along the lines to form four smaller quarters of equal size as illustrated in the figure 1(c). Two of the segments from opposite sides were discarded and the remaining two segments were again piled up into a new cone as can be seen in figure 1(d). The next time, the segments of other opposite sides were discarded. This process of coning-and-quartering was repeated for the new cone until we got 1 to 1.5 kg of coal samples and thus, the weights of the coal samples were recorded.

Figure 1. Coning-and-quartering of dried coal samples.
Download figure:
Standard image High-resolution image2.2.3. Solution preparation for float and sink test
Water along with pure zinc chloride (as a liquid sorting medium) were taken in a container together to get a solution of a particular density. The density of the resultant solution was checked using a hydrometer. Comparing the observed density to be above or below 1.2 (desired density), zinc chloride or water was added accordingly. These steps were repeated until the solution having density almost equal to the desired density was obtained. Further, the accurate density was obtained using a specific gravity bottle. The container was covered and stored in a dry place. These steps were further repeated to obtain solution densities up to 1.8. Since the solutions having densities of 1.9 and 2.0 could not be prepared using zinc chloride and water, therefore, bromoform and carbon tetrachloride were used as the liquid sorting medium. The prepared solution was stored in corrosion resistance bottles. It should be noted that for the removal of harmful organic vapors, air ventilation systems must be used at the testing facility [5].
2.2.4. Float-and-sink test
The float-and-sink experiments were conducted as per IS: 13810 for different size fractions [13]. To perform the float-and-sink test, the 'heavy media bath' coal samples were kept in a sieve and dipped in the container having a zinc chloride solution of density 1.2. The coal samples that were floating on the surface of the solution were collected and washed using water for about thrice for removal of impurities. The heavier coal samples have a density higher than 1.2 and hence, the samples were dipped in the container having the solution density of 1.3. A similar float-and-sink test was performed with the containers having solutions of densities up to 2.0. It should be noted that for solution density 1.9 and 2.0, a solution of bromoform and carbon tetrachloride was used for float-and-sink test. The same procedure was repeated for the rest of the samples i.e. 'small barrel' and 'big barrel'. The washed coal samples were then separated according to their densities and kept in trays for drying. The wet coal samples were dried in direct sunlight for two to three days to make it bone-dry. The dried samples were weighed using the electronic weighing machine and the weight loss was calculated. The bigger coal particles were broken under the action of attrition into smaller particles. The sieving process was performed to obtain very fine particles of –80 mesh size. However, if the sample was found to be non-uniformly distributed in size, then the sample was subjected to coning-and-quartering as shown in the figures 2(a) to (d). The coning-and-quartering process was followed to get a small fraction of the grinded sample, which was homogeneous in terms of its size distribution. This method was found to be more convenient and time saving for sample collection.

Figure 2. Coning-and-quartering of grinded coal samples.
Download figure:
Standard image High-resolution image2.2.5. Ash content analysis
The typical Indian coals have higher ash- and volatile- content and hence, coal has strong influence on rapidly increasing energy demand [14–16]. The ash content of coal samples obtained from each float-and-sink segment is characterized as per IS: 1350 [13]. To do the ash analysis, the air-dried powdered coal material was thoroughly mixed for one-minute and passed through a 212-micron IS sieve. A clean dry empty dish was weighed and was covered with its lid. The material was distributed in such a way that the spread did not exceed 0.15 g cm−2. The uncovered dish was inserted into the muffle furnace at room temperature and then the temperature was raised to 500 °C for 30 min and further to 815 °C for 60 min. The container was then removed from the muffle furnace and allowed to cool. The cooling process was achieved by first cooling on a metal slab for 10 min and then in a desiccator for 15 min. The mass of the ash was weighted. The dish was further re-ignited at the same temperature until the change in mass of the ash was found to be less than 0.001 g (tolerance interval: 0.001). The mass of ash was noted, and the ash was later brushed out and the empty dish was re-weighed for ash analysis of remaining coal samples.
A graphical analysis of the float-and-sink method and Partition number calculation is shown in figure 3.
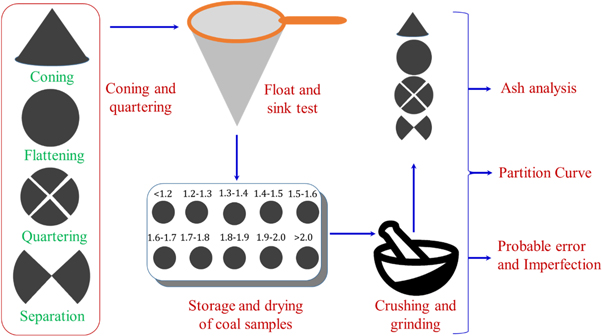
Figure 3. Schematic representation of the float-and-sink method for gravity-based coal separations.
Download figure:
Standard image High-resolution image3. Results and discussion
3.1. Partition number (Y) calculations for coal samples
The partition number (Y) calculations for three different coal samples i.e. heavy media bath, small barrel and big barrel are shown in tables 1–3 and the partition curves are shown in figure 4.
Table 1. Partition number calculation for a two-product stream for feed to heavy media bath.
| % of Weight | % of Feed | ||||||
|---|---|---|---|---|---|---|---|
| Relative Density (g cc−1) | Float | Reject | Float | Reject | Calculated Feed | Relative Density | Partition number (Y) |
| <1.2 | 0 | 0 | 0 | 0 | 0 | 0 | |
| 1.2–1.3 | 6.61 | 0 | 3.9084 | 0 | 3.908 49 | 1.25 | 0 |
| 1.3–1.4 | 38.52 | 0.007 | 22.776 | 0.0028 | 22.779 73 | 1.35 | 0.000 12 |
| 1.4–1.5 | 45.8 | 0 | 27.081 | 0 | 27.081 54 | 1.45 | 0 |
| 1.5–1.6 | 8.96 | 28.14 | 5.2980 | 11.500 | 16.798 86 | 1.55 | 0.684 61 |
| 1.6–1.7 | 0.1 | 9.13 | 0.0591 | 3.7314 | 3.790 56 | 1.65 | 0.984 40 |
| 1.7–1.8 | 0 | 4.63 | 0 | 1.8922 | 1.892 28 | 1.75 | 1 |
| 1.8–1.9 | 0 | 29.71 | 0 | 12.142 | 12.142 47 | 1.85 | 1 |
| 1.9–2.0 | 0 | 5.56 | 0 | 2.2723 | 2.272 37 | 1.95 | 1 |
| > 2.0 | 0 | 22.83 | 0 | 9.3306 | 9.330 62 | 1 | |
Table 2. Partition number calculation for a two-product stream for feed to small barrel.
| % of Weight | % of Feed | ||||||
|---|---|---|---|---|---|---|---|
| Relative Density (g cc−1) | Float | Reject | Float | Reject | Calculated Feed | Relative Density | Partition number(Y) |
| <1.2 | 2.111 | 0 | 1.2482 | 0 | 1.248 23 | 0 | |
| 1.2–1.3 | 16.884 | 0.166 | 9.9835 | 0.0678 | 10.051 35 | 1.25 | 0.006 74 |
| 1.3–1.4 | 24.544 | 2.123 | 14.512 | 0.8676 | 15.380 53 | 1.35 | 0.056 41 |
| 1.4–1.5 | 29.442 | 3.576 | 17.409 | 1.4615 | 18.870 56 | 1.45 | 0.077 44 |
| 1.5–1.6 | 15.169 | 5.505 | 8.9694 | 2.2498 | 11.219 32 | 1.55 | 0.200 53 |
| 1.6–1.7 | 11.501 | 4.398 | 6.8005 | 1.7974 | 8.598 00 | 1.65 | 0.209 05 |
| 1.7–1.8 | 0.073 | 7.471 | 0.0431 | 3.0534 | 3.096 56 | 1.75 | 0.986 06 |
| 1.8–1.9 | 0.095 | 14.339 | 0.0561 | 5.8603 | 5.916 52 | 1.85 | 0.990 50 |
| 1.9–2.0 | 0.06 | 10.497 | 0.0354 | 4.2901 | 4.325 60 | 1.95 | 0.991 79 |
| > 2.0 | 0.116 | 51.925 | 0.0685 | 21.221 | 21.290 33 | 0.996 77 | |
Table 3. Partition number calculation for a two-product stream for feed to big barrel.
| % of Weight | % of Feed | ||||||
|---|---|---|---|---|---|---|---|
| Relative Density (g cc−1) | Float | Reject | Float | Reject | Calculated Feed | Relative Density | Partition number(Y) |
| <1.2 | 2.441 | 0 | 1.4433 | 0 | 1.443 36 | 0 | |
| 1.2–1.3 | 11.881 | 0.916 | 7.0252 | 0.3743 | 7.399 60 | 1.25 | 0.050 59 |
| 1.3–1.4 | 29.689 | 1.435 | 17.555 | 0.5864 | 18.141 59 | 1.35 | 0.032 32 |
| 1.4–1.5 | 21.789 | 5.504 | 12.883 | 2.2494 | 15.133 32 | 1.45 | 0.148 64 |
| 1.5–1.6 | 16.234 | 8.761 | 9.5991 | 3.5806 | 13.179 78 | 1.55 | 0.271 67 |
| 1.6–1.7 | 10.721 | 12.061 | 6.3393 | 4.9293 | 11.268 65 | 1.65 | 0.437 43 |
| 1.7–1.8 | 4.033 | 11.661 | 2.3847 | 4.7658 | 7.150 56 | 1.75 | 0.666 50 |
| 1.8–1.9 | 2.21 | 15.162 | 1.3067 | 6.1967 | 7.503 48 | 1.85 | 0.825 84 |
| 1.9–2.0 | 0.42 | 5.336 | 0.2483 | 2.1808 | 2.429 16 | 1.95 | 0.897 76 |
| > 2.0 | 0.486 | 39.17 | 0.2873 | 16.008 | 16.296 15 | 0.982 36 | |

Figure 4. Partition curves for feed to 'heavy media bath, 'big barrel' and 'small barrel'.
Download figure:
Standard image High-resolution image
3.2. Probable error (Epm ) and imperfection (I) calculations
To measure the sharpness with which the coal and impurities were separated for the three coal samples, the Probable Errors and Imperfections were calculated and shown in table 4.
Table 4. Probable Error and Imperfection calculations of coal samples.
| d25 | d50 | d75 | Epm | I | |
|---|---|---|---|---|---|
| Heavy Media Bath | 1.4911 | 1.5240 | 1.5637 | 0.0363 | 0.0692 |
| Small Barrel | 1.7935 | 1.6788 | 1.5336 | 0.1299 | 0.1915 |
| Big Barrel | 1.6540 | 1.6878 | 1.7200 | 0.0330 | 0.0479 |
3.3. Ash content
The ash content (wt. %) of three different types of coal samples i.e. heavy media bath, small barrel and big barrel are listed in table 5.
Table 5. Ash analysis of coal samples.
| Ash content (wt. %) | |||
|---|---|---|---|
| Relative density | Heavy media bath | Small barrel | Big barrel |
| 1.2–1.3 | 13.58 | 8.67 | 8.56 |
| 1.3–1.4 | 20.16 | 15.66 | 23.65 |
| 1.4–1.5 | 30.74 | 25.42 | 31.29 |
| 1.5–1.6 | 37.58 | 34.55 | 33.08 |
| 1.6–1.7 | 43.88 | 41.7 | 47.4 |
| 1.7–1.8 | 51.11 | 48.37 | 50.45 |
| 1.8–1.9 | 59.01 | 55.84 | 64.18 |
| 1.9–2.0 | 62.67 | 60.71 | 64.59 |
| > 2.0 | 71.93 | 70.37 | 73.16 |
4. Conclusion
In this study, a systematic and relatively simple experimental procedure has been proposed to conduct float-and-sink tests to separate different coal samples on the basis of their specific gravity. An intuitive method to calculate 'Partition number' and independent parameters such as 'Probable Error (Epm )' and 'Imperfection (I)' were calculated to estimate the efficiency of different equipment for application to a specific coal reserve. From the partition curves, it was observed that there is a tendency for the curve to steepen as the density of separation decreases. In other words, separations at lower density tend to be sharper than separations at higher density. These parameters can be used for measuring the technical efficiency of a cleaning unit and evaluating the effectiveness of various beneficiation equipment used for upgradation of quality of coal received from different coal mines.
Acknowledgments
The authors express their sincere gratitude to 'The Institution of Engineers (India)' for funding the project and to the Mahanadi Coalfields Limited for proving the coal samples for this study.
Data availability statement
All data that support the findings of this study are included within the article (and any supplementary information files).