
Abstract
Inconel 825 is a prominent Ni-Fe-Cr based superalloy finds application in aerospace, defense, automotive, nuclear, marine industries. This article investigates 'weld strength' and 'weld bead characteristics' of Inconel 825 weld specimens welded using the gas tungsten arc welding (GTAW) process. The welding speed (V), welding current (I), gas flow rate (GFR) and arc length (N) are considered as GTAW parameter and their effect has been examined on the weld characteristics. Welding speed and welding current has been identified as the most influential factor on process characteristics. Increased heat input from increased welding current and decreased welding speed initially improves weldment penetration (P) and ultimate tensile strength (UTS). However, at the highest heat input condition, the formation of root cracks is observed, resulting in nominal weld strength deterioration. To obtain a favorable parameters setting that satisfies both the criterion simultaneously i.e. maximizing weld strength for optimum weld bead geometry, a hybrid optimization approach employing desirability function coupled with grey relational analysis (DF-GRA) is proposed. Satisfying all the objectives simultaneously, the approach provides an optimum weld parameters setting of (I3−V1−GFR2−N1:120 A−180 mm min−1−9 l/min−2 mm) resulting an improvement of 4.15% in penetration (P), 5.12% in front width (W), 19.74% in reinforcement (R), 1.29% in ultimate tensile strength (UTS), and 2.9% in percentage elongation (%E) on validation. Upon comparison, the algorithm outperforms the optimization results of both DF and GRA approach suggesting its robust nature. Overall, the DF-GRA hybrid approach is found simple and effective that includes the ignored robustness of the desirability approach.
Export citation and abstract BibTeX RIS
1. Introduction
Inconel 825 (primarily composed of nickel, iron, and chromium) is a prominent Ni-based super-alloy that possesses improved mechanical properties, and corrosive resistance characteristics at elevated temperatures. Inconel 825 finds applications in tank trucks, piping and vessels, propeller shafts, calorifiers, hot vessels, marine exhaust systems, and power station ash hoppers. They are also used for making different components in aerospace, chemical, process, and nuclear power industries [1, 2]. The fabrication of components using Inconel 825 is challenging work especially due to weldability related difficulties like poor penetration, micro-fissuring in the weld zone, and heat-affected Zone (HAZ), loss of strength in HAZ, and poor ductility are found common [1]. However, study suggests that an appropriate heat input and cooling rate may eliminate these undue difficulties during welding of nickel-based alloys [3, 4].
In the manufacturing industries, Inconel 825 super-alloys are welded using various traditional and non-traditional welding techniques. The quality of the weld bead profile and its strength varies in almost all welding methods. GTAW and Gas metal arc welding (GMAW) are the two prominent fusion welding processes used for joining these alloys. Higher energy density beam welding technique like laser beam welding (LBW) and electron beam welding (EBW) are some another attractive options [1]. Several researchers have investigated these welding processes, especially in the GTAW process. GTAW is a very popular and versatile multi-response, multi-factor arc welding technique, mainly preferred for its high quality, low distortion welds that are free from spatters [5, 6]. The influence of GTAW process parameters such as welding heat input, gas flow rate, arc length, arc angle, heat treatment of material etc affects significantly on the resultant weld bead geometry, mechanical as well as metallurgical properties. For instance, the welding heat input if generally governed by parameters such as welding current, speed and voltage which is critical in determining the weld quality [2, 7]. Moreover, gas flow rate is one another parameter that not only prevents the weld pool from contamination but helps significantly in determining the shape of weld pool, rate of metal transfer, arc stability, rate of formation of fumes etc Selection of appropriate shielding gas is also considered in terms of suitable weld quality [8, 9]. Thus, study concerning these parameters for optimal weld quality is the need of the hour.
Sujai and Ramkumar (2019) performed GTAW experimentation on Incoloy 925 in direct age and as-welded conditions. Direct aging of specimens have resulted an improvement in tensile strength of about 40% than in as-received condition [10]. Cortés et al (2018) evaluated the mechanical properties of Inconel 718 weldments welded using GTAW process. A significant reduction of mechanical strength was observed due to the partial dissolution of strengthening precipitates in HAZ [11]. Wang et al (2018) studied the effect vibration-assisted GTAW process on the microstructure of Inconel 601H alloy weldments. Mechanical vibration having low-frequency have results in substantial grain refinement and helps in preventing the hot cracking tendency of Inconel 601H weldments [12]. The impact of heat input on the metallurgical and mechanical characteristics of alloy GH 3039 weldments were studied by Chen et al (2020) during GTAW process. The microstructure of the weld bead is largely affected by welding heat input, while the change in columnar grain growth is due to change in the temperature gradient direction [13]. Tork and malekan studied the influence of heat input including gas flow rate on quality and porosity formation rate while GTAW of C70600 copper-nickel alloy. Optimal control over heat input and flow rate is suggested [14]. The influence of shielding gas flow rate and oxygen with argon gas mixture is studied by Zhang et al for improved penetration in activated-TIG welded SUS304 weldments. Lower oxygen flow rate is suggested for better penetration [15]. The effect of arc pressure employing different shielding gas mixture (Ar-Ar and Ar-He) on weld quality was studied by Daia et al; maximum arc pressure is produced by alternating the argon supply [16]. Choudhury et al (2020) conducted an investigation to access the impact of GTAW parameters on UTS of the Inconel 825 weldments. Appropriate heat input with an apt control over welding speed is essential to achieve superior weld strength. The study also addressed the effect of modeling and optimization tool in welding practice [17].
During welding, it is crucial to have weld quality that is identical to the parent metal. The weld quality can be achieved by selecting optimal weld parameter settings, which is only possible by optimizing the welding process parameters. Multi-criteria decision-making (MCDM) approach such as analytic hierarchy process (AHP), grey relational analysis (GRA), technique for order preference by similarity to ideal solution (TOPSIS), etc has shown great potential in solving various single and multi-response optimization problems in the welding domain. These processes were further integrated with approaches such as Taguchi method, fuzzy logic (FL), etc to enhance their robustness in finding the optimal solution [18]. An integrated methodology combining Taguchi approach with GRA is proposed by Krishnan, and Subramaniam (2018) to optimize friction stir welding (FSW) parameters. The influence of rotational speed is found significant (40.50%) while considering weld strength as response parameters [19]. In another study, GRA, and TOPSIS approach were used by Srinivasa et al (2018) to optimize the GTAW parameters while welding 15CDV6 alloy. The optimal solution obtained using the TOPSIS approach is found superior compared to the GRA approach [20]. The same approaches were used by Sameer and Birru (2019) to optimize the FSW process parameters for optimum weld strength of DP600 and AA6082-T6 dissimilar joint weldments [21]. Sarkar et al (2014) proposed a hybrid approach combining Taguchi approach with grey-fuzzy to optimize the submerged arc welding parameters for maximum strength of AISI 1515 grade steel weldments [22]. Bandhu et al (2020) integrated satisfaction function approach with the Taguchi optimization approach to optimize RMDTM welding of A387 grade 11 steel. The approach demonstrates superior capabilities in accessing a correlation between the RMDTM welding parameter and the responses i.e. penetration and HAZ area [23]. Devaraj et al (2021) developed a Taguchi-GRA approach to optimize dissimilar GMAW parameters for optimal dilution percentage and weld bead geometry [24].
Furthermore, Desirability function analysis (DFA) and Desirability graphical analysis (DGA) are statistical optimization techniques used to optimize various welding process parameters in various welding processes for optimum welding strength and weld bead shape. Pandiyarajan et al (2019) used the DGA approach to simultaneously optimize friction stir welded (FSW) parameters in welding a hybrid ZrO2-C- AA 6061 Composites, whilst Yamin et al (2020) implemented the same method to maximise the tensile strength of FSW welded AA7075 weldments [25, 26]. Senthil et al (2020) used the DFA approach for optimizing FSW process factors for the optimum mechanical properties of Al6063-T6 joints [27]. Ola et al (2019) implemented same methodology to optimize the pulsed-cold metal transfer (P + CMT) process for optimal bead geometry [28]. In these respective studies, the desirability approaches are found to be robust and efficient in finding the optimal solution in a cost effective manner. Farzadi et al (2017) applied response surface methodology (RSM) based modeling and optimization approach to optimize various welding factors for optimum weld strength and weld bead geometry [29]. Koli et al (2021) used integrated principal component analysis (PCA)-GRA-RSM approach to for multi optimization of dissimilar CMT welding process. The approach is found adequate in locating the optimal parametric combination satisfying each response [30].
The literature studied demonstrates the use of many conventional and hybrid optimization techniques to optimize the different process variables of the different welding processes. However, an attempt to combine 'desirability function (DF)' with 'grey relational analysis (GRA)' for multi-response optimization of welding variables for an optimal parameter setting is seldom reported in the studied literature. This work, therefore, intended to optimize the GTAW process parameters while welding Inconel 825 using the hybrid Desirability function-Grey Relational Analysis (DF-GRA) optimization approach to establish a definite correlation between the weld strength and weld bead geometry of the weldments. The significance and adequacy of the established approach was further addressed with the help of a statistical tool and appropriate comparison. Additionally, the influences of GTAW variables on quality characteristic are studied.
2. GTAW welding investigation
In the current investigation, Inconel 825 strips of 75 × 60 × 2.5 mm are used as work material. Four important GTAW parameters i.e. Welding current (I), gas flow rate (GFR), Welding speed (V), and arc length (N), were chosen based on various literature for welding the Inconel strips [2, 3, 31, 32]. The working range of these parameters is obtained by conducting a series of bead-on-plate pilot experiments. The results obtained from the trial runs are recorded and range for each process parameters are finalized as shown in table 1.
Table 1. GTAW variables and working ranges.
| Parameters | Welding current | Welding speed | Arc length | Gas flow rate |
|---|---|---|---|---|
| Unit | (Ampere) | (mm min−1) | (mm) | (l/min) |
| Level 1 | 80 | 180 | 2.0 | 6 |
| Level 2 | 100 | 205 | 2.5 | 9 |
| Level 3 | 120 | 230 | 3.0 | 12 |
The full factorial design of experiments having four parameters each at three levels requires 81 (34) trails. Hence, RSM based Box-Behnken design (BBD) of experiment with 27 experimental runs is considered for this investigation. The GTAW experiments were carried out according to the design matrix by varying four process parameters in various combinations. The figure 1 depicts the experimental setup, while [17] summarises the experimental approach followed during this welding examination. In this investigation, a 2% thoriated tungsten electrode of 2.5 mm diameter having conical shape with angle 45° is considered for welding the Inconel 825 weldments. The gas outlet pressure is kept constant in range varies from 0.02 Mpa to 0.05 Mpa for gas flow rates ranging from 6 to 12 l/min.

Figure 1. GTAW setup.
Download figure:
Standard image High-resolution image2.1. Measurement of responses
After conducting welding experiments, the specimens were cut using a wire cut EDM as per the standard shown in figure figure 2(a). The samples considered for macro structural studies are initially polished using emery paper and are etched by swabbing for 10 s in a solution of 5 ml HCl, 7.5 ml HNO3, and 5 ml acetic acid. Three weld bead parameters (i.e., P, front width (W) and reinforcement (R) are measured and analysed using a Carl Zeiss Stereomicroscope. The measurement of weld bead geometry was carried in a preloaded software package that comes with the stereomicroscope.

Figure 2. (a) Cut layout of Specimen for different testing, (b) Tensile testing specimen.
Download figure:
Standard image High-resolution imageFor the tensile test, the specimens were initially prepared in accordance with the ASTM E8M standard, figure 2(b). The experiments were carried out in the air on INSTRON 8801 hydraulic dynamic testing machine with a cross-head speed of 1 mm min−1. The UTS values for all samples were extracted directly from the measured data while the percentage elongation (%E) for the welded specimens is evaluated using the relation given in equation (1).

where Lf is the final gauge length after extension and Lg is the original gauge length. The tensile testing of base metal recorded UTS of 648.311 MPa with an elongation of 54.8%. However, the highest UTS for the welded samples are 670.016 MPa implying the superior mechanical property in the welded sample as compared to the parent metal. The complete results obtained are presented in table 2.
Table 2. Experimental results.
| Sl. No. | Weld parameters | Response characteristics | |||||||
|---|---|---|---|---|---|---|---|---|---|
| I (A) | V (mm min−1) | N (mm) | GFR (l/min) | P (mm) | R (mm) | W (mm) | UTS (MPa) | %E | |
| 1 | 100 | 205 | 2.5 | 9 | 2.248 | 0.188 | 4.925 | 646.531 | 40.0 |
| 2 | 80 | 205 | 3.0 | 9 | 1.970 | 0.496 | 4.085 | 258.770 | 8.00 |
| 3 | 100 | 180 | 2.0 | 9 | 2.482 | 0.108 | 4.918 | 575.412 | 37.5 |
| 4 | 100 | 205 | 2.5 | 9 | 2.248 | 0.188 | 4.925 | 646.531 | 40.0 |
| 5 | 100 | 230 | 3.0 | 9 | 2.023 | 0.261 | 4.477 | 359.255 | 16.0 |
| 6 | 80 | 205 | 2.0 | 9 | 2.094 | 0.492 | 3.528 | 215.419 | 7.50 |
| 7 | 100 | 180 | 3.0 | 9 | 2.538 | 0.201 | 5.104 | 546.509 | 36.5 |
| 8 | 120 | 180 | 2.5 | 9 | 2.525 | −0.08 | 6.796 | 626.740 | 43.0 |
| 9 | 100 | 230 | 2.0 | 9 | 2.272 | 0.303 | 5.133 | 548.562 | 31.5 |
| 10 | 120 | 230 | 2.5 | 9 | 2.241 | 0.498 | 5.853 | 615.091 | 44.5 |
| 11 | 80 | 205 | 2.5 | 6 | 1.443 | 0.587 | 4.262 | 299.298 | 9.50 |
| 12 | 100 | 205 | 2.0 | 12 | 2.089 | 0.506 | 4.769 | 578.362 | 35.0 |
| 13 | 120 | 205 | 2.5 | 6 | 2.687 | 0.402 | 6.365 | 581.369 | 35.5 |
| 14 | 100 | 180 | 2.5 | 6 | 2.684 | 0.172 | 5.915 | 639.401 | 52.5 |
| 15 | 80 | 205 | 2.5 | 12 | 1.614 | 0.687 | 4.393 | 292.648 | 9.00 |
| 16 | 80 | 180 | 2.5 | 9 | 1.451 | 0.772 | 4.511 | 407.712 | 18.5 |
| 17 | 100 | 205 | 2.5 | 9 | 2.106 | 0.096 | 4.087 | 502.176 | 26.8 |
| 18 | 100 | 230 | 2.5 | 6 | 2.047 | 0.195 | 5.165 | 391.215 | 19.5 |
| 19 | 100 | 205 | 2.0 | 6 | 2.587 | 0.120 | 4.614 | 480.025 | 26.0 |
| 20 | 100 | 230 | 2.5 | 12 | 1.959 | 0.233 | 4.438 | 431.468 | 22.0 |
| 21 | 100 | 205 | 3.0 | 6 | 2.287 | 0.224 | 5.057 | 521.837 | 28.5 |
| 22 | 120 | 205 | 3.0 | 9 | 2.353 | 0.261 | 5.968 | 536.814 | 30.0 |
| 23 | 100 | 205 | 3.0 | 12 | 2.283 | −0.15 | 4.407 | 504.707 | 27.0 |
| 24 | 120 | 205 | 2.5 | 12 | 2.506 | 0.137 | 6.239 | 657.437 | 57.0 |
| 25 | 120 | 205 | 2.0 | 9 | 2.528 | 0.233 | 6.284 | 670.016 | 58.5 |
| 26 | 80 | 230 | 2.5 | 9 | 1.201 | 0.405 | 3.680 | 233.841 | 7.80 |
| 27 | 100 | 180 | 2.5 | 12 | 2.309 | 0.177 | 5.133 | 562.690 | 36.5 |
3. Hybrid desirability function-grey relational analysis (DF-GRA) optimization approach
In 1965, Harrington proposed the theory of desirability. Since then, the approach has become an essential element of the manufacturing industries for optimising various single and multi - response characteristics. The desirability function compares responses to several quality criterion scales and maps them to the [0−1] scale [33].
Grey relational analysis was introduced by Deng as a concept of grey system theory in 1982 [34]. This process is highly suitable for decision-making problems and can be used to solve various complex multi-factor-multi-response problems in the different manufacturing domain. Its powerful ability to identify complex relationships in very limited datasets makes it ideal over many statistical methods. The grey relational analysis method integrates all the performance attributes into a single attribute while solving different optimization problems [35].
In this work, the weld parameters were optimized using combined desirability function (DF) and grey relational analysis (GRA) optimization approach. The hybrid optimization technique includes robustness, which otherwise is neglected in the desirability approach. The approach can effectively use to solve multiple attribute decision making problems having complex inter-relationship between numerous input and output variables. This technique combines to optimize the required weld parameters by finding individual desirability, desirability grey relational coefficient (DGRC), and desirability grey relational grade (DGG). The various steps of the optimization approach are described below and are represented as shown in figure 3.
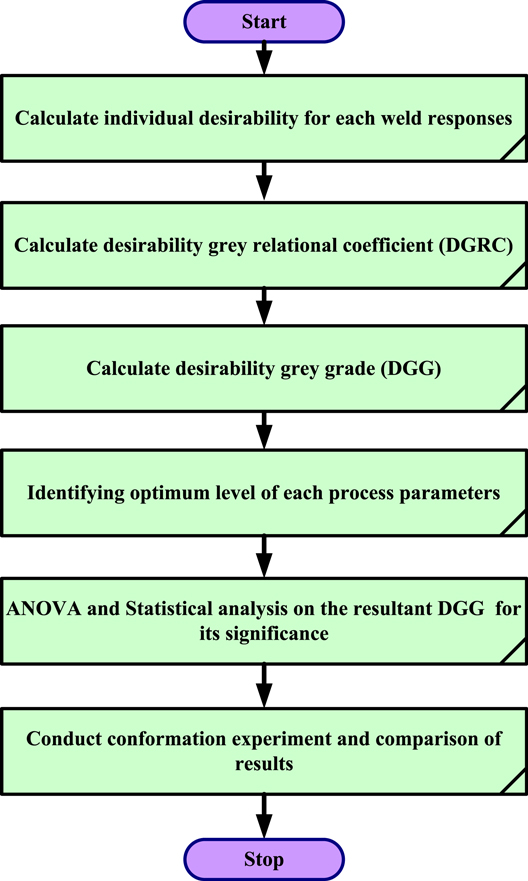
Figure 3. Desirability Grey relational analysis optimization methodology.
Download figure:
Standard image High-resolution imageStep 1: Calculate individual desirability (di (Ŷi )) values corresponding to each response (Ŷi (k)) using equations (2)–(3) depending upon their objective function (minimize or maximize). This normalizes the value of each response and maps them in a desirability value of [0−1]; di (Yi ) = 0 represents a completely undesirable value while di (Yi ) = 1 represents a completely desirable value of Ŷi (k).
For larger-the-better (maximize) characteristics, the individual desirability can be calculated by using the equation (2).

For smaller-the-better quality characteristics, the individual desirability can be calculated by using the equation (3).

Here, exponent s and t are weight fields. Ti
is the target value of the response under consideration, Li
is lowest value, and Ui,
is highest value in such a way that Li
 Ti
Ti
 Ui..
Ui..
Step 2: Calculate desirability grey relational coefficient (γ) using equation (4). It determines the correlation among the ideal (best) and actual desirability index obtained from experimental results.

where, I = 1, 2.....,m; k = 1,2.......,n; m is the number of experiments and n is the number of responses;  is the deviation sequence i.e. the absolute value of the difference between
  and
and  Here
Here  = 1 is the reference sequence and
  is the specific comparison sequence.


ξ = Distinguishing Coefficient whose value is taken to be 0.5.
Step 3: Calculate desirability grey relational grade (DGG) for each experimental trial using equation (5).

Step 4: Identify the optimal level of parameters based on the desirability DGG value. The main effect of each weld parameters was further evaluated based on the DGG values at different levels using equation (6).

Step 5: Perform analysis of variance (ANOVA) and regression analysis on the resultant desirability grey relational grade to test its significance and to ascertain the significant process factor affecting it.
Step 6: Conduct confirmation test on the optimal level for validation and to determine the vitality of the proposed approach by comparing the results with other optimization approach.
4. Results and discussion
4.1. Influence of GTAW parameters on the quality characteristics
In welding, weld quality primarily governed by the weld bead geometry and mechanical properties of the weld. The cross-section of weld bead governs the residual stresses and distortion induced while the bead geometry determines the mechanical properties of the weld [6, 7]. The cross-section of weld bead mainly comprise of parameters namely penetration (P), front height or reinforcement (R), front width or width of the weld (W), weldment area (A), back height or root penetration (Rp ), etc as shown in figure 4; properties such as UTS, %E, hardness (H), yield strength (YS), etc ensure the mechanical properties of the weld. These quality characteristics are largely governed by the influence of weld input parameters namely I, V, GFR, N, voltage, gas concentration etc Each of this input parameter has its unique contribution on a good quality weld which is generally characterize having of optimal weld bead geometry with superior metallurgical and mechanical properties and is free from welding defects [36, 37]. To understand the influence of the GTAW parameters on weld quality characteristics, macrostructural investigation is initially carried out. Furthermore, graphical analysis was conducted to study the influence of individual GTAW parameters on three weld bead parameters (P, R, and W) and two mechanical properties (UTS and %E) of the weld.
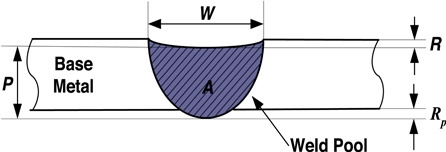
Figure 4. Weld bead geometry.
Download figure:
Standard image High-resolution image4.1.1. Macrostructural Investigation
Macrostructural investigation is carried out to demonstrate the effect of GTAW parameters on resultant characteristics under three different heat input conditions: lowest (80 A, 230 mm min−1 (Sample 26), medium (100 A, 205 mm min−1 (Sample 1), and high (120 A, 180 mm min−1 (Sample 8). Lack of penetration (1.201 mm) is observed at the lowest heat input condition (figure 5(a)). This lack of penetration is due to lower amount of molten metal in the weld pool caused by the lower heat input per unit length. At medium heat input (figure 5(b)), nominal lack of penetration (2.248 mm) is observed. Again at highest heat input condition (figure 5(c)), full penetration (2.525 mm) is observed. This nominal lack of penetration to complete penetration is due to the higher heat input per unit area which accommodates more amount of molten metal in the weld pool. Furthermore, visual inspection of the welded sample indicates that there are no defects such as microfissuring, surface porosity, or any other type of cracks when welded at low to medium heat input conditions. However, the presence of a root crack/solidification crack is observed at the highest heat input condition. This decreases weld strength of the weldment to a certain extent. Thus, an appropriate heat input is obligatory for weldment of higher strength and weld bead geometry that are free from welding defects. The presence of a 'root crack' is caused by a low initial current or by hydrogen embrittlement [7, 30]. This type of flaw can be avoided by using a higher initial current setting and the appropriate filler material.
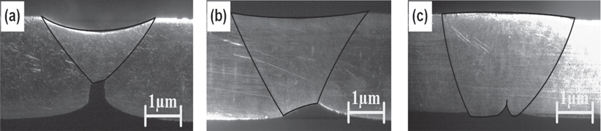
Figure 5. Macrostructure of GTAW samples at heat input (a) lowest, (b) medium, and (c) highest condition.
Download figure:
Standard image High-resolution image4.1.2. Influence of welding current
Welding current is considered as the most influential process factor on the quality characteristics as it controls the deposition rate, amount of molten metal melted, heat affected zone, depth of penetration, and distortion of the weldment [38]. The impact of I on the bead geometry and mechanical properties are studied and are illustrated in figures 6(a) and (b) respectively. It is observed that P and W increases and R decreases with an increase in I. The UTS and %E also increases with an increase in I. The higher setting of I ensures higher energy density from the source to the workpiece. This higher energy density per unit length raises the temperature and thus the amount of molten metal in the weld pool, leading in keyhole mode energy deposition [37]. This results in higher P in the weldments which further increase the UTS and %E. The increase in %E may also due to the homogeneous distribution of particle which results in higher stress-strain up to yield point [39]. The decrease in R with an increase in I is also found beneficial as it eliminates the tendency of the underfill of the weldments.
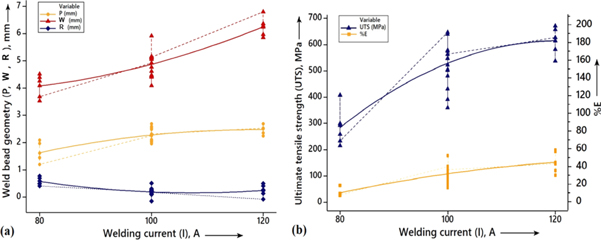
Figure 6. Impact of I on: (a) bead geometry, (b) mechanical properties of the weld.
Download figure:
Standard image High-resolution image4.1.3. Influence of welding speed
Welding speed has a reverse effect on the weld bead parameters. With an increase in V for specific I and voltage, the heat input per unit length decreases. This reduces the amount of weld metal or filler melted which subsequently reduces the shape of the weld bead resulting in lower P and width of the weld [39, 40]. The same observation is evident where W and P decrease with an increase in V as presented in figure 7(a). The R has a negative effect due to the increase in V resulting underfill in the weldments. The UTS of the weldment also tends to decrease with an increase in V as shown in figure 7(b). This is mainly due to the decreased P at higher speed, which causes underfill in the weldments. The effect of V on the %E is found negligible.
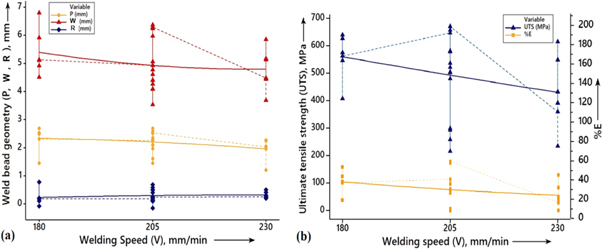
Figure 7. Impact of V on: (a) bead geometry, (b) mechanical properties of the weld.
Download figure:
Standard image High-resolution image4.1.4. Influence of arc length
In general, the N ensures the supplied voltage which determines the cross-section of the weld bead. With an increase in N for a constant V and current, voltage increases which produces a wider, flatter, and less penetrated weld bead [38]. Here, P and UTS decrease with an increase in N as shown in figures 8(a) and (b) respectively. As expected, the W of the weld increases with an increase in N resulting in a wider weld bead. Only a marginal effect of N is observed on R and %E of the weldments.

Figure 8. Impact of N on: (a) bead geometry, (b) mechanical properties of the weld.
Download figure:
Standard image High-resolution image4.1.5. Influence of gas flow rate
The type of shielding gas and the rate at which gas is supplied to the weld pool influences the shape and defects of the weld bead. The shielding gas with higher thermal conductivity generally ensures better P [36]. However, only a nominal effect of GFR is evident on both weld bead geometry and mechanical properties of the weld as illustrated in figures 9(a) and (b). There is only a slight reduction in W and P is observed with an increase in GFR.

Figure 9. Impact of GFR on: (a) bead geometry, (b) mechanical properties of the weld.
Download figure:
Standard image High-resolution image4.2. Multi-response optimization using DF-GRA
In this study, multi-response optimization of GTAW performance characteristics is carried out using Desirability Grey relational analysis. To optimize process parameters, the objective function for each response is defined as:
Maximize Penetration (I, V, GFR, N)
Minimize Front width (I, V, GFR, N)
Minimize Reinforcement (I, V, GFR, N)
Maximize Ultimate tensile strength (I, V, GFR, N)
Maximize Percentage elongation (I, V, GFR, N)
Subjected to:

The individual desirability values for each response were initially calculated using equations (equation (2)–(3)) based on their objective function. For each response, the deviation sequence values were further determined. The normalized individual desirability values obtained for each response, along with their deviation sequence, table 3. The desirability grey relational coefficient values were evaluated further using equation (4) and the values were compared with the ideal (best) and actual normalized experimental result. The desirability grey relational grade values are obtained by taking an average of the values of desirability grey relational coefficient (equation (5)) of P, W, R, UTS, and %E. The desirability grey relational grade converts characteristics of multiple objectives into a single objective function using the Desirability Grey relational analysis approach. The rank of each experimental run is further identified based on the desirability grey relational grade value obtained and stated in table 4. The response graph obtained for desirability grey relational grade value for all 27 experimental run are analysed as shown in figure 10. The experimental run 25 produces the highest desirability grey relational grade of 0.807 among the entire 27 experimental runs. This higher desirability grey relational grade corresponding to the experimental results indicates its closeness to the optimal.
Table 3. Individual desirability and deviation sequence.
| Run | Individual desirability | Deviation sequence | ||||||||
|---|---|---|---|---|---|---|---|---|---|---|
| P | R | W | UTS | %E | ∆P | ∆R | ∆W | ∆UTS | ∆%E | |
| 1 | 0.6727 | 0.6688 | 0.6580 | 0.8425 | 0.5510 | 0.3273 | 0.3420 | 0.3333 | 0.1575 | 0.4490 |
| 2 | 0.3410 | 0.2839 | 0.8353 | 0.1607 | 0.0779 | 0.6590 | 0.1647 | 0.7162 | 0.8393 | 0.9221 |
| 3 | 0.8525 | 0.6845 | 0.5659 | 0.7550 | 0.5949 | 0.1475 | 0.4341 | 0.3190 | 0.2450 | 0.4051 |
| 4 | 0.6727 | 0.6688 | 0.6580 | 0.8425 | 0.5510 | 0.3273 | 0.3420 | 0.3333 | 0.1575 | 0.4490 |
| 5 | 0.5335 | 0.6687 | 0.7586 | 0.3447 | 0.1596 | 0.4665 | 0.2414 | 0.3327 | 0.6553 | 0.8404 |
| 6 | 0.3910 | 0.1863 | 0.9614 | 0.0911 | 0.0000 | 0.6090 | 0.0386 | 0.8140 | 0.9089 | 1.0000 |
| 7 | 0.8880 | 0.6955 | 0.4446 | 0.8068 | 0.5737 | 0.1120 | 0.5554 | 0.3074 | 0.1932 | 0.4263 |
| 8 | 0.9168 | 0.8822 | 0.0256 | 0.9444 | 0.8324 | 0.0832 | 0.9744 | 0.1260 | 0.0556 | 0.1676 |
| 9 | 0.7032 | 0.5107 | 0.6223 | 0.6458 | 0.4652 | 0.2968 | 0.3777 | 0.4907 | 0.3542 | 0.5348 |
| 10 | 0.6534 | 0.2634 | 0.2279 | 0.8373 | 0.6801 | 0.3466 | 0.7721 | 0.7370 | 0.1627 | 0.3199 |
| 11 | 0.2764 | 0.2928 | 0.7747 | 0.1903 | 0.1400 | 0.7236 | 0.2253 | 0.7080 | 0.8097 | 0.8600 |
| 12 | 0.7042 | 0.3938 | 0.5975 | 0.7855 | 0.5869 | 0.2958 | 0.4025 | 0.6071 | 0.2145 | 0.4131 |
| 13 | 0.9632 | 0.4562 | 0.0701 | 0.8251 | 0.6047 | 0.0368 | 0.9299 | 0.5465 | 0.1749 | 0.3953 |
| 14 | 0.8882 | 0.6394 | 0.3578 | 0.8641 | 0.6897 | 0.1118 | 0.6422 | 0.3639 | 0.1359 | 0.3103 |
| 15 | 0.2855 | 0.1136 | 0.8374 | 0.1412 | 0.0000 | 0.7145 | 0.1626 | 0.8860 | 0.8588 | 1.0000 |
| 16 | 0.3370 | 0.0017 | 0.7080 | 0.3970 | 0.2716 | 0.6630 | 0.2920 | 0.9979 | 0.6030 | 0.7284 |
| 17 | 0.6727 | 0.6688 | 0.6580 | 0.8425 | 0.5510 | 0.3273 | 0.3420 | 0.3333 | 0.1575 | 0.4490 |
| 18 | 0.5397 | 0.5570 | 0.5514 | 0.4498 | 0.2364 | 0.4603 | 0.4486 | 0.4445 | 0.5502 | 0.7636 |
| 19 | 0.9798 | 0.7862 | 0.6187 | 0.6166 | 0.4350 | 0.0202 | 0.3813 | 0.2148 | 0.3834 | 0.5650 |
| 20 | 0.5269 | 0.5585 | 0.6449 | 0.6203 | 0.4668 | 0.4731 | 0.3551 | 0.4426 | 0.3797 | 0.5332 |
| 21 | 0.7465 | 0.4589 | 0.5031 | 0.6190 | 0.3745 | 0.2535 | 0.4969 | 0.5422 | 0.3810 | 0.6255 |
| 22 | 0.8922 | 0.6328 | 0.3036 | 0.6923 | 0.4740 | 0.1078 | 0.6964 | 0.3699 | 0.3077 | 0.5260 |
| 23 | 0.8034 | 0.8901 | 0.7282 | 0.5339 | 0.3206 | 0.1966 | 0.2718 | 0.1101 | 0.4661 | 0.6794 |
| 24 | 0.7354 | 0.6741 | 0.2114 | 0.9580 | 0.8694 | 0.2646 | 0.7886 | 0.3287 | 0.0420 | 0.1306 |
| 25 | 0.9764 | 0.5614 | 0.1625 | 1.0000 | 0.9217 | 0.0236 | 0.8375 | 0.4417 | 0.0000 | 0.0783 |
| 26 | 0.0965 | 0.4199 | 0.8761 | 0.0000 | 0.0000 | 0.9035 | 0.1239 | 0.5839 | 1.0000 | 1.0000 |
| 27 | 0.6822 | 0.6767 | 0.4682 | 0.7773 | 0.5574 | 0.3178 | 0.5318 | 0.3261 | 0.2227 | 0.4426 |
Table 4. Desirability grey relational coefficient, desirability grey relational grade and rank.
| Run | Desirability grey relational coefficient (DGRC) | Desirability grey relational grade (DGG) | Rank | ||||
|---|---|---|---|---|---|---|---|
| P | R | W | UTS | %E | |||
| 1 | 0.6058 | 0.7318 | 0.6341 | 0.7604 | 0.6093 | 0.6683 | 9 |
| 2 | 0.4249 | 0.5012 | 0.8067 | 0.3733 | 0.4066 | 0.5026 | 23 |
| 3 | 0.7875 | 0.7447 | 0.5708 | 0.6711 | 0.6389 | 0.6826 | 8 |
| 4 | 0.6058 | 0.7318 | 0.6341 | 0.7604 | 0.6093 | 0.6683 | 10 |
| 5 | 0.5140 | 0.7324 | 0.7217 | 0.4328 | 0.4314 | 0.5665 | 20 |
| 6 | 0.4449 | 0.4639 | 1.0000 | 0.3549 | 0.3855 | 0.5298 | 22 |
| 7 | 0.8372 | 0.7554 | 0.5044 | 0.7213 | 0.6243 | 0.6885 | 6 |
| 8 | 0.8822 | 0.9745 | 0.3598 | 0.9000 | 0.8661 | 0.7965 | 2 |
| 9 | 0.6305 | 0.6155 | 0.6079 | 0.5853 | 0.5588 | 0.5996 | 16 |
| 10 | 0.5912 | 0.4928 | 0.4176 | 0.7544 | 0.7053 | 0.5922 | 17 |
| 11 | 0.4015 | 0.5047 | 0.7381 | 0.3818 | 0.4252 | 0.4902 | 25 |
| 12 | 0.6314 | 0.5507 | 0.5910 | 0.6998 | 0.6333 | 0.6212 | 15 |
| 13 | 0.9660 | 0.5826 | 0.3711 | 0.7409 | 0.6459 | 0.6613 | 12 |
| 14 | 0.8374 | 0.7059 | 0.4656 | 0.7863 | 0.7137 | 0.7018 | 5 |
| 15 | 0.4047 | 0.4398 | 0.8092 | 0.3680 | 0.3855 | 0.4814 | 27 |
| 16 | 0.4234 | 0.4069 | 0.6749 | 0.4533 | 0.4707 | 0.4858 | 26 |
| 17 | 0.6058 | 0.7318 | 0.6341 | 0.7604 | 0.6093 | 0.6683 | 11 |
| 18 | 0.5175 | 0.6456 | 0.5619 | 0.4761 | 0.4576 | 0.5317 | 21 |
| 19 | 1.0000 | 0.8534 | 0.6054 | 0.5660 | 0.5430 | 0.7136 | 4 |
| 20 | 0.5103 | 0.6469 | 0.6243 | 0.5684 | 0.5597 | 0.5819 | 18 |
| 21 | 0.6692 | 0.5850 | 0.5343 | 0.5676 | 0.5138 | 0.5740 | 19 |
| 22 | 0.8435 | 0.7010 | 0.4443 | 0.6191 | 0.5636 | 0.6343 | 14 |
| 23 | 0.7279 | 1.0000 | 0.6928 | 0.5175 | 0.4903 | 0.6857 | 7 |
| 24 | 0.6588 | 0.7359 | 0.4122 | 0.9225 | 0.9171 | 0.7293 | 3 |
| 25 | 0.9929 | 0.6475 | 0.3969 | 1.0000 | 1.0000 | 0.8075 | 1 |
| 26 | 0.3483 | 0.5625 | 0.8604 | 0.3333 | 0.3855 | 0.4980 | 24 |
| 27 | 0.6133 | 0.7382 | 0.5160 | 0.6918 | 0.6135 | 0.6346 | 13 |
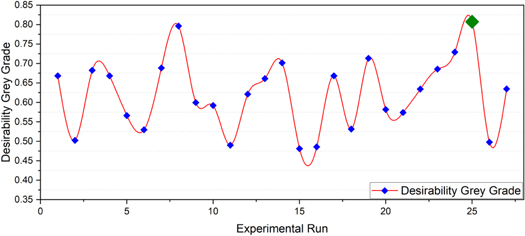
Figure 10. Response graph for desirability grey relational grade.
Download figure:
Standard image High-resolution imageThe main effect of weld parameters on the desirability grey relational grade is calculated using equation (6) at all levels as stated in table 5. The difference between the maximum and minimum values of desirability grey relational grade for each parameter at different levels signifies its effect on the response parameters. The most significant process factor in terms of the entire response characteristic is found to be I (0.2055). The second most significant process factor is observed as V (0.1033) followed by N (0.0505).
Table 5. Response table for DGG.
| Parameters | Mean DGG values | Max-Min | ||
|---|---|---|---|---|
| Level 1 | Level 2 | Level3 | ||
| I | 0.4980 | 0.6391 | 0.7035 | 0.2055 |
| V | 0.6650 | 0.6291 | 0.5617 | 0.1033 |
| GFR | 0.6121 | 0.6259 | 0.6224 | 0.0138 |
| N | 0.6591 | 0.6127 | 0.6086 | 0.0505 |
The optimum combination of the weld parameter is determined on the basis of the highest main effect of the process parameter. The optimum setting of the process parameter is obtained as I3 V1 GFR2 N1 corresponding to 120 A, 180 mm min−1, 9 l/min and 2 mm respectively. The main effect of the process parameters on the resultant desirability grey relational grade are evaluated as illustrated in figure 11.
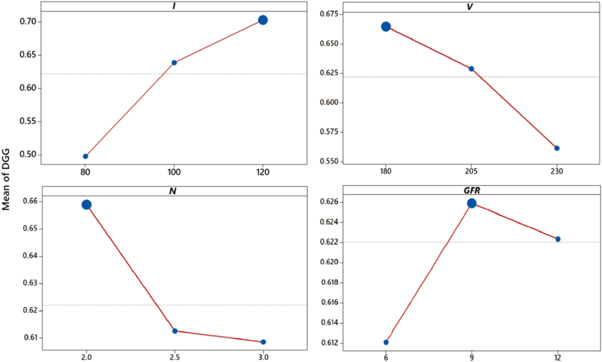
Figure 11. Main effect of parameters on DGG.
Download figure:
Standard image High-resolution image4.3. Statistical significance and analysis of variance on desirability grey relational grade
The DGG value combines each objective of the response parameter to a single value through hybridization using Desirability Function and Grey Relational Analysis. This DGG values obtained needs further evaluation to justify its significance. Hence, ANOVA is conducted to test the statistical significance of the resultant desirability grey relational grade values and to identify the relative influence of the process factors. The developed quadratic model for DGG is represented in equation (8). The results obtained are tabulated in table 6.

Table 6. ANOVA on DGG.
| Source | degrees of freedom | Sum of square | mean square | F-value | p-value | Percentage contribution |
|---|---|---|---|---|---|---|
| Model | 14 | 0.220631 | 0.015483 | 35.99 | 0.000 | |
| I | 1 | 0.126752 | 0.126752 | 294.61 | 0.000 | 56.14 |
| V | 1 | 0.032023 | 0.032023 | 74.43 | 0.000 | 14.18 |
| GFR | 1 | 0.000315 | 0.000315 | 0.73 | 0.409 | 0.14 |
| N | 1 | 0.007636 | 0.007636 | 17.75 | 0.001 | 3.38 |
| I2 | 1 | 0.012969 | 0.012969 | 30.14 | 0.000 | 5.74 |
| V2 | 1 | 0.004949 | 0.004949 | 11.50 | 0.005 | 2.19 |
| GFR2 | 1 | 0.003224 | 0.003224 | 7.49 | 0.018 | 1.43 |
| N2 | 1 | 0.000001 | 0.000001 | 0.00 | 0.973 | 0.00 |
| I*V | 1 | 0.011718 | 0.011718 | 27.24 | 0.000 | 5.19 |
| I*GFR | 1 | 0.001475 | 0.001475 | 3.43 | 0.089 | 0.65 |
| I*N | 1 | 0.005329 | 0.005329 | 12.39 | 0.004 | 2.36 |
| V*GFR | 1 | 0.003446 | 0.003446 | 8.01 | 0.015 | 1.53 |
| V*N | 1 | 0.000380 | 0.000380 | 0.88 | 0.366 | 0.17 |
| GFR*N | 1 | 0.010414 | 0.010414 | 24.21 | 0.000 | 4.61 |
| Lack-of-Fit | 10 | 0.005163 | 0.000516 | 1.20 | 0.377 | 2.29 |
| Pure Error | 2 | 0.000000 | 0.000000 | |||
| Total | 26 | 0.225794 | 100.00 | |||
| R2 = 97.67%, R2 (adj) = 94.96% | ||||||
The quadratic model developed for desirability grey relational grade values is found significant at a confidence level of 95% as the probability value (p-value) of the model is less than 0.05. Also, the p-value in the test of lack-of-fit is 0.377, which is higher than the value of significance (0.05). Hence it is insignificant for the model as desired. The R2 value noted is 97.67% which indicates a higher significance of the model. The R2 (adj) value recorded for the model is 94.96% which suggests the solid relationship between the process factor and the response [41].
Normal probability plot and standardized residual versus fitted value plot are plotted and are represented in figures 12(a) and (b) respectively. The data in the normal probability plot has a normal distribution since all of the standard residual points are closer to the straight line. The data in the standardized residual versus fitted values plot has seen a random distribution which signifies that the model follows a normal and independent pattern. This trend suggests the high adequacy of the model developed.
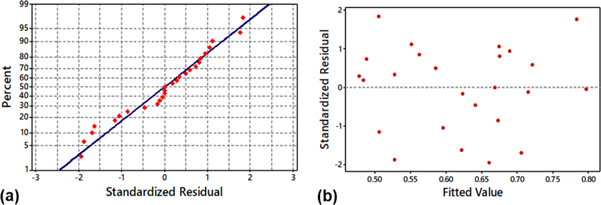
Figure 12. Statistical plots: (a) normal probability plot, (b) standardized residual versus fitted values plot.
Download figure:
Standard image High-resolution imageIn the quadratic model, the percentage contribution for each element is obtained by dividing the sum of the squares of each factor by the total sum of the squares. The percentage contribution obtained for each parameter, their interactions and square terms calculated, as stated in table 8 and shown in figure 13. It is observed that the I has the maximum influence on the response desirability grey relational grade value followed by V and N with a contribution percentage of 56.15% 14.18% and 3.38% respectively. The second-order effect of I, V and N and two-level interactions of I & V, I & N, V & GFR, and GFR & N has also shown some significance on the resultant desirability grey relational grade model as observed in the analysis of variance.

Figure 13. Percentage contribution on desirability grey relational grade.
Download figure:
Standard image High-resolution image4.3.1. Model analysis
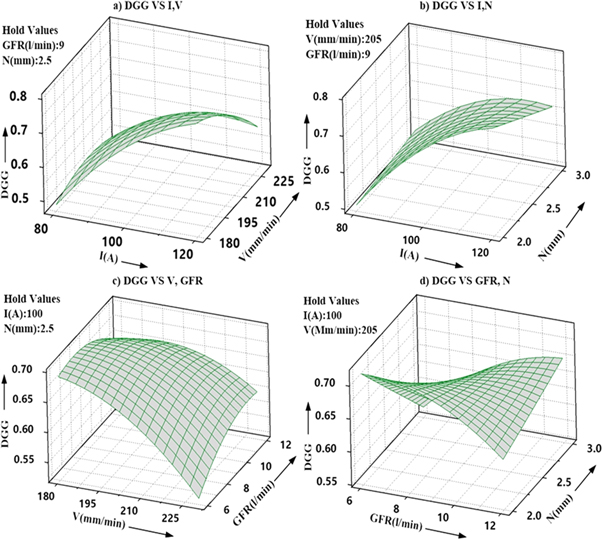
In the model analysis, 3D surface plots are obtained to study the effect of weld variables on the resultant desirability grey relational grade. Four different plots are plotted, figure 14, by considering their significance on the desirability grey relational grade as obtained in analysis of variance. Here, higher desirability grey relational grade value ensures better quality characteristics.
Figure 14. Surface plot for desirability grey relational grade versus (a) I & V, (b) I & N, (c) V & GFR and, (d) GFR & N.
Download figure:
Standard image High-resolution image
In the first plot between desirability grey relational grade and I & V, it is observed that with an increase in I, desirability grey relational grade increases and decreases with an increase in versus The highest desirability grey relational grade value was found when I is at highest and V is at the lowest level. In the second plot between desirability grey relational grade and I & N, the highest desirability grey relational grade value is observed when I is high, and N is at its low level. In the third plot between the desirability grey relational grade and V & GFR, the lowest value recorded when both V is at a high level, and GFR is at a low level. For the same plot, the highest value of desirability grey relational grade is observed when V is at a low level, and GFR is between the lower and middle range. In the last plot between desirability grey relational grade and GFR & N, the highest desirability grey relational grade value is observed when N is at a low level, and GFR is in the range from low to middle. Hence, from all four plot it can be concluded that desirability grey relational grade value will be maximum when I is at a high level (120 A), V and N are at a low level (180 mm min−1 and 2 mm), and GFR is in the range between low and middle (6–9 l/min). This higher current and lower V confirms higher heat input which increases the weld metal deposition rate and hence increases the P. The higher P also confirms the higher weld strength of the welded specimens [36, 37].
4.4. Confirmation experiments and performance evaluation
The validation of the optimization approach is performed by conducting weld experiments at optimal level combination, and improvement in GTAW performance measures is evaluated. The obtained result at the optimal weld parameter settings is compared with the best parameter setting obtained in 27 experiments and improvement in responses is determined as shown in table 7.
Table 7. Result of validation test.
| Description | Best parameter setting in 27 experiments | Optimal Setting using DF-GRA | Improvement (%) |
|---|---|---|---|
| Factors setting | I3 -V2 -GFR2 -N1 | I3 -V1 -GFR2 -N1 | I3 -V1 -GFR2 -N1 |
| P, (mm) | 2.528 | 2.633 | 4.15 |
| W, (mm) | 6.284 | 5.962 | 5.12 |
| R, (mm) | 0.233 | 0.187 | 19.74 |
| UTS, (MPa) | 670.016 | 678.687 | 1.29 |
| %E, (%) | 58.5 | 60.2 | 2.90 |
The results obtained in the conformation experiments at optimal setting (I3 -V1 -GFR2 -N1 ) shows that the P is increased from 2.528 mm to 2.633 mm, W decrease from 6.284 mm to 5.962 mm, the R decreases from 0.233 mm to 0.187 mm, UTS and %E increases from 670.016 MPa to 678.687 MPa and 58.5 to 60.2 respectively. This optimum UTS produced is found higher than the base metal (648.311 MPa). The higher UTS value confirms the superior weld quality provided by using the GTAW process. This higher strength may be due to the presence of strengthening precipitates like Titanium carbide, titanium nitrate and secondary phase precipitates like Al4O3. The percentage improvement for each response in the optimal setting is calculated, and an increase of 4.15% for P, 5.12% for W, 19.74% for R, 1.29% for UTS, and 2.90% for %E is recorded.
The vitality of the DF-GRA algorithm is further checked by comparing with the results of Grey relational analysis (GRA) and Desirability function (DF) analysis. Separate experiments based on optimum parameter setting using GRA and DF is carried out and is stated in table 8 along with the results of DF-GRA algorithm.
Table 8. Comparison of results.
| DF-GRA | GRA | DF | |
|---|---|---|---|
| Overall, fitness function value | 0.7873 | 0.7285 | 0.7328 |
| Optimal parameter setting | I3 -V1 -GFR2 -N1 | I3 -V1 -GFR3 -N1 | I2 -V1 -GFR3 -N1 |
| Optimal responses on validation | |||
| P, (mm) | 2.633 | 2.598 | 2.612 |
| W, (mm) | 5.962 | 6.283 | 6.185 |
| R, (mm) | 0.187 | 0.196 | 0.183 |
| UTS, (MPa) | 678.687 | 667.58 | 658.67 |
| %E, (%) | 60.2 | 58.5 | 56.4 |
The proposed DF-GRA algorithm results in higher fitness function value of 0.7873 when compared with GRA (0.7285) and DF (0.7328) algorithm. This implies that the proposed algorithm is superior to the rest in finding the optimal solution. The optimum result for the responses using DF-GRA also found superior for P (2.633 mm), W (5.962 mm), UTS (678.687 MPa) and %E (60.2%). A superior but nominal R (0.183 mm) is obtained using DF analysis. Overall, a strong correlation is obtained using DF-GRA approach that results in superior weld strength and weld geometry compared to the other two approaches.
5. Conclusions
The present work examines the influence of the GTAW process parameters on the welding bead characteristics and their mechanical strength while welding Inconel 825. A hybrid optimization approach combining the desirability function (DF) approach and grey relational analysis (GRA) is proposed for the optimization of multi-performance characteristics in the GTAW process. The influence of GTAW parameters on the responses was analysed using surface plots. The conclusions drawn are summarized as follows:
- 1.Macrostructural investigation of the welded sample indicates a lack of penetration at low heat input conditions, which is nominal to zero at moderate to high heat input conditions; more heat input per unit area accommodates more molten metal in the weld pool, resulting in higher P.
- 2.The presence of a root crack is observed in a weldment welded at the highest input condition, which may be due to hydrogen embrittlement. An adequate heat input is required for high-strength weldment and defect-free weld bead geometry.
- 3.The I is established as the most influential welding variable on the quality characteristics with a contribution percentage of 56.14%. The next significant variable identified as V followed by N with a contribution percentage of 14.18% and 3.38% respectively. The GFR at 9 l/min is found favorable for all the responses.
- 4.The simultaneous optimization of P, R, W, UTS, and %E employing desirability grey relational analysis (DF-GRA) obtains I3 V1 GFR2 N1 corresponding to 120 A, 180 mm min−1, 9 l/min and 2 mm as the optimum combination of weld parameters. The validation of results shows an improvement of 4.15% for P, 5.12% for W, 19.74% for R, 1.29% for UTS and 2.90% for %E. Coefficient of determination (R2) for the desirability grey relational grade recorded as 97.67% indicating that the proposed hybrid multi-response optimization is simple, robust and effective in optimizing many responses in GTAW on Inconel 825.
- 5.Furthermore, the proposed algorithm outperforms the optimization results of both DF and GRA approaches in terms of the optimization and validation results, suggesting its simple and effective nature which includes the ignored robustness of the desirability approach.
5.1. Future scope
The assessment of detailed metallurgical investigation with respect to the change of parameters, heat input etc is planned. It may further be extended to evaluate sustainability of welding process considering economic, environmental and social aspects of the GTAW process; energy consumption, carbon emission and material/tool wastes as an environmental indicators; cost, productivity and quality as economic indicators; labour health & safety as social indicators of sustainability.
Acknowledgments
The authors acknowledge the authorities of NERIST, Nirjuli, IIT, Kharagpur as well as IIT, Guwahati, for facilitating experimental and testing facilities to conduct the research.
Data availability statement
All data that support the findings of this study are included within the article (and any supplementary files).
Conflict of interest
The authors have no conflicts of interest to declare that are relevant to the content of this article.