
Abstract
Cladding is widely used in manufacturing industries for the production of pressure vessel by depositing thick layer of filler material for providing corrosion resistant-surface. The use of metal cored wire in gas metal arc welding (GMAW) process is popular due to its higher deposition rate and productivity. This work investigates the effect of process parameters on the deposition of cladding layer with ER 309L metal core wire (as filler material) on a corrosion resistant material (IS 2062). The welding parameters viz., wire feed rate (WFR), voltage (V), welding speed (S) and nozzle to plate distance (NTD) are employed as process parameters while penetration (P), bead width (W), reinforcement (R), weld penetration shape factor (WPSF) and weld reinforcement form factor (WRFF) as welding responses. The predictive model developed for P, W, R, WPSF, and WRFF using the response surface methodology (RSM) approach is found adequate at 95% confidence interval. The validation results for the developed model results in a model accuracy (MA) of 92.82%, 96.34%, 91.47% 88.98% and 87.75% for model P, W, R, WPSF, and WRFF respectively and it shows higher predictability and accuracy. The process parameters are optimized simultaneously with integrated optimization approach using RSM with Jaya algorithm and obtain optimal solution in less than 20 number of iterations. The minimum fitness value obtained as 1.3008 at an optimal parameter setting of WFR = 12 m min−1, V = 26 V, S = 280 mm min−1, NTD = 10 mm. The validation result at the optimal parameter setting results in an improvement of 6.45%, 11.29%, 13.58%, 16.07%, 15.38% is noted for P, W, R, WPSF, and WRFF respectively.
Export citation and abstract BibTeX RIS
1. Introduction
Cladding is used for corrosion prone material by coating a thick layer of corrosion resistant material with almost more than 3 mm. For improving the overhauling period of engineering applications such as chemicals, fertilizers, nuclear, food processing, etc, this approach can be used. Different types of welding process which can be used for cladding such as GMAW, gas tungsten arc welding (GTAW), explosive, flux cored arc welding (FCAW). Among these processes GMAW is mostly used in industries due to its high reliability, easy to use, all position capability, higher productivity and high deposition rate [1]. Many researchers have investigated GMAW using solid wire but limited investigations have been carried out with metal cored transfer technique. Khan et al [2] have used pulse current GMAW with ER309L as filler material, trying to investigate cladding on mild steel through stainless steel. From their experimental work, they reported that voltage, pulse current, wire feed rate and pulse frequency were the most vital input parameters for minimum dilution. Kannan et al [1] studied and reported the effect of parameters on clad bead geometry on stainless steel (SS) using GMAW, base material was IS 2062 of mild steel and filler material ER 308L was used in this study. They found that the penetration, reinforcement and bead width increases on increasing wire feed rate while bead width and reinforcement decreases on increasing welding speed. The result shows that the bead width and reinforcement increase on increasing nozzle to plate distance. Murugan et al [3] used IS 2062 as base material, to predict and control the weld bead geometry of pipes in submerged arc welding. They concluded that while increasing the WFR, penetration will increase and with increasing the welding speed, the penetration will decrease. Palani et al [4] worked upon FCAW for predicting the sensitivity analysis in cladding of SS using IS 2062 as base material. They found that reinforcement was more sensitive on speed than other parameters, bead width was controlled by changing the welding current. Palani et al [5] have optimized the weld bead geometry coated with FCAW for stainless steel cladding. They used IS 2062 as a substrate and SS 317L flux cored wire was used as a filler material. They concluded that nozzle-to-plate distance and welding current had a more eminent influence on the coefficient of internal shape than welding speed; confirmation experiment proved that developed models were accurate.
Miniappan et al [6] scrutinize the cladding of stainless steel by using FCAW on mild steel. They selected IS 2062 as base material and SS ER309L flux cored wire was used as cladded material. They found that change in current affects the weld deposition rate and improves the mechanical properties like stiffness, toughness and tensile strength. Murkute et al [7] used powder bed fusion-selective laser melting for the production of corrosion resistant 316L stainless steel clads on 1018 carbon steel. They concluded that at lowest scan speed(100 mm s−1), maximum clad thickness attains and vice-versa. Tanigawa et al [8] investigated laser cladding of Ni-Cr-Si-B alloy to study the effect of particle size on HAZ on C45 carbon steel. They found that the required heat input was decreased as smaller particles were used and that's why the heat affected zone was also reduced. Xu et al [9] studied the impact of powders and process parameters with using C45 as a substrate and iron-nickel based alloy as a clad material in laser cladding remanufacturing. They concluded that the bonding strength with nickel-based powder was found to be lower than that of iron-based powder and the micro hardness of the clad layer was higher than that of substrate. Shahi et al [10] investigated the effect of welding condition on dilution of SS cladding using GMAW, in this study researcher had used AISI 1020 low carbon steel (CS) plate as a substrate and filler material was SS wire 316L of diameter 1.6 mm. They reported that dilution was adversely affected by WFR, voltage and welding speed. The base metal penetration was reduced as filler material was auxiliary preheated in universal-GMAW process, there is a small variation in bead geometry parameters because there is drop in welding current and this may be the reason for reduced dilution in this process. Valsechi et al [11] scrutinize the feature of thermal damage resulting to laser cladding process in martensitic steel substrate as AISI 410 with CO-base powder. They found that the extension of HAZ and height of the clad layer was extremely affected by the heat input. Li et al [12] used stainless/carbon steel bi-metal plate, to find out the influence of base metal on metallographic corrosion of cladding. They reported that the reason behind the excessive corrosion is the existence of substrate that impacts the negative effect over bimetal plate. Li et al [13] scrutinize the mechanical and microstructural properties of Q345 CS plate with AISI 321 austenitic steel as a clad metal and ER 309 as filler material which was welded through shielded metal arc welding. They found that the value of microhardness for local hardening zone was higher than that of base material and they suggested that for filling the base metal of CS, it is achievable to use filler material for SS clad plate welding. Yu et al [14] reported the microstructural properties of roll-bonded 304SS/medium CS which was manufactured in argon atmosphere through hot rolling. They found for the SS side a refined region and for carbon steel side, a decarburization region which was composed of dual structure and full-exhaustion of chromium zone.
Botes et al [15] used laser cladding of 316 st and Fe/st on E9 base material to find out correlation between structure and property. They investigated the structural transformation by using x-ray diffraction technique and the hardness of HAZ was increased after cladding while softened because of post weld heat treatment. Koleva et al [16] developed RSM to set up relationship between weld characteristics like (penetration, weld width and thermal efficiency) and factors such as (welding speed, focus position, beam power and distance to job surface) on austenitic stainless steel using electron beam welding, by thermal efficiency optimization, optimal welding arrangements were found. The result indicates that at welding depth and maximum thermal efficiency it is planned to select focus position. Ye et al [17] used Ni-based Inconel-718 sheets in tungsten inert gas welding to control hot cracking. Researcher found that it should be tried to have lower heat input to manage hot cracking tendency in weldments. Zaharuddin et al [18] to predict the weld strength of resistance spot welding for steel sheets CR780 having high strength an adaptive neuro fuzzy inference system (ANFIS) based proposal was used in artificial intelligence development. They found that on comparison of both artificial neural network (ANN) and ANFIS, the prediction of ANFIS was more accurate than that of ANN for weld strength. Anand et al [19] investigated on Incoloy 800H joints the parameters of friction welding were predicted by the study of ANN modelling. Tensile strength, burn off length and microhardness of the joints were executed with optimized parameters. Good ability was provided by ANN model with generic algorithm for the prediction of parameters to weld Incoloy 800H of friction welding. Huang et al [20] investigated laser welding the characterization of depth of penetration on acoustic signatures for the multiple regression and neural network method. They concluded that laser welding the acoustic signatures can predict and characterize the depth of penetration very well. Nagesh et al [21] studied genetic algorithm in tungsten inert gas welding process that the bead geometry was predicted using ANN and development of variables as height to width ratio. They found that using back-propagation neural networks the parameters of bead shape were predicted.
In the current work, welding investigation is performed on carbon steel (IS 2062) using metal cored stainless steel wire (ER 309). The relationship between weld parameters and weld bead characteristics such as penetration (P), width (W), reinforcement (R), weld reinforcement form factor (WRFF), weld penetration shape factor (WPSF) is studied. For getting superior weld characteristics the weld parameters are optimized using a RSM integrated Jaya algorithm approach.The application of GMAW metal cored wire technique is depicted in figure 1.
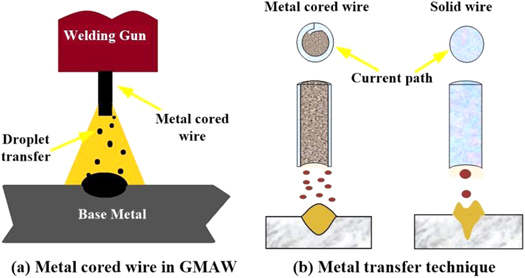
Figure 1. Application of GMAW metal cored wire technique.
Download figure:
Standard image High-resolution image
Figure 2. Weld bead profile.
Download figure:
Standard image High-resolution image
Figure 3. Experimental set up.
Download figure:
Standard image High-resolution image
Figure 4. Bead on plate trial.
Download figure:
Standard image High-resolution image
Figure 5. Macro examination of bead.
Download figure:
Standard image High-resolution image2. Experimental work
The Bead on plate investigation was performed on the mild steel plate (IS 2062) of size 150 mm × 150 mm ×12 mm. In this experiment Fronius welding power source (TPS 320I) was used for cladding. The test plate was welded with metal cored wire (ER 309L) of diameter 1.2 mm. The welding gun was placed with a mechanized trolley to have constant welding speed and nozzle to plate distance. A mixture of argon and CO2 was used as a shielding gas. Different parameters were used to deposit weld beads on test plates. After the bead was performed on the test plates the experimental samples were cut to size 30 mm from the middle of each plate. All the samples were polished to have a good finish and then etched. The samples were etched with nitric acid and hydrochloric acid. The bead profiles were analyzed and measured. Figure 2 shows the weld bead profile. The experimental set up of fixture and arrangement is depicted in figure 3. The chemical composition of base metal is given in table 1.
Table 1. Base metal composition.
| Materials | C | Si | Mn | P | S | Al | Cr |
|---|---|---|---|---|---|---|---|
| IS 2062 (%) | 0.171 | 0.304 | 0.907 | 0.022 | 0.007 | 0.037 | 0.012 |
The range of these factors was decided on the basis of weld performance of trial experiments. By varying one factor and keeping other factors constant, these trial experiments were carried out. The working range of each parameter was selected by the inspection of the bead without any visible defect and smooth appearance. Table 2 shows the weld factors and its levels for the experiment.
Table 2. Weld parameters and its levels.
| Levels | ||||
|---|---|---|---|---|
| Parameters | Units | −1 | 0 | +1 |
| Wire feed rate (WFR) | m min−1 | 8 | 10 | 12 |
| NTD | mm | 10 | 15 | 20 |
| Voltage (V) | V | 24 | 25 | 26 |
| Welding speed (S) | mm min−1 | 220 | 250 | 280 |
Twenty seven welding experiments were designed employing box behnken design (BBD) experimental design by varying parameters as per the designed matrix was followed. In order to overcome experimental errors, all the experiments were carried out in random order. Observation recorded after analyzing is given in table 3. Figure 4 shows the bead on plate trial. The macro examination of bead is depicted in figure 5.
Table 3. Experimental Results.
| Process parameters | Weld responses | ||||||||||
|---|---|---|---|---|---|---|---|---|---|---|---|
| Std. Order | Bead No. | WFR (m min−1) | V (Volts) | S (mm min−1) | NTD (mm) | I (A) | P (mm) | W (mm) | R (mm) | WPSF | WRFF |
| 1 | 1 | 8 | 24 | 250 | 15 | 234 | 3.39 | 10.19 | 4.09 | 3.01 | 2.49 |
| 8 | 2 | 10 | 25 | 280 | 20 | 235 | 3.49 | 10.29 | 4.49 | 2.95 | 2.29 |
| 21 | 3 | 10 | 24 | 250 | 10 | 295 | 5.32 | 10.72 | 5.24 | 2.02 | 2.05 |
| 20 | 4 | 12 | 25 | 280 | 15 | 289 | 5.36 | 9.87 | 5.73 | 1.84 | 1.72 |
| 4 | 5 | 12 | 26 | 250 | 15 | 303 | 6.20 | 12.37 | 5.18 | 2.00 | 2.39 |
| 19 | 6 | 8 | 25 | 280 | 15 | 196 | 2.89 | 11.18 | 3.77 | 3.87 | 2.97 |
| 22 | 7 | 10 | 26 | 250 | 10 | 308 | 5.46 | 12.84 | 4.44 | 2.35 | 2.89 |
| 12 | 8 | 12 | 25 | 250 | 20 | 258 | 4.02 | 10.34 | 5.00 | 2.57 | 2.07 |
| 15 | 9 | 10 | 24 | 280 | 15 | 280 | 3.63 | 10.10 | 4.60 | 2.78 | 2.20 |
| 6 | 10 | 10 | 25 | 280 | 10 | 300 | 5.06 | 11.83 | 4.92 | 2.34 | 2.40 |
| 5 | 11 | 10 | 25 | 220 | 10 | 287 | 5.71 | 13.47 | 5.35 | 2.36 | 2.52 |
| 10 | 12 | 12 | 25 | 250 | 10 | 321 | 6.44 | 10.89 | 7.25 | 1.69 | 1.50 |
| 2 | 13 | 12 | 24 | 250 | 15 | 300 | 5.04 | 9.88 | 6.18 | 1.96 | 1.60 |
| 11 | 14 | 8 | 25 | 250 | 20 | 200 | 2.84 | 9.25 | 3.90 | 3.26 | 2.37 |
| 26 | 15 | 10 | 25 | 250 | 15 | 266 | 4.96 | 11.26 | 4.21 | 2.27 | 2.67 |
| 17 | 16 | 8 | 25 | 220 | 15 | 229 | 3.42 | 11.46 | 4.19 | 3.35 | 2.74 |
| 7 | 17 | 10 | 25 | 220 | 20 | 249 | 4.57 | 12.41 | 4.74 | 2.72 | 2.62 |
| 23 | 18 | 10 | 24 | 250 | 20 | 224 | 2.80 | 9.88 | 4.16 | 3.53 | 2.38 |
| 18 | 19 | 12 | 25 | 220 | 15 | 286 | 5.55 | 11.28 | 6.16 | 2.03 | 1.83 |
| 13 | 20 | 10 | 24 | 220 | 15 | 253 | 4.77 | 11.37 | 5.33 | 2.38 | 2.13 |
| 24 | 21 | 10 | 26 | 250 | 20 | 230 | 3.97 | 11.26 | 4.51 | 2.84 | 2.50 |
| 16 | 22 | 10 | 26 | 280 | 15 | 241 | 3.97 | 11.69 | 4.41 | 2.94 | 2.65 |
| 9 | 23 | 8 | 25 | 250 | 10 | 258 | 4.27 | 11.89 | 3.55 | 2.78 | 3.35 |
| 27 | 24 | 10 | 25 | 250 | 15 | 267 | 4.37 | 11.87 | 4.37 | 2.72 | 2.72 |
| 3 | 25 | 8 | 26 | 250 | 15 | 215 | 2.93 | 12.02 | 3.50 | 4.10 | 3.43 |
| 14 | 26 | 10 | 26 | 220 | 15 | 257 | 4.86 | 12.94 | 4.59 | 2.66 | 2.82 |
| 25 | 27 | 10 | 25 | 250 | 15 | 272 | 4.48 | 12.33 | 4.36 | 2.75 | 2.83 |
3. Development of predictive modelling of weld responses
Response surface methodology is a prominent statistical approach for modelling and evaluating real world problems by constructing a predictive model of output performance that is influenced by a number of input characteristics. The methodology also assesses the relationship between controllable parameters and response characteristics through the development of response surface plots and contour plots [22]. The main objective of this approach is to optimize the responses influenced by the input process parameters. This investigation establishes and investigates the predictive models of the depth of penetration (P) and weld width (W), weld reinforcement (R), WPSF, and WRFF against the GMAW variables. In general, the response measure (Y) can be represented as a function of welding parameters as given in equation (1)

where the desired response is denoted Y and f is the response function. For four welding settings, equation (2) provides a generalised response surface model.

Where xi is the ith input parameter (i = 1 to 4), ko is a free term, ki , kii and kij correspond to the coefficients of linear, square and interaction terms and e is error.
In this investigation, a total of 27 datasets (table 3) are considered for modeling the dependent variable i.e. P, W, R, WPSF, and WRFF against four independent variables i.e. WFR, V, S, and NTD. A separate 7 datasets (table 4) are used for model validation. Initially, the coefficients of the quadratic model were calculated at 95% confidence interval. The insignificant model terms were eliminated using the backward elimination method to adjust the fitted regression model. For evaluating the adequacy of the predictive models, the coefficient of determination (R2), adjusted coefficient of determination (Radj 2) were calculated. The model probability values (p-value) were calculated further using ANOVA analysis. The quadratic models developed for the independent variable are stated in equations (3)–(7). The ANOVA table for each model representing the p-value is stated in table 5.
Table 4. Validation results.
| Process parameters | Weld responses | |||||||||
|---|---|---|---|---|---|---|---|---|---|---|
| Bead No. | WFR (m min−1) | V (Volts) | S (mm min−1) | NTD (mm) | I (A) | P (mm) | W (mm) | R (mm) | WPSF | WRFF |
| 1 | 8.5 | 24.5 | 250 | 10 | 275 | 5.14 | 11.44 | 3.91 | 2.23 | 2.93 |
| 2 | 10.5 | 25 | 240 | 15 | 270 | 4.84 | 10.85 | 5.20 | 2.24 | 2.09 |
| 3 | 12 | 24 | 250 | 20 | 270 | 3.79 | 9.11 | 5.49 | 2.40 | 1.66 |
| 4 | 8 | 24.5 | 220 | 15 | 230 | 3.98 | 11.67 | 4.12 | 2.93 | 2.83 |
| 5 | 10 | 24 | 240 | 12.5 | 270 | 4.38 | 11.11 | 4.86 | 2.54 | 2.29 |
| 6 | 12 | 25 | 250 | 17.5 | 288 | 5.51 | 11.23 | 5.80 | 2.04 | 1.94 |
| 7 | 8 | 24 | 270 | 10 | 261 | 3.76 | 11.21 | 3.46 | 2.98 | 3.24 |
Table 5. ANOVA table for predictive models.
| Model | DOF | Adj SS | Adj. MS | F-value | p-value | Adequacy |
|---|---|---|---|---|---|---|
| P | 5 | 25.9383 | 5.1876 | 48.00 | 0.000 | Adequate (p < 0.05) |
| W | 7 | 23.6600 | 3.380 01 | 14.02 | 0.000 | Adequate (p < 0.05) |
| R | 9 | 18.5811 | 2.0646 | 55.63 | 0.000 | Adequate (p < 0.05) |
| WPSF | 4 | 6.8768 | 1.7192 | 30.88 | 0.000 | Adequate (p < 0.05) |
| WRFF | 10 | 4.8622 | 0.4862 | 29.48 | 0.000 | Adequate (p < 0.05) |
The coefficient of determination (R2) for the predictive models of P, W, R, WPSF, and WRFF are evaluated as 91.95%, 83.78%, 96.72%, 84.88%, and 94.85% respectively. For all the predictive models the R2 value noted is above 80% as desired signifying higher adequacy of the developed predictive models. Moreover, adjusted coefficients of determination (Radj 2) values are closely packed with the corresponding R2 values of the respective models. This suggests that the models are well generalized. Further, the probability values obtained using ANOVA analysis observed from table 4 are less than 0.05 as desired. This indicates that the developed predictive modes are adequate and efficient in establishing the relationship between the dependent variables and the independent variables. Hence, the model developed can be used for validation and further study


3.1. RSM-JAYA based integrated optimization approach
In this investigation, an integrated optimization methodology is proposed combining the RSM approach as modeling tool and JAYA optimization algorithm as optimization tool. The RSM model equations developed for weld bead parameters i.e., P, W, R, WPSF, and WRFF is integrated with the JAYA algorithm for yielding a minimum composite fitness value while satisfying all the objective functions simultaneously. The model equations will predict the values of each objective function and the JAYA algorithm will locate the optimum fitness value in a four dimensional search space. A detailed procedure followed during RSM-JAYA algorithm is as follows.
3.2. JAYA algorithm
In 2016, Venkata Rao proposed JAYA, a gradient-free optimization algorithm to solve many constrained and unconstrained optimization problems [23]. The optimization approach is based on the notion of removing the worst solution from a population and finding the best solution within that same population. Due to its simple and robust nature, JAYA algorithm is found in various domains of industries especially in production industries to solve many linear to non-linear problems. The following are the steps involved in the JAYA algorithm:
Consider a problem that has a 'm' number of solutions i.e. the population size (h = 1, 2, ......, m) for 'l' number of process parameters/variables (g = 1, 2,...,l) at iteration 'o'. Consider, f(k) be the problem's objective function, which is required to be minimised. Now, by avoiding the worst solution, the algorithm will try to get the best value of f(k) in m number of solutions. Suppose, at 'o' iteration,  be the value of gth variable for 'h' solution. Now, the improved value of
  can be calculated as equation (8).

where  is the improved value of
 and
and  are the best and worst candidate solutions respectively for variable g;
  and
and  signifies the random numbers in range [0, 1].
The term ![${r}_{1,g}^{0}[{K}_{g,best}^{o}-abs({K}_{g,h}^{o})]$](https://content.cld.iop.org/journals/2631-8695/3/4/045025/revision2/erxac372dieqn9.gif) denotes the proclivity to find the best solution, whereas the term
denotes the proclivity to find the best solution, whereas the term ![$-{r}_{2,g}^{0}[{K}_{g,worst}^{o}-abs({K}_{g,h}^{o})]$](https://content.cld.iop.org/journals/2631-8695/3/4/045025/revision2/erxac372dieqn10.gif) denotes the proclivity to avoid the worst solution. The algorithm terninates only when the optimal
denotes the proclivity to avoid the worst solution. The algorithm terninates only when the optimal  is obtained i.e. the best sotution of the objective function.
3.3. Formulation of RSM-JAYA optimization approach
This investigation optimizes the GMAW process parameters during cladding of IS 2062 for a minimum value of composite objective function that satisfies the entire objective simultaneously. The predictive model developed for P, W, R, WPSF, and WRFF are found adequate and effective for prediction and hence is integrated with JAYA algorithm for optimization. The scheme of RSM-JAYA methodology is illustrated in figure 6.

Figure 6. RSM-JAYA flowchart.
Download figure:
Standard image High-resolution imageHere, each of the objective function considered is mutually conflicting in nature. The objective function depth of penetration (P) requires to be maximized and while the remaining objectives for W, R, WPSF, and WRFF requires to be minimized.
Thus, formulation of a composite objective function is necessary that satisfies each objective simultaneously. In this work, weighted sum method is used to formulate the combined objective function that assign weightage to all objectives. The composite objective function combining each objective is as follows:

Subjected to: 8 ≤ WFR ≤ 12, 24 ≤ V ≤ 26, 220 ≤ S ≤ 280, 10 ≤ NTD ≤ 20
Where Z is the combined objective function and it is required to be minimized. Wmin , Rmin , WPSFmin , WRFFmin, are the minimum value of the objective function W, R, WPSF, and WRFF respectively. The Pmax is the maximum objective function value for P. These minimum and maximum values of the objectives are obtained by minimizing/maximizing the objective functions i.e., equations (3)–(7) individually. The w1, w2, w3, w4, and w5 are the weightage assign to objectives W, R, WPSF, WRFF, and P respectively. In this work, equal weightage i.e. w1 = w2 = w3 = w4 = w5 = 0.2 is considered for simplicity in solving the composite objective function.
4. Result and discussion
4.1. Parametric study
4.1.1. Influence of WFR
The WFR mainly influences the welding current and the penetration is increased due to higher heat input per unit length. Figure 7 depicts the influence of WFR on P, W, R, WPSF and WRFF. The figure shows that the value of P and R increases with WFR, because of the increase in welding current with increase in WFR. The R increases due to higher deposition of wire per unit length. The weld bead width does not vary much with change in WFR and the graph trends show the width increases at higher WFR because the arc gets wider at higher voltage resulting in wider weld bead. The WPSF decreases at higher WFR due the decrease in the W/P ratio, similarly the trend of WRFF indicates that it also decreases with decrease in W/R ratio.

Figure 7. Effect of WFR on P, W, R, WPSF and WRFF.
Download figure:
Standard image High-resolution image4.1.2. Influence of V
The influence of voltage is depicted in figure 8. The trend in figure shows that the bead width is mainly influenced by the voltage. The bead width increases with increase in voltage and it is due to the formation of a wider arc at higher voltage. For P, R, WPSF and WRFF the graph trends show that it does not vary much with increase in voltage. However, for WRFF the graph trends show that it is increasing with voltage, because of the increase in bead width (W/P) ratio with increase in voltage.
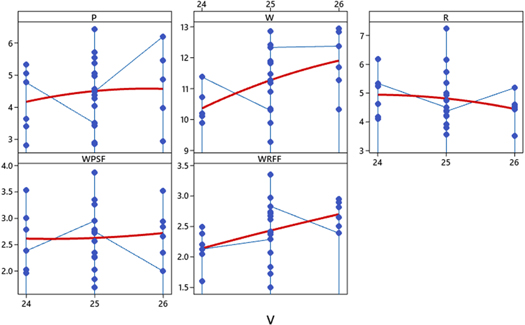
Figure 8. Effect of V on P, W, R, WPSF and WRFF.
Download figure:
Standard image High-resolution image4.1.3. Influence of S
The influence of welding speed on P, W, R, WPSF and WRFF is depicted in figure 9. The graph trend shows that the penetration decreases with increase in welding speed due to low heat input associated with higher welding speed per unit length. The trend of graphs is also decreasing with welding speed. The weld bead becomes narrow due to less weld pool being deposited per unit length. For other responses R, WPSF, WRFF the graph trends depicts that the responses have very less effect on welding speed.
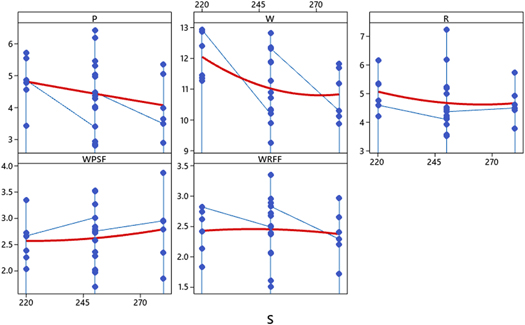
Figure 9. Effect of S on P, W, R, WPSF and WRFF.
Download figure:
Standard image High-resolution image4.1.4. Influence of NTD
The effect of NTD is depicted in figure 10. The welding current is mainly influenced by the NTD in the GMAW process. As the NTD is increased the welding current is decreased due to higher resistance in wire. The figure depicts that the penetration is higher, because of the increase in welding current at lower NTD. The graph trends indicate that the bead width decreases with increase in NTD. The graph of reinforcement shows slight changes with increase in NTD. The WPSF graph indicates that W/P ratio decreases at lower NTD, because higher penetration is achieved with lower NTD, due to increase in welding current.
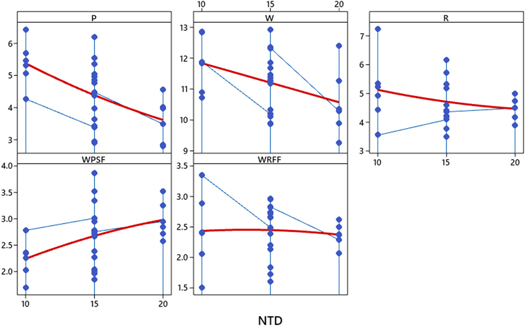
Figure 10. Effect of NTD on P, W, R, WPSF and WRFF.
Download figure:
Standard image High-resolution image5. Validation of RSM models
The predictive models developed for weld bead characteristics are found adequate within the confined confidence interval. However, the models developed were not tested to its effectiveness on a set of validation datasets. Hence, validation of the predictive model is carried out by comparing the experimental results with the predicted results on a set of unseen datasets (table 3). Aspects like, average percentage error (APE), prediction accuracy (PA) and model accuracy (MA) for each model are calculated to determine the effectiveness and accuracy of the predictive models [24]. The APE for the models is calculated using equation (10); the PA and MA were calculated using equations (11), (12). The results of prediction of responses are tabulated in table 6. The APE, PA and MA evaluated for each model is stated in table 7.


Where Y is experimental value for dataset, Ŷ is predicted value and n is number of datasets.
Table 6. Results of model validation.
| Input parameters | Experimental results | Predicted results | |||||||||
|---|---|---|---|---|---|---|---|---|---|---|---|
| Run | WFR-V-S-NTD | P | W | R | WPSF | WRFF | P | W | R | WPSF | WRFF |
| 1 | 8.5-24.5-250-10 | 5.14 | 11.44 | 3.91 | 2.23 | 2.93 | 4.55 | 11.94 | 4.12 | 2.61 | 2.78 |
| 2 | 10.5-25-240-15 | 4.84 | 10.85 | 5.2 | 2.24 | 2.09 | 4.81 | 11.74 | 4.78 | 2.49 | 2.52 |
| 3 | 12-24-250-20 | 3.79 | 9.11 | 5.49 | 2.4 | 1.66 | 4.00 | 9.31 | 4.96 | 2.58 | 1.90 |
| 4 | 8-24.5-220-15 | 3.98 | 11.67 | 4.12 | 2.93 | 2.83 | 3.83 | 11.23 | 4.31 | 3.27 | 2.58 |
| 5 | 10-24-240-12.5 | 4.38 | 11.11 | 4.86 | 2.54 | 2.29 | 4.78 | 11.33 | 5.11 | 2.29 | 2.14 |
| 6 | 12-25-250-17.5 | 5.51 | 11.23 | 5.8 | 2.04 | 1.94 | 5.05 | 10.72 | 5.33 | 2.20 | 2.06 |
| 7 | 8-24-270-10 | 3.76 | 11.21 | 3.46 | 2.98 | 3.24 | 4.19 | 11.28 | 4.11 | 2.62 | 2.47 |
Table 7. Effectiveness of predictive models.
| Percentage error (%) | Prediction accuracy (%) | |||||||||
|---|---|---|---|---|---|---|---|---|---|---|
| Run | P | W | R | WPSF | WRFF | P | W | R | WPSF | WRFF |
| 1 | 11.39 | 4.41 | 5.42 | 17.00 | 5.08 | 88.61 | 95.59 | 94.58 | 83.00 | 94.92 |
| 2 | 0.57 | 8.19 | 8.08 | 11.23 | 20.47 | 99.43 | 91.81 | 91.92 | 88.77 | 79.53 |
| 3 | 5.49 | 2.16 | 9.59 | 7.60 | 14.64 | 94.51 | 97.84 | 90.41 | 92.40 | 85.36 |
| 4 | 3.74 | 3.76 | 4.64 | 11.51 | 8.82 | 96.26 | 96.24 | 95.36 | 88.49 | 91.18 |
| 5 | 9.22 | 1.98 | 5.08 | 9.98 | 6.63 | 90.78 | 98.02 | 94.92 | 90.02 | 93.37 |
| 6 | 8.41 | 4.51 | 8.03 | 7.62 | 6.29 | 91.59 | 95.49 | 91.97 | 92.38 | 93.71 |
| 7 | 11.47 | 0.58 | 18.87 | 12.23 | 23.78 | 88.53 | 99.42 | 81.13 | 87.77 | 76.22 |
| APE (%) | 7.18 | 3.66 | 8.53 | 11.02 | 12.25 | |||||
| .MA (%) | 92.82 | 96.34 | 91.47 | 88.98 | 87.75 | |||||
The APE for the predictive models of P, W, R, WPSF, and WRFF are found as 7.18%, 3.66%, 8.53%, 11.02% and 12.25% respectively. These observed APE is less than 25% as desired indicating higher accuracy of the developed predictive models. The model accuracy (MA) of models of P, W, R, WPSF, and WRFF are found as 92.82%, 96.34%, 91.47% 88.98% and 87.75%. These higher model accuracy and lower APE indicates that the model developed using RSM analysis is effective and acceptable and can be implemented for further study.
6. Application RSM-JAYA methodology
In this work, RSM is integrated with JAYA optimization algorithm for multi-objective optimization of GMAW process parameters satisfying desired weld bead geometry (P, W, R, WPSF, and WRFF) while cladding of IS 2062. Here, a composite objective function is formulated as stated in equation (9) that maximizes the response P while minimization of responses W, R, WPSF, and WRFF. The code of this optimization methodology is developed in MATLAB (R2016a version). As stated, JAYA is a parameter free algorithm that requires only the number of iterations and size of population. In this present investigation, 50 iterations are considered for a total of 80 members of population.
Initially the Pmax, Wmin , Rmin , WPSFmin, and WRFFmin, values were calculated running the algorithm individually. The Pmax, Wmin , Rmin , WPSFmin, and WRFFmin values are observed as 7.3492 mm, 8.6924 mm, 3.0081 mm, 1.3324 and 0.6360 respectively. These values were substituted in equation (9) to minimize the composite objective function value that satisfies the entire objectives simultaneously. The optimization methodology converges in only 18th iteration as illustrated in figure 11. The minimum fitness value is observed as 1.3008 at parameter setting WFR = 12 m min−1, V = 26 V, S = 280 mm min−1, NTD = 10 mm. The corresponding responses at parameter setting is observed as P = 6.60 mm, W = 11.63 mm, R = 6.52 mm, WPSF = 1.95, and WRFF = 1.54. On validation at the optimum parameter setting, a percentage improvement of 6.45%, 11.29%, 13.58%, 16.07%, 15.38% is noted for P, W, R, WPSF, and WRFF respectively.

Figure 11. RSM-JAYA convergence plot.
Download figure:
Standard image High-resolution image
This improvement in the experimental result and faster convergence rate indicates that the proposed RSM-JAYA algorithm is robust in locating the optimal solution within the defined search domain. The detailed result of RSM-JAYA methodology is shown in table 8.
Table 8. RSM-JAYA result.
| Optimal parameter setting | Optimal result | |||||||||
|---|---|---|---|---|---|---|---|---|---|---|
| WFR | V | S | NTD | P | W | R | WPSF | WRFF | Optimal fitness function value | |
| RSM-JAYA | 12 | 26 | 280 | 10 | 6.60 | 11.63 | 6.52 | 1.95 | 1.54 | 1.3008 |
| Experimental | 12 | 26 | 280 | 10 | 6.20 | 10.45 | 5.74 | 1.68 | 1.82 | — |
| Percentage Improvement (%) | 6.45 | 11.29 | 13.58 | 16.07 | 15.38 | — | ||||
7. Conclusion
In this work experimental investigation on cladding of ER 309L metal core wire (as filler material) on a corrosion resistant material is studied using GMAW process. The following conclusions can be made from the investigation of weld bead characteristics.
- The WFR and NTD are the most influencing parameter for penetration. As the WFR increases from 8 to 12 m min−1, the value of penetration is increases from 2.89 to 6.44 mm. While at higher NTD 20 mm the lowest penetration 2.80 mm is achieved. The increase in NTD leads to decrease in penetration due to higher resistance in wire.
- With increase in WFR, the value of reinforcement increases from 3.50 to 7.25 mm. The reinforcement increases due to higher deposition of wire per unit length.
- The predictive models developed for P, W, R, WPSF, and WRFF using the RSM approach is found adequate at 95% confidence interval. The validation results for the developed model results in a model accuracy (MA) of 92.82%, 96.34%, 91.47% 88.98% and 87.75% for model P, W, R, WPSF, and WRFF respectively suggesting higher predictability and accuracy.
- The developed RSM-JAYA integrated optimization methodology is found highly efficient in locating the optimal solution within 20 number of iterations. The minimum fitness value observed is 1.3008 at optimal parameter setting WFR = 12 m min−1, V−1 = 26 V, S = 280 mm min−1, NTD = 10 mm. The validation result at the optimal parameter setting results in an improvement of 6.45%, 11.29%, 13.58%, 16.07%, 15.38% is noted for P, W, R, WPSF, and WRFF respectively.
Data availability statement
All data that support the findings of this study are included within the article (and any supplementary files).