
Abstract
In this research, the generalized streamline introduced by previous researchers based on the Bezier geometrical method for a rectangular cross section of equal channel angular extrusion (ECAE) was applied to predict the dislocation cell size distribution. For this purpose, the Estrin-Toth-Molinari-Brechet (ETMB) model was coupled to the kinematically admissible strain field obtained by the Bezier geometrical modeling. In contrast with many analytical methods, using this approach, a non-uniform strain distribution was obtained in the deformation zone, which is in good agreement with the results of numerical methods such as finite element (FE) simulation. Results showed that by decreasing the inner angle, the strain is increased in ECAE. Therefore, the evolution of the dislocation cells in the inner angle of the die was more pronounced than in the outer angle of the ECAE die. The effect of the outer corner angle was investigated and it was found that with increasing the outer curvature a non-uniform dislocation cell size is achieved.
Export citation and abstract BibTeX RIS
1. Introduction
Severe plastic deformation (SPD) methods are convenient for producing ultra-fine (submicron or nanostructure) grains in bulk metallic alloys by introducing large plastic strains. Equal channel angular pressing (ECAP) or extrusion (ECAE) is an effective technique in SPD for producing bulk materials with nanocrystalline grain (or sub-grain) size and provides an opportunity to increase the strength and fracture toughness [1].
The ECAE process involves extruding of a billet through a die that consists of two equal channels, intersecting at an inner angle and outer angle  as indicated in figure 1. As a result of the pressing, the sample deforms by simple shear and retains the same cross-sectional area. Hence, it is possible to repeat the pressing for several cycles to produce large strains and fine grain size [2]. As the evolution of microstructure occurs by the mechanical work in pressing, it is needed to select a method for calculating the strain, stress, and internal variables during deformation. The first analytical approach for calculating kinematically admissible strain in ECAP was developed by Segal [3]. Considering the outside corner angle, Iwahashi et al showed that the shear strain
  after one ECAE pass can be obtained by the following equation [4]:

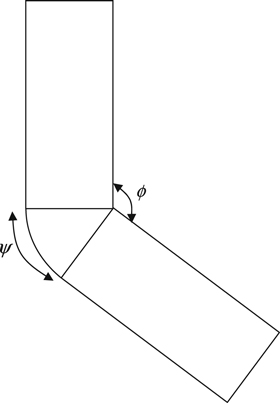
Figure 1. Schematic of ECAE die with inner ( ) and outer (
 ) angles.
Download figure:
Standard image High-resolution imageAltan et al used the upper bound theorem for calculating the pressing load in the ECAE process and took into account the effect of friction on this load [5]. However, they did not consider the effect of the outer angle. Bowen et al studied the deformation of the extruded billet under various conditions by FE analysis and compared the results by experiments [6]. Kim et al used the DEFORM software to predict the strain and stress variations during the ECAP [7]. Considering that estimation of kinematically admissible strain field requires less computational effort, Narooei and Karimi Taheri presented a new method for calculating strain in 2D ECAE using the Bezier geometrical method [8]. In this method, it is possible to control the geometry and deformation zone by the control points to obtain more accurate results. Most of the analytical and numerical methods developed by previous researchers have been limited to 2D studies. But, Narooei and Karimi Taheri analyzed the strain field and deformation load changes in the 3D ECAE process using the Bezier method [9, 10]. Regarding these studies, it is possible to predict the microstructure evolution in the ECAE process based on the developed strain and stress during the deformation. For example, Baik et al used the ETMB model and finite element method (FEM) to predict the evolution of dislocation density and cell size after deformation [11]. In contrast to many studies, the amazing result of this work is the variation of the strain field [12–15]. This may be due to the contact algorithm model or coarse level for the presentation of strain distribution. Zeipper et al used a dislocation-based model for simulating CP-Ti extruded billets [16]. Kim and Estrin took into account the ETMB model and predicted the dislocation cell size, misorientation of the incidental dislocation, and necessary boundaries [17].
From the aforementioned literature review, it is seen that a limited number of works have been conducted to predict the dislocation cell size and dislocation density distribution based on the analytical modeling. In the present study the proposed model of Narooei and Karimi Taheri, which considers the strain distribution in 2D ECAE, and the ETMB model were coupled to predict the dislocation cell size and dislocation density distribution [8, 18]. As a direct result of kinematic modeling of the strain field, the computational time was decreased considerably. Moreover, using this method allowed determining the strain, dislocation cell size, and dislocation density in large deformations, where finite element simulation could not be used due to the mesh distortion.
2. Analysis
The Bezier and Spline methods are used widely in the geometrical representation of complex geometries in the CAD/CAM tools [9, 19]. Here, for the sake of brevity, the required formulations developed by Narooei and Karimi Taheri are mentioned for the 2D case [8–10]. Consider four points in space, where two of them represent the initial and end of the ECAE deformation zone on each streamline and the other two points are chosen in a manner so as to control the curvature of the corresponding streamline. Hence, the following cubic Bezier equation can be used for the streamlines [8]:

here  and
and  represent the initial and final control points while
  and
and  are chosen to control the curvature of each streamline. Moreover,
  and
and  denote the cartesian coordinates of streamline points. By changing the parameter
  on the domain [0, 1] a streamline is swept from the entrance to the exit of the deformation zone. The coordinates of

 and
and  were determined in reference [8]. Assuming the volume constancy of the plastic deformation in solid metals and the tangency of the velocity of each material point to its streamline path, the kinematically admissible velocity field in the deformation zone is obtained as [8, 9]:

where the subscripts represent the differentiation of  or
or  function with respect to
  or
or  parameters. It is worth mentioning that by variation of
  different streamlines from the inner to the outer angle in the deformation zone could be produced [8]. Parameter
  in equation (3) is the constant of integration that is calculated as [8, 9]:

where  is the punch velocity. Regarding this velocity field, the strain rate component in the deformation zone can be calculated as [8]:

To determine the strain components, the numerical integration of the above strain rates provides:

As mentioned earlier,  varies between 0 and 1 to sweep the deformation zone and thereby the integral limits are 0 and 1.
At large strains, the dislocation cell microstructure or sub-grains could be formed [11, 17, 18]. So, models that predict the dislocation density and dislocation cell size should be capable to consider all hardening stages in large deformations. Estrin et al proposed a dislocation-based model called ETMB that is capable of incorporating the stages III, IV, and V of hardening in the large strains [18]. Here, a brief illustration of this model used in our predictions is provided and for more details, readers are referred to reference [18]. In the ETMB model, the dislocation density is subdivided to the low dislocation density of the cell interior ( ) and high dislocation density of the cell wall (
 ). The total dislocation density can be obtained by the rule of mixture:

where  represents the volume fraction of the cell walls. For better agreement between the experimental data and theoretical one, an evolution rule for variation of the wall volume fraction as a function of the resolved shear strain (
 ) has been proposed as [18]:

where  and
and  are the initial and saturation value of
  respectively;
  is a dimensionless parameter that controls the variation of
  The rate of interior dislocation density can be obtained as [18]:

Here 
 and
and  are three constants,
  is the Burger's vector magnitude, and
  is the average dislocation cell size. Similarly, the rate of wall dislocation density can be determined from [18]:

The multi-scale modeling is needed to calculate the resolved shear strain on the active slip planes. The iso-strain assumption of the crystal plasticity theory can be used to bridge the macroscopic shear strain rate ( ) to the resolved shear strain rate (
 ) via the Taylor factor (
 ) as [18]:

Hence, as the macroscopic strain rates were calculated by the Bezier method and equation (11) can be used to estimate the resolved shear strain rate from the strain rate field provided in equation (5). Then, equations (9) and (10) were applied to calculate the rate of interior and wall dislocation density. The trapezoidal integration method was employed to determine the dislocation density of the interior and wall from their corresponding rates. Using equation (7), the total dislocation density was obtained and the Hall-Petch like equation was considered to determine the dislocation cell size ( ) as [18]:

3. Results and discussion
To verify the robustness of the above formulation, some numerical experiments are considered and the obtained results are compared with those of other researchers. It noteworthy that although most studies are related to the experimental investigations of the deformed microstructure, but limited number of works have focused on their modeling. So, after ensuring the soundness of the results, the effect of deformation parameters is investigated. To this goal, the dimensions of the considered billet were selected from reference [11] (table 1). The inner and outer angles of the die were assumed to be  and
and  respectively. The pure Al (99.99%) parameters (table 2) were used to calculate the dislocation cell size [11]. The contour of the effective strain in the ECAE deformation according to the current Bezier type modeling was shown in figure 2(a). Also, the results of FE modeling from Baik et al [11] was exhibited in figure 2(b). As it can be seen, there is good agreement between the results regarding both values and the trends of the strain distribution. Also, a finer resolution in the current trend can be seen; As it is known in the FE simulation that by increasing the elements, the computational time is increased while in the current semi-analytical model, it is possible to consider very fine streamlines without changing the computational time. In other words, all computational efforts (differentiation and integrations) are based on the parameters
  and
and  By the end of computations, it is only in the representation of data that we could select small increments of
  and
and  for the fine contours. In contrast, in FE simulations, the mesh refinement increases the computational time and may change the strain distribution. The used grid for the representation of the internal variables such as the strain and dislocation cell size distribution is presented in figure 3(a) (or figure 3(b) with the magnified deformation zone of figure 3(a)). Also, the FE mesh of Baik et al is presented in figure 3(c). By inspecting figure 3(c), a gap is seen between the billet and the die. In many cases, this problem is not physical and usually is produced by the singularity of the contact algorithm in sharp points, as it could be seen in the die. However, in the current approach, regarding the use of streamline equations, this problem is not any concern; which is another advantage of this method.
Table 1. Dimensions of the investigated billet [11].
| Width (mm) | Length (mm) | Thickness (mm) |
|---|---|---|
| 12 | 12 | 60 |
Table 2. Parameters of hardening model [11].
| Value |

|

|

|

|

|

|

|

|

|

|

|

|

|


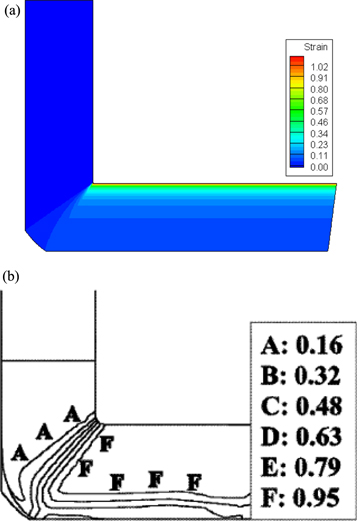
Figure 2. Plastic effective strain distribution for  and
and  (a) Current research and (b) Baik et al [11].
Download figure:
Standard image High-resolution image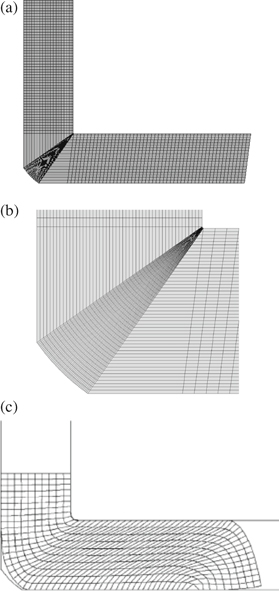
Figure 3. (a) The used grid of the current research, (b) magnification of deformation zone in part (a), and (c) the FE mesh of Baik et al [11].
Download figure:
Standard image High-resolution imageThe distribution of the dislocation cell size according to the current research is presented in figure 4(a). Also, a comparison of the obtained results with those of Baik et al is shown in figure 4(b). Again, a good agreement between the results of our kinematically based computation and FE simulation could be seen. This consistency is because the trends of the strain distribution are in good agreement as mentioned before and the major parameter affecting the dislocation cell size is the strain. Although the variations of the Taylor factor have not been considered in the current study, but this is not significant as shown in reference [18]. In our future studies, this kinematic strain field could be coupled with the crystal plasticity models to take into account the effect of the materials texture and the Taylor factor variations. The benefit of such modeling is the significant reduction of the computational time.
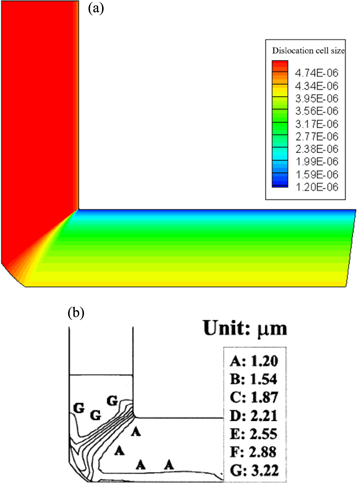
Figure 4. Distribution of dislocation cell size: (a) current research (dimension m) and (b) Baik et al [11].
Download figure:
Standard image High-resolution imageTo take into account the effect of the inner angle, the results of the strain distribution and dislocation cell size in constant outer angle ( ) and various inner angles of
  and
and  were shown in figure 5. Comparing figures 5(a), (c), and (e) reveals the deformed strain is decreased by increasing the inner angle. Although Eivani and Karimi Taheri predicted uniform strain distribution in the deformation zone [20], they mentioned that in a constant inner angle, the strain decreases by an increase in the outer angles [21]. As a direct result of the strain reduction, the dislocation cell size is increased as it is observed in figures 5(b), (d), and (f). This is because by strain decreasing the total dislocation density is decreased and therefore the dislocation cell size is increased according to equation (12). In this regard, the results of some studies [21–23] confirmed that the grain size is increased by strain decreasing.
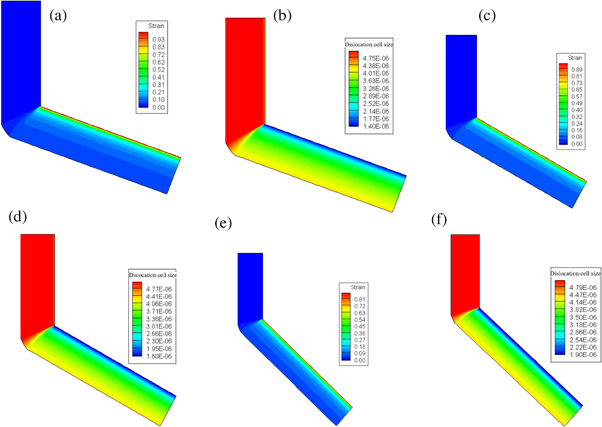
Figure 5. Strain and dislocation cell size (dimension m) distribution for  (a) and (b)
 (c) and (d)
 (e) and (f)
Download figure:
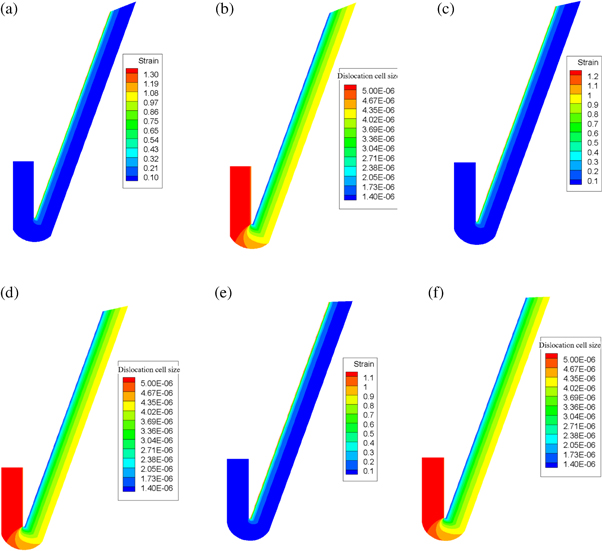
Standard image High-resolution imageBy the increase in the outer angle to obtuse and internal angle to acute, the complexity of deformation increases and usually the Lagrangian mesh of FE simulation is distorted severely. Nevertheless, our analytical model could be used in these challenging cases, as well. Figure 6 exhibits the strain and dislocation cell grain size distributions for the obtuse outer and acute internal angles. Comparing figures 5 and 6 reveals that by a decrease in the internal angle the strain level is increased. Moreover, an increase in the strain is accompanied by a reduction in dislocation cell size. Furthermore, it could be seen that the inner angle has more influence in the strain increase as by decreasing the inner angle the maximum strain increases to greater than 1. From figures 5 and 6 (parts b, d, and f) it is inferred that gradient of dislocation cell size increases by an increase in the outer angle. Therefore, to reduce the gradient of the mechanical properties due to dislocation cell variation, sharp angles should be used. Also, the saturation of dislocation cell size by strain could be seen in figure 6 as it does not vary with strain. This is because of the nature of equations (9) and (10), as the power type function is used to relate the rate of dislocation density to the resolved shear strain rate. It is worth to mention although the analytical integration of equations (9) and (10) cannot be performed, but conceptually the integration of these rate form equations provides a power type function and these type functions are susceptible to saturation (asymptote).
Figure 6. Strain and dislocation cell size (dimension m) distribution for  (a) and (b)
  (c) and (d)
  (e) and (f)
Download figure:
Standard image High-resolution image
4. Conclusions
In the current research, we coupled the Bezier streamline method introduced by Narooei and Karimi Taheri and the ETMB model for predicting the dislocation cell size distribution. By creating a semi-analytical model, a robust method was presented that could incorporate all hardening stages with a reduced computational time. The results predicted that non-uniform strain distribution occurs in the deformation zone, which agrees with the FE simulations. Also, it was shown that by increasing the inner and outer angle, the strain is reduced, leading to an increase in the dislocation cell size. Moreover, an increase in the outer angle resulted in an increase in the gradient of dislocation cell sizes. Finally, the results showed the saturation of dislocation cell size with an increase in the strain, which is related to the nature of the ETMB model.
Acknowledgments
The authors would like to thank the University of Sistan and Baluchestan and K N Toosi University of Technology for providing the research facilities used in this work.