
Abstract
The need for storage in electricity systems is increasing because large amounts of variable solar and wind generation capacity are being deployed. About two thirds of net global annual power capacity additions are solar and wind. Pumped hydro energy storage (PHES) comprises about 96% of global storage power capacity and 99% of global storage energy volume. Batteries occupy most of the balance of the electricity storage market including utility, home and electric vehicle batteries. Batteries are rapidly falling in price and can compete with pumped hydro for short-term storage (minutes to hours). However, pumped hydro continues to be much cheaper for large-scale energy storage (several hours to weeks). Most existing pumped hydro storage is river-based in conjunction with hydroelectric generation. Water can be pumped from a lower to an upper reservoir during times of low demand and the stored energy can be recovered at a later time. In the future, the vast storage opportunities available in closed loop off-river pumped hydro systems will be utilized. In such systems water is cycled repeatedly between two closely spaced small reservoirs located away from a river. This review covers the technology, cost, environmental impacts and opportunities for PHES. The key motivations for this review are firstly that large amounts of variable wind and solar generators are being deployed; and secondly that there are vast opportunities for low-cost pumped hydro storage that do not require interference with rivers (with the associated environmental cost).
Export citation and abstract BibTeX RIS

Original content from this work may be used under the terms of the Creative Commons Attribution 4.0 license. Any further distribution of this work must maintain attribution to the author(s) and the title of the work, journal citation and DOI.
1. Introduction
The use of moving water in rivers to provide useful energy has been practiced for millennia. Since the 1880s, hydroelectricity has been a major component of global electricity production. In 2019, global installed hydroelectric power capacity reached 1310 Gigawatts (GW) [1]. Energy production from hydro in 2018 was 4300 Terawatt-hours (TWh) which represents 17% of global electricity production [2].
Hydroelectricity is valuable in an electricity system because it is easily capable of following variable load by varying the flow of water through the turbine. This minimizes the need for slow-response coal-fired and nuclear power systems to follow electricity demand as it rises and falls.
China has the largest amount of hydropower capacity followed by the European Union, Brazil and the United States of America (figure 1).
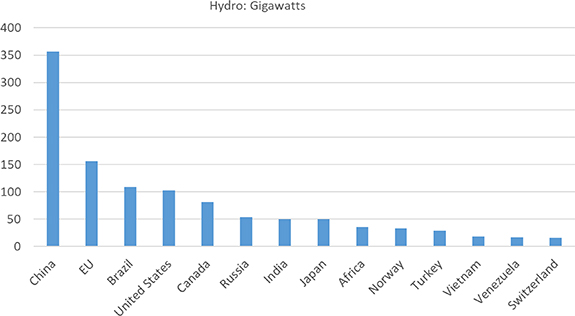
Figure 1. Hydropower capacity (Gigawatts) for selected countries and regions in 2019 [1].
Download figure:
Standard image High-resolution imageWhen normalized for population, mountainous countries including Iceland, Norway, Bhutan, Canada and Switzerland head the list (figure 2). The rapid response capability of hydro can be used to help balance electrical supply and demand. A premium is normally paid for flexible, rapid response hydro energy, and some countries earn substantial income by exporting hydroelectricity.
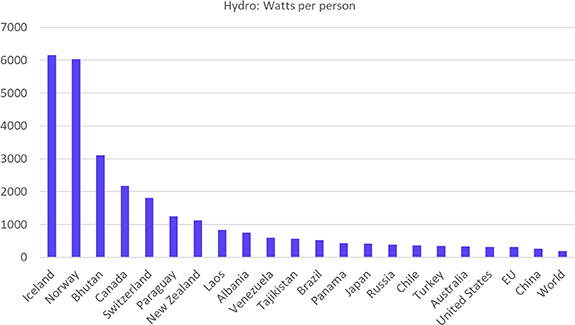
Figure 2. Hydropower capacity [1] per person (Watts person−1) for selected countries and regions in 2019.
Download figure:
Standard image High-resolution imagePumped hydro energy storage (PHES) has been in use for more than a century to assist with load balancing in the electricity industry. PHES entails pumping water from a lower reservoir to a nearby upper reservoir when there is spare power generation capacity (for example, on windy and sunny days) and allowing the water to return to the lower reservoir through a turbine to generate electricity when there is a supply shortfall (for example, during the evening).
PHES comprises about 96% of global storage power capacity and 99% of global storage energy volume [3]. Some countries have substantial PHES capacity to help balance supply and demand (figure 3). For example, Japan's PHES capacity was constructed to help follow varying power demand, allowing its nuclear and fossil fuel fleet to operate at nearly constant power output.
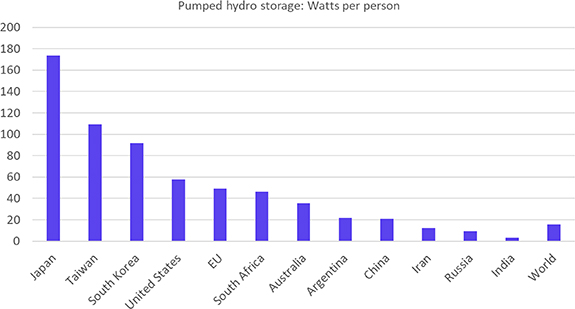
Figure 3. Pumped hydro storage power capacity [1] (Watts person−1).
Download figure:
Standard image High-resolution imageBatteries occupy most of the balance of the electricity storage market. Battery storage includes utility, home and electric vehicle batteries. Batteries are rapidly falling in price and can compete with PHES for short-term storage (minutes to hours). PHES is much cheaper for large-scale energy storage (overnight or several days) and has much longer technical lifetime (50–100 years). All prices in this article are in United States dollars.
2. The rapid rise of variable solar and wind
The global electricity system is rapidly transitioning away from fossil fuel power systems and towards renewable energy (figure 4) [4]. About two thirds of net global annual generation power capacity additions are solar photovoltaics (PV) (figure 5) and wind (figure 6). This is because of rapid declines in the cost of PV and wind.

Figure 4. Net global annual generation nominal power capacity additions [1, 4–9]. Reproduced from [4]. CC BY 4.0.
Download figure:
Standard image High-resolution image
Figure 5. Royalla solar farm.
Download figure:
Standard image High-resolution image
Figure 6. Capital wind farm.
Download figure:
Standard image High-resolution imageConstruction of new hydroelectric systems is declining. Reasons for this include competition from solar and wind; opposition on environmental and social grounds; and many of the good sites have already been developed. Hydro generation is fundamentally limited by availability of suitable rivers, whereas wind and solar have effectively unlimited resources in most regions.
Solar and wind are variable electricity sources, with power output rising and falling according to the availability of sunshine and wind. Terawatts (TW) of solar and wind will be deployed as part of deep renewable electrification [4] of the global energy system.
Substantial storage will be needed to support PV and wind, which provides a large opportunity for pumped hydro storage.
For low penetration of solar and wind in an electricity grid (typically less than about one quarter), existing conventional generators (mostly coal, gas and hydro) can adequately balance supply and demand. However, as the penetration of wind and solar increases, the need for additional storage eventually becomes important.
In some countries, the amount of variable wind and solar electricity is already rising rapidly. This enhances the need for additional storage. The amount of storage needed is generally smaller if both PV and wind are deployed, since they often generate electricity at different times. Strong interconnection over large areas (million square kilometers) using high voltage transmission greatly reduces the amount of required storage because sunny or windy weather in one place can offset lack of generation in another place where it is cloudy and still.
Large-scale storage is needed sooner in regions where solar and wind penetration is higher and where there are weak or absent transmission links to neighboring regions or countries. Figure 7 illustrates the solar PV and wind industries in terms of installed nominal power capacity per person and the deployment rate per person in selected countries and regions.

Figure 7. Per capita installed nominal power capacity and deployment rate for solar and wind in selected countries (average of 2018 and 2019) [1].
Download figure:
Standard image High-resolution image3. Case study: Australia
In Australia, solar PV and wind comprise 99% of new generation capacity; the deployment rate of new renewables is ten times faster per capita than the global average and four times faster per capita than in Europe, China, Japan or the USA (figure 8).

Figure 8. Deployment rate of renewables (principally solar PV and wind) in various regions in terms of Watts person−1 yr−1 [1, 10].
Download figure:
Standard image High-resolution imageThe fraction of solar and wind electricity supplied to Australia's National Electricity Market, which was 9% in 2017, increased to 24% in 2020 and will continue to increase for the foreseeable future. Solar and wind reached 70% of the electricity in the state of South Australia and is likely to reach 100% by 2025. Australia is an industrialized country that is isolated from neighbouring electricity networks, and hence cannot share electricity across national boundaries. About 85% of Australia's greenhouse emissions are caused by use of fossil fuels. Australia is demonstrating that a rapid switch to solar and wind is feasible at low cost, with consequent reduction in emissions.
Australia has no prospects for significant additional river-based hydroelectric systems to help balance demand against supply of solar and wind electricity. It is turning to new Gigawatt-scale long-distance transmission, PHES and battery storage. About a dozen PHES systems are under serious consideration and one is under construction (Snowy 2.0, 2 GW, 0.35 TWh [11]). Australia is a pathfinder [4] for the three quarters of humanity who live in the sunbelt (lower than 35 degrees of latitude) where there is high and consistent solar insolation throughout the year and no cold winters, and where most of the global growth in population, energy use and Greenhouse emissions is occurring.
4. Hydro technology
Hydroelectricity production entails diversion of water from a river through a turbine to generate electricity. Some hydroelectric systems include dams that store large volumes of water. Others are run-of-river which include small or nearly zero storage, with energy production rising and falling according to day-to-day rainfall in the river catchment. A run-of-river hydroelectric power station that is downstream of a large dam takes advantage of storage in that dam to reduce dependence on day-to-day rainfall.
Water is conveyed from the water intake to the turbine and returned to the river through use of tunnels or pipes ('penstocks'), sometimes augmented with aqueducts. The pipe/tunnel must withstand large pressures. Depending on local geology, geography and the head, tunnels are sometimes partially or fully lined with concrete or steel.
The turbine spins in response to flow of high-pressure water. The turbine is attached to the generator which spins to produce electricity, which is sent to the switchyard for voltage transformation and transmission to distant loads. The turbine and generator are housed in the powerhouse, which can be underground. Multiple pipes are typically used to deliver water to multiple turbines within the powerhouse.
In pumped hydroelectricity storage systems, the turbine can become a pump: instead of the generator producing electricity, electricity can be supplied to the generator which causes the generator and turbine to spin in the reverse direction and pump water from a lower to an upper reservoir. Sometimes the pump and the turbine are separate items of equipment, but more commonly they are combined.
The power capacity of a hydroelectric system refers to the maximum rate of energy production. It is typically measured in Megawatts (MW) or GW where 1 GW equals 1000 MW.
The energy of a hydroelectric system refers to the amount of energy stored as potential energy in the upper reservoir. It is typically measured in Gigawatt-hours (GWh). A reservoir with 10 GWh of storage could operate with power of 1 GW for 10 h.
The head refers to the altitude difference between the water intake and the water egress. Since the cost of most components is largely independent of the head, a larger head will generally allow cheaper electricity generation and storage on a per-unit basis. Typical heads are in the range 100–800 m, although larger and smaller heads are sometimes used. The electrical power generated by the water as it passes through the turbine is equal to the product of the head (in metres), the water flow rate (in l s−1), the gravitational constant (9.8 m s−1) and the generation efficiency.
The efficiency of generation is about 90%. This means that 10% of the energy stored in an upper reservoir is lost when the water passes through the turbine to produce electricity. In a complete PHES cycle, water is pumped from a lower to an upper reservoir and at a later time returns to the lower reservoir, with a round-trip efficiency of about 80%. In other words, about 20% of the electricity is lost in a complete pumping/generation cycle.
For example, a flow of 100 m3 of water per second through a turbine/generator operating at 90% efficiency in a system with a head of 570 m will yield electrical power of 500 MW.
Hydroelectric systems that include large reservoirs can offer seasonal storage. Sufficient water is harvested from a river during the wet season and stored to allow significant electricity generation for many months.Large reservoirs can store thousands of GWh of energy.
Dams for hydroelectric systems are variously constructed of earth, rock and concrete and include a layer that is impervious to water such as concrete, asphalt, clay, plastic or steel. Structural integrity of a dam is usually by the Earth's gravity holding dam materials in place against the horizontal force exerted by the impounded water. Walls that curve into the reservoir can take advantage of the principle of the arch in combination with gravity. Dams constructed mostly of earth and rock can use local materials sourced from within the reservoir-to-be to minimize transport costs.
Dams impounding large amounts of water require particularly careful engineering because of large-scale adverse consequences of dam failure. Threats include earthquakes, floods overtopping reservoir walls, internal erosion caused by leaks in impervious layers and deliberate or accidental human actions. A well-designed and constructed dam can have a service life of a century or more and needs little maintenance.
A substantial part of the cost of a dam on a river is associated with accommodating occasional large floods. This includes construction of dam walls that are higher and stronger than required for everyday river flows, and construction of well-engineered spillways to safely divert flood waters over, through or around the dam wall.
5. Pumped hydro energy storage
5.1. Conventional river-based PHES
Many existing PHES systems have been developed in conjunction with a conventional river-based hydroelectric system. Two reservoirs are created, at different altitudes, but close to each other (figure 9). Often, the lower reservoir is large and located on a substantial river, while the upper reservoir is smaller, and located higher up on the same river or in a high tributary or parallel valley. Most river water passes through the system, generating electricity, and then flows on down the river. Some water is cycled between the two reservoirs to create energy storage. Typically, pumping would take place by buying electricity during times when prices are low, which is when demand is low or the availability of electricity from other sources is high (e.g. a windy and sunny day). Generation would take place during times of high demand (such as during evenings) when prices are high. This pattern of buy-low and sell-high is called arbitrage.

Figure 9. Tumut 3 on-river hydroelectric system (Snowy Hydro Ltd). Reproduced with permission from Snowy Hydro Ltd.
Download figure:
Standard image High-resolution image5.2. Ancillary services of PHES
An electricity transmission and distribution system is unable of itself to store significant quantities of energy. As demand rises and falls, so too must supply of electrical power to the grid, either from a matching variation in generation or through the use of storage as a buffer. A large electrical grid serving many customers will generally experience slowly fluctuating demand over a timescale of hours, because it is statistically unlikely that many customers would act in concert over a timescale of seconds or minutes.
In a traditional fossil or nuclear electricity system, nuclear and coal power stations operate continuously with little or slow (hours) variation in output. Fluctuating demand is matched by fluctuating output from peaking plant, typically gas turbines or hydroelectric power stations (including PHES). However, unexpected failure of a major generator or transmission cable can have an immediate large effect on power supply.
System failure is typically accommodated by ensuring that some additional generators are operational and ready to deliver power to the grid at short notice. For example, gas turbines and hydro generators can ramp to full power in minutes. Additionally, some non-critical loads can be quickly interrupted to ensure that energy continues to flow to other loads. To cope with supply problems on time scales of seconds, the heavy rotating mass of a generator in a fossil or nuclear power station represents rotational inertia which acts as an energy buffer.
In the future, wind and solar energy will supply most of the energy to the grid in many countries. Ideally, there will be strong interconnection of tens of thousands of wind and solar generators over millions of hectares via high voltage powerlines. Weather-related fluctuations in energy delivery will be slow (hours to days) because weather systems including cloud and wind bands move relatively slowly across the landscape. Technical failure rates of large numbers of small generators can be predicted statistically with high precision. Thus, the overall supply of PV and wind energy will be less prone to rapid unpredicted variations than in fossil or nuclear energy systems which have a small number of large generators, any one of which could fail unexpectedly.
However, failure of a high-power transmission line can cause rapid reduction in energy supply in any grid. Batteries respond very quickly (sub-seconds) to disturbances in frequency by injecting or absorbing energy, thus providing 'synthetic inertia'. The capabilities of a grid-scale battery to provide balancing support in a large system dominated by wind and solar has been demonstrated in South Australia [12].
PHES has characteristics that are well-suited for balancing large amounts of variable, inverter-based wind and PV. PHES has rapid response (from idle to full output in a time span of 20 s to a few minutes). PHES has rotational inertia if the generator is spinning, to replace the loss of the rotational inertia associated with conventional thermal generators when they retire. PHES has black start capability, meaning that an electricity system can be restarted after complete collapse of supply without the need for electricity supply to start the generators. Together, batteries and PHES can completely replace the ancillary services hitherto provided by fossil and nuclear generators [13].
6. Off-river (closed loop) pumped hydro systems
6.1. Off-river PHES
Nearly all existing pumped hydro systems are river-based. In many places, there is substantial environmental and social opposition to damming or modifying more rivers. However, there are alternative methods of constructing PHES that do not require significant modification to river systems. One method is to connect closely spaced existing reservoirs using underground tunnels and powerhouses. With care, there is low disturbance at the surface. One example is the 2 Gigawatt, 350 Gigawatt-hour, Snowy 2.0 system currently under construction underground in the World Heritage Kosciuszko National Park in Australia [11].
There is large scope for off-river (closed loop) PHES systems that are located away from any significant river. Most land is not near a river, and so a survey of potential pumped hydro sites that is confined to rivers will miss most potential sites.
An off-river PHES system (figure 10) comprises a pair of artificial reservoirs spaced several kilometers apart, located at different altitudes, and connected with a combination of aqueducts, pipes and tunnels. The reservoirs can be specially constructed ('greenfield') or can utilise old mining sites or existing reservoirs ('brownfield'). Off-river PHES utilises conventional hydroelectric technology for construction of reservoirs, tunnels, pipes, powerhouse, electromechanical equipment, control systems, switchyard and transmission, but in a novel configuration.
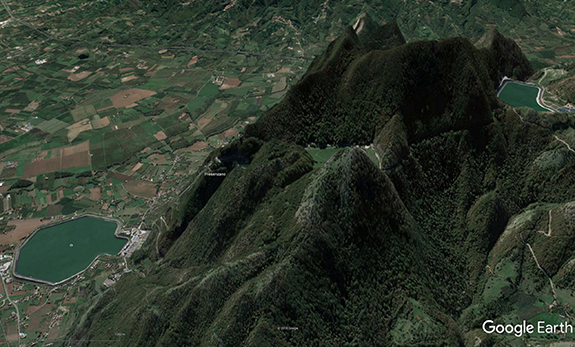
Figure 10. Google Earth synthetic image of a Gigawatt-rated off-river PHES site at Presenzano in Italy, showing the two reservoirs (upper right and lower left) with a head of 500 m (vertical scale exaggerated). Map data ©2021 Google.
Download figure:
Standard image High-resolution imageThe energy that is stored in an off-river PHES system is usually lower than in a major river-based hydroelectric dam with similar power rating. For example, a pair of 100 Ha reservoirs with a head of 600 m, an average depth of 20 m, a usable fraction of water of 90% and a round trip efficiency of 80% can store 18 Gigalitres of water with energy potential of 24 GWh, which means that it could operate at a power of 1 GW for 24 h. This is much smaller than the Three-Gorges Dam in China (23 GW, 87 000 GWh annual energy production) but much larger than a utility-scale battery such as the Hornsdale Power Reserve in Australia (0.15 GW, 0.2 GWh) [14].
An off-river PHES system has the advantage that flood mitigation costs are minimal compared with a river-based PHES system. Heads are generally better than river-based systems because the upper reservoir can be on a high hill rather than higher in the same valley as the lower reservoir. Environmental costs of damming rivers are avoided with off-river PHES, which helps with social acceptance. The much greater number of off-river sites compared with on-river sites allows much wider site choice from environmental, social, geological, hydrological, logistical and other points of view.
Another advantage is that construction of off-river pumped hydro can be much faster than other storage methods. Bespoke engineering in mountainous river valleys is unnecessary. Work can proceed in parallel on the two reservoirs, the water conveyance, the powerhouse and the transmission. Construction timetables of 2–3 years are feasible for 10 GWh storages, although longer periods would be typical. Although an individual battery can be completed in a few months, it is typically two orders of magnitude smaller than an off-river pumped hydro system, so the true speed of installation in terms of MW month−1 and Megawatt-hours (MWh) month−1 are modest.
6.2. An Atlas of off-river PHES
Locating good sites for PHES is not easy even for experienced hydro engineers. The first requirement is to find places where reservoirs can be constructed that store a large amount of water compared with amount of rock and other material used to construct the reservoir walls.
The second requirement is to find closely spaced pairs of sites that have large differences in altitude ('head'). The former requirement is because pipes and tunnels connecting the two reservoirs are expensive, and the latter requirement is because doubling the head doubles the storage energy volume and storage power capacity but does not double the system cost.
The use of efficient computer algorithms [15] is key to searching large areas for good sites. A global survey of greenfield off-river PHES was undertaken by the Australian National University. A total of 616 000 good sites [16, 17] around the world were found in the latitude range 60° N to 56° S. Each site comprises a closely spaced reservoir pair with defined energy storage potential of 2, 5, 15, 50 or 150 GWh. All identified sites are outside of major urban or protected areas. Each site is categorised into a cost-class (A through E) according to a cost model described below, with class A costing approximately half as much per unit of energy storage volume as class E.
For context, to support 100% renewables electricity (90% wind and solar PV, 10% existing hydro and bio), Australia needs storage [18] energy and storage power of about 500 GWh and 25 GW respectively. This corresponds to 20 GWh of storage energy and 1 GW of storage power per million people. Australia is an isolated country, and has high energy use per capita, similar to the aspirations of most countries.
The combined storage potential of the 616 000 identified sites is 23 million GWh (figure 11), which is 150 times more than required to support a 100% renewable global electricity system using Australia as a per capita benchmark. The identified sites are preferably widely distributed to support regional grids. An Atlas of off-river PHES sites is available at the Australian Government's Australian Renewable Energy Mapping Infrastructure sites at [16]. Users can pan and zoom to see detail of all 616 000 sites (figures 12 and 13).

Figure 11. Greenfield pumped hydro sites [16]. Image credit: Data61 hosting and Bing Map background.
Download figure:
Standard image High-resolution image
Figure 12. Greenfield 50 GWh sites in the United States of America. The redder dots are superior sites [16]. Image credit: Data61 hosting and Bing Map background.
Download figure:
Standard image High-resolution image
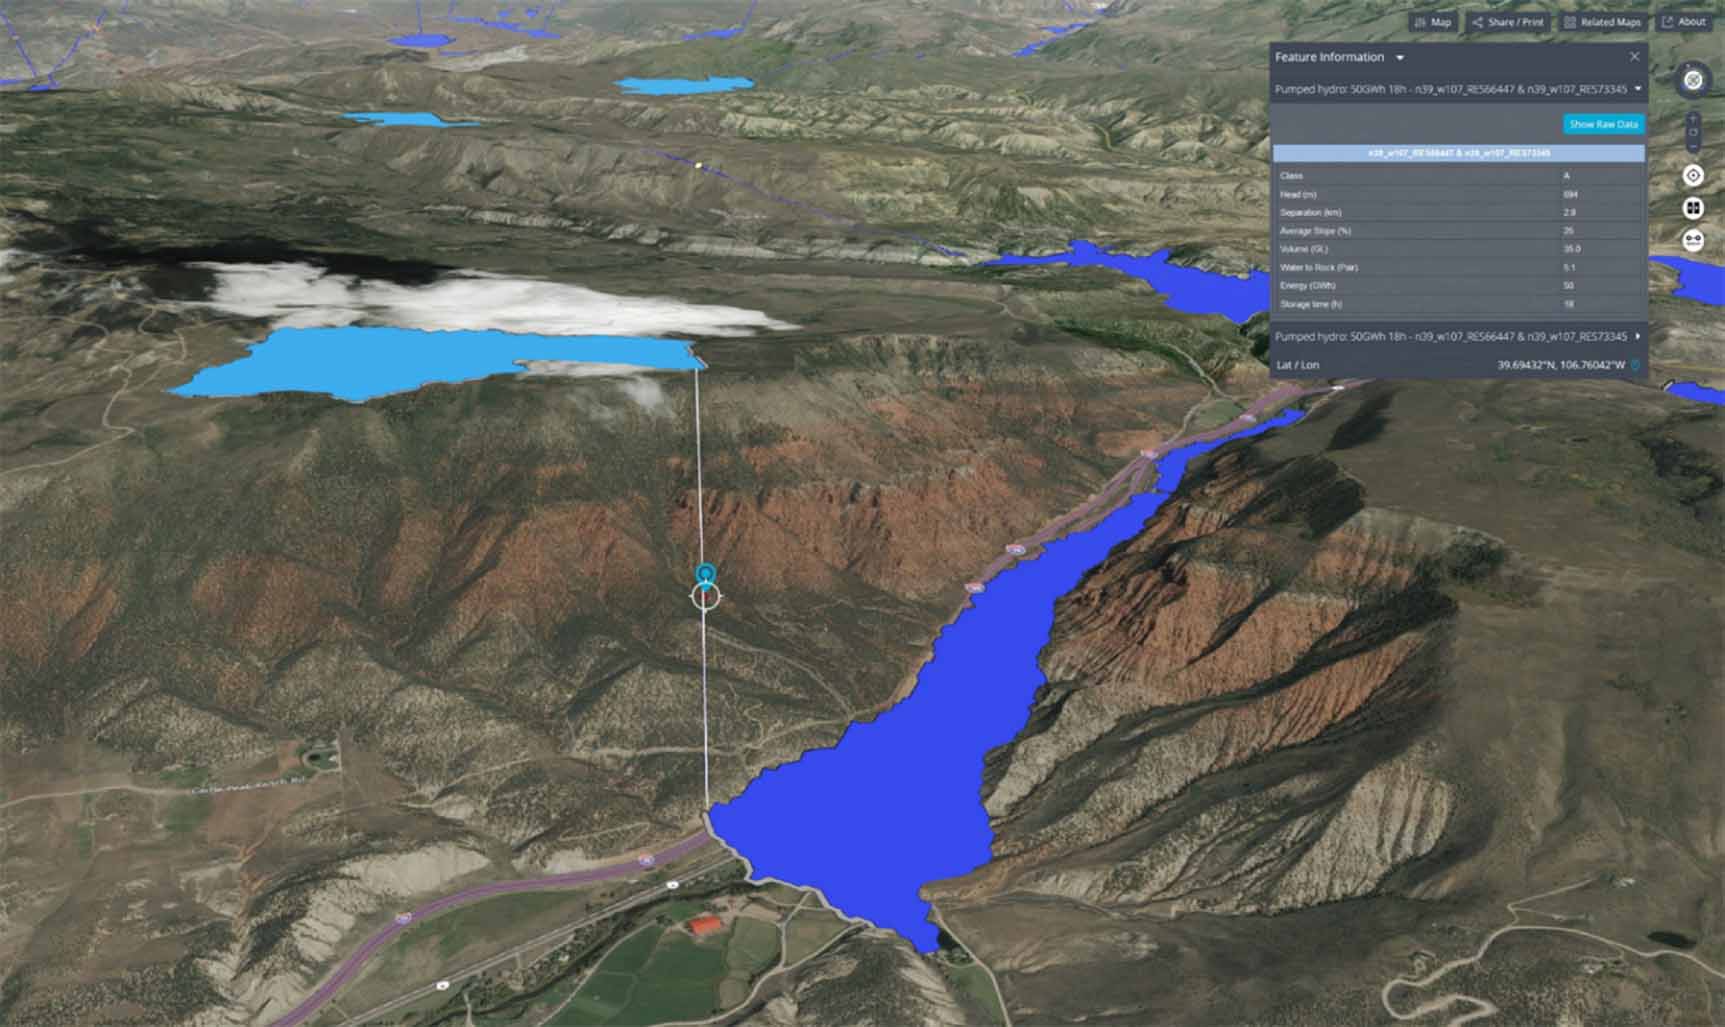
Figure 13. Individual greenfield site [16] showing upper reservoir (light blue), lower reservoir (dark blue), connecting tunnel route and information pop-up. Image credit: Data61 hosting and Bing Map background.
Download figure:
Standard image High-resolution imageThe ANU is now working on expanding this work to a brownfield survey. The aim is to survey the vicinity of existing reservoirs and mining pits to find out whether there is a possible matching reservoir site that could be used to form a good pumped hydro pair.
6.3. Cost of pumped hydro energy storage
The capital cost of a river-based hydroelectric system is highly dependent upon local geology, geography and hydrology. Such systems are frequently located in mountainous regions with difficult road access and lengthy distances for transmission. Environmental considerations are (hopefully) a high priority and constraint, both for the river and possibly also for surrounding mountains. The river needs to be diverted during construction, and provision must be made for major flooding during construction or subsequently. This means that each system is bespoke.
In contrast, the cost of an off-river pumped hydro system is relatively predictable. Cost models for a river-based hydro system are not applicable to an off-river system. The absence of a river eliminates major flooding as a criterion, and also eliminates the environmental consequences of flooding a river. Systems can be built in farmland with good road access and close to high voltage transmission systems. The volume of stored water (and the area of flooded land) is far smaller than a typical river-based hydroelectric system. Since there are two orders of magnitude more off-river than on-river sites in a typical landscape, it is generally straightforward to select an alternative nearby site if problems arise relating to geology, hydrology, road access, powerline easements, land ownership, indigenous rights, environmental impacts or social opposition. Most off-river sites are similar from key points of view, allowing a substantial element of 'copy and paste' to be employed in a large-scale storage construction program.
The cost of a hydroelectric system comprises six elements:
- (a)Planning and approvals
- (b)Construction of reservoirs
- (c)The water conveyance: tunnels, pipes, aqueducts
- (d)The powerhouse including pump/turbine, generator, switchyard and control
- (e)Access: roads, electricity transmission and water (for off-river systems)
- (f)Operations and maintenance over the life of the system.
6.4. Capital cost
The capital cost of an energy storage system has two components: an energy cost ($ GWh−1) and a power cost ($ GW−1). Sometimes these components are conflated into a single number (e.g. $ GW−1) by using a fixed storage time such as 6 h. This can sometimes be useful when comparing similar systems but is misleading when comparing different systems such as batteries and pumped hydro. A battery typically has a storage time of 1 h; i.e. it can operate at full power for one hour. Thus, a 1 h battery with a power of 0.1 GW has an energy storage of 0.1 GWh. In contrast, a 1 GW off-river pumped hydro system might have 20 h of storage, equal to 20 GWh.
Planning and approvals are generally easier, quicker, and lower cost for an off-river system compared with a river-based system.
The cost of storage energy ($ GWh−1) primarily relates to the cost of reservoir construction. The cost of constructing an off-river reservoir includes moving rock to form the walls, a small spillway and a water intake. Other significant costs could include road access, water access, lining the bottom of the reservoir to mitigate water leakage and placing evaporation suppressors on the water surface. Forming the walls is usually the dominant cost and can be approximated by the cost of moving rock ($ m−3). The amount of energy stored in a hydro system is proportional to the head and to the usable water volume of the reservoirs. The important reservoir metrics are (a) the head and (b) the ratio of water impounded to the rock required to form the reservoir walls. Doubling the head or doubling the water/rock (W/R) ratio both approximately halve the effective cost of energy storage ($ GWh−1).
The cost of storage power ($ GW−1) primarily relates to the cost of the water conveyance and the powerhouse. Additionally, transmission is sometimes a significant cost depending on distance to a high voltage powerline.
The expensive component of the water conveyance is the high-pressure pipe or tunnel that spans most of the altitude difference between the reservoirs. This pipe or tunnel is preferably short and steep. The water conveyance can include an aqueduct or low-pressure pipeline to minimise the length of expensive high-pressure pipe or tunnel if the local geography permits. A doubled power rating requires a pipe/tunnel with larger cross-sectional area to convey double the volume of water per second, but the cost increases less than proportionally. A doubled head halves the flow of water for a given power rating, thus reducing the cost of the pipe/tunnel. Thus, large head, large power rating and small effective separation of the reservoirs reduce the water conveyance cost in terms of $ GW−1.
The powerhouse cost in terms of $ GW−1 benefits from doubled power rating; although the volume of water flow per second doubles, the cost of the pump/turbine increases less than proportionally. Doubled head is desirable because water flow halves for a given power output, allowing a smaller pump/turbine to be used (albeit with higher pressure rating).
In summary, the energy cost ($ GWh−1) is minimized by having large head and large ratio of usable water volume to volume of rock needed to form the upper and lower reservoirs [17]. The power cost ($ GW−1) is minimized by having large head and large average slope of the pressure pipe or tunnel. As with many engineering enterprises, systems with larger power and energy are cheaper per unit than smaller systems.
Access to roads, water supply and transmission lines is highly site dependent. Since there is a wide range of sites to choose between, such costs can be minimized.
Annual operation and maintenance costs plus major refurbishments after 20 and 40 years cost about 1% of the initial capital cost each year. This corresponds to about 20% of the annualised capital cost assuming 60 year lifetime and 5% real discount rate.
Figure 14 shows the indicative capital cost of 1 GW off-river pumped hydro storage systems [17]. The importance of large head (500 m and above), large slope and large W/R ratio is illustrated. Systems with large energy storage volume cost more than smaller systems, but not proportionally so. The capital cost of high-quality systems with large storage volumes, head, W/R ratio and slope converge to similar numbers because the 1 GW powerhouse emerges as the dominant cost.
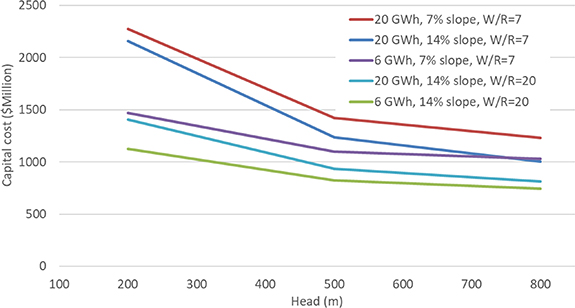
Figure 14. Indicative capital cost of 1 GW off-river pumped hydro systems with combinations of the key cost parameters: energy storage volume, head, slope and water–rock (W/R) ratio [17].
Download figure:
Standard image High-resolution imageIn many countries, no pumped hydro scheme has been constructed for many years (if ever). It is not unusual in the early stages of an industry for costs to be higher than expected. However, rapid cost reductions are possible as companies quickly learn to do things better.
6.5. Levelised cost of storage
Several items must be accounted for when calculating the cost of storage:
- (a)The capital cost of the system
- (b)The annual cost of operations and maintenance, including periodic major refurbishments
- (c)The amount of energy sold by the storage each year and the price received relative to the price paid for the energy sent to the storage
- (d)Losses in the energy storage cycle
- (e)The operational lifetime
- (f)The real discount rate.
The discount rate reflects the fact that people value money in the hand more highly than the promise of future money—which is why interest is charged on money that is loaned. A risky investment uses a higher discount rate. Almost all the costs of a pumped hydro system are up front, similar to a solar or wind power station, but unlike a gas power station where most of the costs are for fuel.
A typical real (after subtracting inflation) discount rate for a low-risk investment is 5%. Pumped hydro, solar and wind energy system costs are sensitive to the discount rate while gas and coal power systems are sensitive to changes in fuel prices. For a hydro system with a lifetime of 60 years, real discount rates of 1% or 12% approximately halve and double the levelized cost of storage respectively relative to a discount rate of 5%.
If one system cycles twice as often per year compared with another then the capital cost is spread over twice the volume of sales and the levelized cost of energy storage is approximately halved.
Figure 15 shows the levelized cost of storage for a range of parameters assuming 5% real discount rate, 60 year operational lifetime and 180 or 360 cycles yr−1. The levelised cost of storage in this context means the average difference between the purchase price of energy used to pump water to the upper reservoir (which is set by the external market and assumed to be $40 MWh−1 in this example calculation) and the required selling price of the energy from the storage. The required selling price is higher than the purchase price to cover the capital and operational costs over the system lifetime and the round-trip storage energy losses.

Figure 15. Levelised cost of storage for 1 GW off-river pumped hydro systems with combinations of the key parameters: energy storage volume, head, slope, water–rock (W/R) ratio and cycles yr−1 [17].
Download figure:
Standard image High-resolution image
In a real pumped hydro storage income from arbitrage may be highly non-uniform, with a large proportion coming from very high prices during occasional stress periods for the electricity network, such as during heat waves (caused by air conditioning) or supply failures elsewhere in the network. Revenue from ancillary services may also be important, including payments for provision of black start and rapid start capability, voltage and frequency maintenance, rotational inertia of the generator (to cover sub-second glitches), and network insurance (maintaining full upper reservoirs over long periods).
7. Environmental impacts
The environmental impact of PHES primarily relates to flooding of land within the reservoirs. If the reservoirs are located in a river valley then environmental impacts are likely to be more severe than for an off-river system located away from rivers. Other environmental impacts include construction of roads, pipes or tunnels for water conveyance, a powerhouse and switchyard, and high voltage transmission lines. Since there are far more potential off-river than on-river sites it is much easier to choose an off-river site that minimizes environmental impact.
7.1. Required storage volume
Detailed analysis is required to calculate the amount of storage required to support an electricity system that depends mostly on variable wind and solar PV.
Solar PV and wind energy comprise two thirds of net new generation being constructed around the world. In some countries they comprise nearly 100% of generation power capacity additions. They are both variable energy sources, with power output rising and falling in response to the sun and the wind. When small amounts of PV and wind are added to an electricity system, the existing storage and fast-response gas generators can ensure that the system remains stable. As more and more PV and wind are added, additional measures will eventually be required.
Methods of ensuring that energy supply and demand in an electricity system is balanced on every time scale from sub-seconds to months include the addition of storage; the addition of high voltage transmission to smooth out local weather and demand fluctuations by importing and exporting electricity; and management of demand to reduce peak demands and respond quickly to supply interruptions.
A recent study [18] examined the amount of storage required to support a 100% renewable electricity system in Australia which derives 90% of its energy from variable wind and solar and 10% from existing hydro and bioenergy sources. The analysis matched historical supply and demand for every hour of the year over many years by including sufficient solar and wind generation, storage and transmission. Australia is an industrialized country with high per-capita consumption of electricity by world standards (10 MWh person−1 yr−1). It is isolated from its neighbors, has good solar and wind resources, and is installing solar and wind faster per capita than any other country. It is a global pathfinder [4] for adapting its electricity network accordingly.
Australia lies mostly in the sunbelt (lower than 35 degrees of latitude) where there is low seasonal variation of the solar resource and no cold winter. About three quarters of the global population lives in the sunbelt, including countries in which most of the growth in population, energy consumption and Greenhouse emissions is occurring. Australia represents a state that much of the world's population might aspire to and reach over the next few decades.
Australia's National Electricity Market spans about 1 million km2 in the eastern and south eastern parts of the continent. Strong long-distance transmission was found to minimize the amount of required storage. Broadly speaking, the study concluded that the required storage power and storage energy are 1 GW and 20 GWh per million people respectively. The amount of energy storage required is similar to the average daily electricity consumption (27 GWh d−1 per million people).
The storage requirements for a particular country would need to be determined by detailed calculations. An approximate rule of thumb for the amount of storage needed to support a large-area electricity network with high levels of variable solar and wind is 1 d (24 h) of energy consumption. This allows the day-night cycle of solar energy output to be accommodated. This storage could be a combination of pumped hydro and batteries. Demand management is equivalent to storage and can also contribute. Furthermore, occasional spillage of solar or wind electricity on sunny and windy days when storages are full is economically preferable to overbuilding storage to absorb all the generated energy. Typical spillage of solar and wind electricity in optimized hourly-resolution modelling studies is 5%–25% [18].
7.2. Land requirements
The area of land required for the upper and lower reservoirs per GWh of storage is about 12 hectares for an off-river pumped hydro system with a head of 400 m, generation efficiency of 90%, usable water volume of 85% and average water depth of 20 m.
Taking an energy storage volume requirement of 27 GWh per million people (the one-day-storage rule of thumb estimated above), this corresponds to 3 m2 person−1, which is about the same area as a queen-sized bed.
The land flooded for off-river pumped hydro is relatively small and can avoid sensitive areas. For example, the electricity storage needs of a million-person city could be provided by an off-river PHES system with a power rating of 1 GW and one day of storage that floods 3 km2 of land located away from any river and outside environmentally sensitive areas. This is vastly less than the area required to deliver an equivalent amount of energy from conventional hydropower with commensurately less impact. This is due to the much shorter storage durations (hours rather than months) and the frequent recycling of the reservoir volume. Because most countries have a large over-abundance of potential sites, if one site is problematic then an alternative site could be selected.
A solar PV system in a typical sunbelt location will generate about 160 GWh km−2 yr−1, assuming a system capacity factor of 18%, panel efficiency of 20% and land coverage by the panels of 50%. If average electricity consumption is 10 MWh person−1 yr−1 (similar to Australia and Singapore) then the area of land required for the panels is 60 m2 person−1. This is 20 times larger than the area of land required for the supporting PHES system estimated above.
Floating PV could be located on pumped hydro reservoirs provided that the floats are designed to accommodate turbulence and rapid fluctuations in water depth. In the case of off-river pumped hydro reservoirs, the reservoir area per person is only 5% of the per capita area requirement to achieve 100% solar electricity. Floating PV will provide the additional benefit of reducing evaporation in arid regions.
In summary, the land area required for off-river PHES systems to support high levels of variable solar and wind generation is relatively small and can be selected to minimise sensitive land.
7.3. Water requirements
The volume of water required per GWh of energy storage is about 1 Gigalitre for an off-river pumped hydro system with a head of 400 m and generation efficiency of 90%. Doubling or halving the head halves or doubles the water requirement respectively.
Taking an energy storage volume requirement of 27 GWh per million people (the rule of thumb estimated above), this corresponds to 27 kl person−1. This water is not actually consumed—it cycles indefinitely between the upper and lower reservoirs. If a fleet of off-river PHES systems were constructed over a 25 year period to support the development of a solar and wind electricity system, the amount of required water for the initial fill would be 3 l person−1 d−1.
After completion and filling of the reservoirs, evaporation losses need to be replaced. In many places, annual rainfall and evaporation over the reservoir area are approximately balanced. Evaporation suppressors (small plastic objects floated on a reservoir to reduce wind speeds and evaporation rates) can tip the balance in favour of rainfall in arid regions. In a dry country such as Australia, pan evaporation in the regions that are prospective for off-river pumped hydro (along the Great Dividing Range) is about 1600 mm yr−1 [19]. Evaporation from lakes in hot climates is about two thirds [20] of the pan evaporation rate (i.e. 1100 mm yr−1). Since rainfall in these regions is about 750 mm yr−1, the annual difference between evaporation and rainfall is about 350 mm yr−1. Since the required combined area of upper and lower reservoirs per person (calculated above) is 3 m2 person−1, the evaporation rate is about 3 l person−1 d−1.
In summary, the amount of water required for the initial fill and to replace evaporation is about 3 l person−1 d−1. This is similar to the amount of water used by a person in 20 s of a typical daily shower.
An electricity system based mainly on wind, solar and PHES rather than coal fired power stations will benefit from the absence of water loss in cooling towers, which is an order of magnitude larger per person [21].
8. Future energy
Pumped hydro provides storage for hours to weeks [22, 23] and is overwhelmingly dominant in terms of both existing storage power capacity and storage energy volume. However, a range of storage technologies are under development [24].
The use of home batteries is rapidly increasing, although the small size of home batteries means that they will have modest impact at a grid scale.
Utility-scale (100 Megawatt) batteries are being widely deployed in many places to provide storage of electrical energy for sub-seconds to a few hours. These batteries provide far faster, more reliable and more accurate response to disturbances of frequency and voltage in the grid than traditional techniques such as gas generators [12].
Demand management is akin to storage in many respects. Demand management can include paying people to reduce air conditioning loads during a stress period, avoiding charging electric vehicles during evening peak periods, moving water heating to daytime, switching off aluminium smelters for a few hours, or even paying some factories to have a holiday if an occasional wet windless week in winter is forecast.
Deep electrification of most energy functions through the use of solar and wind energy can drive all gas, oil and coal out of the global economy. Emissions reductions of three quarters or more [4] would result.
Roughly speaking, electricity demand needs to triple [25] in order to electrify transport (via electric vehicles), heating (via electric heat pumps and electric furnaces) and chemical synthesis. The latter includes the production of low-emission iron and steel, ammonia, plastics and synthetic fuels. Production of these materials usually requires hydrogen (which can be produced by water splitting) and carbon (for which the most likely long-term large-scale sustainable source is air capture of carbon dioxide). Electricity is highly likely to be the main energy form for production of sustainable hydrogen, carbon and derivative chemicals.
Some of these energy demands have large-scale inherent storage, including the batteries in millions of electric vehicles (typically 50 GWh per million vehicles), hot water in storage tanks, and stored hydrogen and carbon in a chemical synthesis plant.
The storage needs of electricity grids supplied mostly by variable solar and wind generation are likely to be met through a combination of many methods as described above.
Many studies model large-scale renewable energy systems based on variable solar and wind energy, some of which are summarized in [4]. Large-scale storage is an integral component of the models, to ensure that generation and demand are balanced on all time scales. The identification of off-river PHES as a very large scale, very mature, low-cost storage method for which reliable cost estimates can be readily determined is important because it allows an upper bound to be placed on the cost of storage. If batteries or some other method undercuts pumped hydro in the future, then costs of balancing a renewable electricity system based on solar and wind will fall below the upper bound established by pumped hydro.
Importantly, the upper bound on the cost of storage provided by pumped hydro is a relatively small number compared with the cost of generation. For example, the cost of the storage required to support a 100% renewable electricity grid in Australia is about $7 MWh−1 [18] assuming that all the storage is pumped hydro. The cost of additional transmission and periodic spillage of solar and wind energy when the storages are full brings the balancing cost to about $18 MWh−1. This can be compared with the current and expected cost of solar and wind energy of $30–50 MWh−1 and $15–25 MWh−1 [26] in 2020 and 2030 respectively. In summary, storage is not expensive.
9. How much global storage will be needed?
No one can reliably predict future energy consumption and storage requirements. However, it is useful to gain some idea of prospective scale. Major economies including Europe, China, Japan and the USA are committing to reach zero emissions by 2050–2060. It is likely that solar and wind will be the dominant methods used to drive all fossil fuels out of the global economy because their cost and annual deployment scale are much more advantageous than other low emissions technologies.
Per capita electricity consumption in advanced economies is in the range of 5–10 MWh person−1 yr−1. Complete elimination of fossil fuels from the economy entails an approximate tripling of electricity production [25]. Thus, global electricity production may reach about 20 MWh person−1 yr−1.
The global population is expected to reach about 10 billion in mid-century. When developing countries catch up to per capita energy consumption in today's advanced economies, then global electricity production of about 200 000 TWh yr−1 will be required. Assuming that electricity is produced by deployment of a combination of solar (60%), wind (30%) and other methods (10%), a total of 81 TW of solar and 17 TW of wind power will be required (assuming average system capacity factors of 17% and 40% respectively). Deployment rates of solar and wind need to grow by a factor of 20 to eliminate fossil fuels by 2050.
If we assume that one day of energy storage is required, with sufficient storage power capacity to be delivered over 24 h, then storage energy and power of about 500 TWh and 20 TW will be needed, which is more than an order of magnitude larger than at present, but much smaller than the available off-river pumped hydro energy storage resource (23 000 TWh).
10. Conclusion
The key driver for a renaissance in pumped hydro storage is the rapid rise of variable PV and wind. Once many countries achieve solar and wind penetration of 50% or more, large amounts of storage will be required.
Electricity consumption in sunbelt countries is likely to rise rapidly in coming decades as economic development proceeds. Since the cost of new-build solar and wind is below the cost of new-build fossil, nuclear or renewable energy alternatives, most of the new generation will be provided by solar and wind. This means that large increases in the amount of storage will be required to balance variable solar and wind. Pumped hydro and batteries are complementary storage technologies and are best suited for longer and shorter storage periods respectively.
In this paper we explored the technology, siting opportunities and market prospects for PHES in a world in which most electricity is produced by variable solar and wind. Vast numbers of potential off-river pumped hydro sites were identified in most regions of the world, far exceeding the number required to support 100% variable renewable electricity systems. Off river PHES is likely to have low environmental impact and low water consumption.
Importantly, the known cost of pumped hydro storage allows an upper bound to be placed on the cost of balancing 100% variable renewable electricity systems. The all-in cost of fully balanced 100% solar and wind electricity systems is below the cost of an equivalent fossil fuel system for most of the world.
Acknowledgments
Grateful acknowledgement is made to Roger Fulton who generously shared his extensive knowledge of hydro with us. Thank you also to the anonymous reviewers. Our work has been supported by the Australian Government through the Australian Renewable Energy Agency (ARENA). Responsibility for the views, information or advice expressed herein is not accepted by the Australian Government."