
Abstract
High-density reactive species plasmas uniformly covering large surface areas are required for semi-conductor processing. Novel, self-matched plasma sources using microwave solid state generators have been developed for this purpose. The technology applied, based on automatic frequency tuning, allowed to eliminate the impedance matching system. Large surface plasmas have been achieved by using a distribution of elementary sources. A big campaign of plasma density measurement using a Langmuir probe has allowed to create a database for different plasma conditions for a single source. Thanks to an internally developed software, the density obtained with several sources in various distribution configurations has been simulated. The position and the power of each source have been optimized and the calculations have been validated by experimental measurements. High plasma densities >1011 cm−3 over large areas >400 mm in diameter with only 13 plasma sources have been achieved with all tested gases. An increase of compactness i.e., increasing the sources number over the same area, allows to have the same plasma surface while increasing the plasma density up to 5 × 1011 cm−3.
Export citation and abstract BibTeX RIS

Original content from this work may be used under the terms of the Creative Commons Attribution 4.0 licence. Any further distribution of this work must maintain attribution to the author(s) and the title of the work, journal citation and DOI.
Introduction
Nowadays, large-scale plasma processes with great uniformity and high ion density, are more than mandatory for the industry of surface treatment, such as PECVD (Plasma Enhanced Chemical Vapor Deposition) or deep etching, which are always seeking faster deposition or etching rates. These needs have been the key to develop novel plasma sources allowing the creation of uniform plasma with high density and capability to generate high concentration of reactive species.
Even if they are well reputed for their elevated plasma density, microwave plasmas suffer from the difficulty of their integration in an industrial process due to their need for an impedance matching control system which is very difficult to automate. In addition, the critical density limiting the propagation of the waves makes it complex to extend the plasma volume by using several plasma sources. Besides, to cover large areas, several sources must be used. The geometrical distribution of the sources has to be mastered and the power needed by every source has to be optimized which adds another constraint to the process.
Scaling up plasma applications starts by controlling the distribution and the uniformity of the electric field over large processing surfaces. Distributed electron cyclotron resonance (DECR) plasmas, combining multipolar magnetic field confinement and microwave excitation at Electron Cyclotron Resonance (ECR), have shown their potential to produce large area plasmas by using linear microwave applicators (antenna) [1–4]. Due to the necessity of the microwaves to propagate along the antenna, the DECR plasma density cannot exceed the critical electron density nc, defined by  calculated as below [2]

where,  is the microwave angular frequency,
  is the electron plasma angular frequency,
  the vacuum permittivity,
  the mass of the electron and e the electron charge. At the microwave frequency
  equation (1) gives nc = 7.5 × 1010 cm−3. Different approaches have been studied to overcome this problem. Petasch et al have proposed a linear antenna where the microwaves propagate along metal rods surrounded by dielectric tubes allowing the generation of a surface wave plasma at the interface between the tube and the plasma [5]. In this technic, the plasma density decreases in the direction of the wave propagation and does not exceed significantly the critical value. The low homogeneity of this plasma could be improved by using several antennas placed in opposite directions. However, the microwave power most be evenly split between the antennas which complicated the process as the plasma sources are not matched to the microwave generators. An impedance matching system is thus required. To surmount some of this limitations, two or tri-dimensional network of several elementary ECR sources have been used [6–8]. The elementary plasma source consists of a cylindrical magnet fed with microwave via a coaxial cable and can produce plasma densities between 1011 and 1012 cm−3.
The multipolar magnetic confinement is provided by permanent magnets allowing the creation of the magnetic field for ECR coupling. At low pressure, by combining the microwaves with the static magnetic field at a frequency of electromagnetic waves equal to the gyration frequency of the electrons, the electrons are subject to an efficient heating mechanism and they will have a helical motion with the electron cyclotron angular frequency:

where,  is the electron cyclotron angular frequency, B is the magnetic field strength. Superimposed with a perpendicular electric field, the electrons will sustain additional forces at the frequency
  of the applied electric field. The resonance occurs at
  and results in a conical spiral motion of the electrons. At microwave frequency of 2.45 GHz, the resonant condition is reached when
  Hence, the electrons gain considerable energy that allows to ionize neutral particles of the gas and breakdown the plasma due to cascade reactions. For the ECR phenomenon to be efficient, the electron elastic collision frequency must be much smaller than the angular frequency of the applied electric field (ν/ω = 10−2–10−4) which allows the electrons to accumulate high energy between two collisions allowing the plasma ignition at low pressure, typically between 10−2 and 1 Pa. At lower pressure the electrons with high energy start to lose their energy by collisions with the reactor walls rather than via collisions with gas particles which reduce the ionization processes preventing the plasma ignition.
This technic uses a power distribution system to supply the microwave power to all the sources from a single microwave generator. However, the microwave power has to be equally distributed between the sources and the use of a matching impedance device is mandatory. Since the integration of such system is not easy in an industrial process and requires to have a solid microwave knowledge by the operator, thus their use is more suitable for laboratory applications.
To overcome this problem, we have developed a new ECR coaxial microwave plasma source, the 'Aura-Wave' [9]. The innovative design of the source prevents power loss within the source and allows to be quite self-matched over wide operating conditions without need of any impedance matching system [9, 10]. The source works with a 2.45 GHz microwave solid state generator with a variable power between 1 and 450 W with 1 W increment, and the frequency could be adjusted automatically between 2.4 and 2.5 GHz to compensate low mismatching [11]. Thus, each plasma source could deliver to the plasma a transmitted microwave power regulated with 1 W step.
The coaxial ECR source Aura-Wave consists of an encapsulate cylindrical permanent magnets mounted in opposition within the coaxial structure [12]. It sustains plasmas from 10−2 Pa up to a few Pa with densities up to a few 1011 cm−3 in multisource configuration [13].
Figure 1(a) presents a schematic cut view of the Aura-wave source showing the magnetic field line. The ECR effect took place very close to the source's head, in the region delimited by the field line B = 0.0875 T shown in figure 1(b), where the magnetic field is very high as shown in figure 1(c) (0.16 Tesla at 20 mm), creating a confinement zone in the direction of the center of the plasma chamber, which limits losses on the walls. This effect is very localized in a tiny region since the magnetic field decreases abruptly with the distance (0.0027 Tesla at 50 mm). The electrons are trapped in mirror magnetic field lines and accelerated to the ECR frequency when they cross the ECR area. Plasma is produces locally and diffused outside thanks to fast electrons.
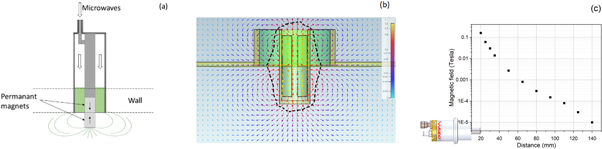
Figure 1. (a) Schematic view of the Aura-Wave source showing the permanent magnets, (b) simulation of the magnetic field and the dotted field line B = 0.0875 T corresponding to the ECR condition at 2.45 GHz and (c) logarithmic variation of the magnetic field as function of the distance from the source plane measured with a Koshava 5 magnetometer.
Download figure:
Standard image High-resolution imageThe aim of this study is to achieve large plasma surfaces with high uniformity and high density by using different networks of several Aura-Wave sources. Plasma density was measured by a Langmuir probe. A prediction of the experimental results was realized thanks to an inhouse developed simulation software and compared to the measurements.
Experimental
The experiments were conducted in a multi-source plasma reactor of 700 mm of diameter equipped with a system of pumps allowing to reach a background pressure of 10−7 mbar. The reactor showed in figure 2 permits the integration of 25 SAIREM Aura-Wave plasma sources giving the flexibility to test a lot of different configurations. Every source is connected to its own microwave module solid state generator (SAIREM MMS450) which can deliver a maximum power of 450 W. This gives the possibility to control the power sent to each source independently. The plasma density was measured by a Langmuir probe from Impedans©. Figure 3(a) shows a top view of the reactor and the Langmuir probe. The plasma gases were injected through 8 points in order to ensure a homogenous repartition inside the chamber. The Langmuir probe is equipped with a vacuum translation system of 600 mm in length. It allows the acquisition of plasma properties all along the translation axis parallel to the source plane as shown in figure 3(b). The reactor is equipped with several ports allowing the installation of the Langmuir probe at different distances 'd' from the source plane, between 6 and 14 cm each 2 cm.

Figure 2. (a) Picture of the plasma reactor with 25 Aura-Wave sources used in this study, (b) picture of the Aura-Wave source and an oxygen plasma generated by 25 sources with 10 KW total microwave power.
Download figure:
Standard image High-resolution image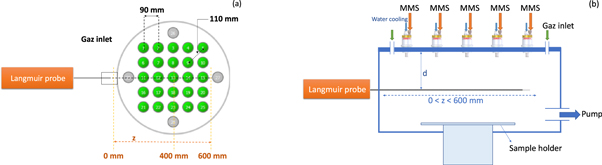
Figure 3. Schematic view of (a) top view of the reactor with 25 Aura-Wave sources, (b) the translation axis of the Langmuir probe inside the reactor, each source is connected to its own Microwave Module Solid state generator (MMS).
Download figure:
Standard image High-resolution imageThe strategy followed in this work starts by the acquisition of the density profile of one source for a plasma of pure oxygen, nitrogen and argon as a function of the transmitted microwave power at different pressures (between 0.1 and 4 Pa) and different distances from the source plane. In a second time, the relation between the density and the transmitted power was determined by measuring the maximum density in front of the plasma source while varying the transmitted power. The density profile was integrated in the simulation software and projected in the 2D plan at the distance of acquisition, assuming the circular symmetry of the density centered on the source, at a fixed distance d. In the simulation software, the number and the repartition of the sources was defined. The resulting density profile was calculated and optimized by varying the density coefficient for every source until obtaining the largest plasma surface for a given uniformity percentage (5% which is the tolerated density uniformity in most applications). The power corresponding to the optimized density coefficient was determined from the power-density relation already found. The simulated configuration was tested experimentally and the correlation between the simulations and the experimental results was discussed.
Results and discussion
Single source study
In this part, we were concerned by studying the influence of all plasma parameters on the plasma density obtained with one Aura-Wave. The following results represent the variation of the ion density as a function of the pressure and the power at different distances from the source with nitrogen, oxygen and argon pure plasmas.
Nitrogen plasma
Figure 4 shows the variation of the ion density for pure nitrogen plasma. The density increases with the microwave power and decreases with the distance. While the optimal pressure, at which the maximal density is obtained, depends on the distance. The highest density at a distance of 6 cm is around 27 × 1010 cm−3 and obtained at 3 Pa, while at 14 cm, the highest density is obtained at 1 Pa and records a value of 4 × 1010 cm−3. In fact, when the pressure increases, the mean free path of electrons decreases. So, the ionization is more localized closer to the plasma source. In addition, the optimal pressure depends both on the balance between creation/losses close to the plasma source, which increase with pressure, and on the species diffusion which expands when the pressure decreases.
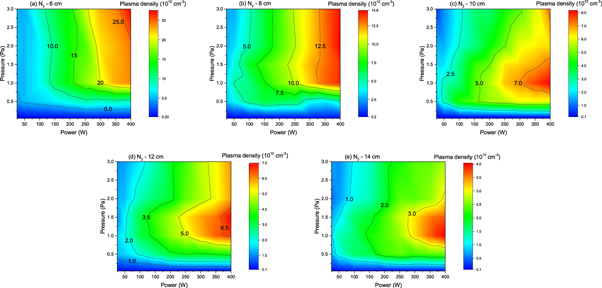
Figure 4. 3D graphs of the evolution of the plasma density as a function of power and pressure at (a) 6 cm, (b) 8 cm, (c) 10 cm, (d) 12 cm and (e) 14 cm in front of the center of the Aura-Wave plasma source for a pure nitrogen plasma.
Download figure:
Standard image High-resolution imageOxygen plasma
Graphs of figure 5 show the variation of the density in pure oxygen plasma. The results are quite similar to the previous ones obtained with nitrogen plasma. At 6 cm, a maximal density of 36 × 1010 cm−3 is obtained at a pressure of 4 Pa. By increasing the distance from the source, the density decreases to reach, at 14 cm, around 4 × 1010 cm−3 as highest value at 2 Pa.

Figure 5. 3D graphs of the evolution of the plasma density as a function of power and pressure at (a) 6 cm, (b) 8 cm, (c) 10 cm, (d) 12 cm and (e) 14 cm in front of the center of the Aura-Wave plasma source for a pure oxygen plasma.
Download figure:
Standard image High-resolution imageArgon plasma
At first look, one can notice that the graphs obtained in argon plasma exhibit a different behavior than with the other gases. However, in this case, the pressure was limited to 2 Pa because of the augmentation of the reflected power due to the much higher densities obtained compared to molecular gases at equivalent power and pressure. A further increase of the pressure should lead to the same evolution as with nitrogen and oxygen plasmas. As shown in figure 6, whatever the distance from the source, the maximal density is obtained at 2 Pa. A high density near 50 × 1010 cm−3 is obtained at 6 cm. It decreases when the distance increases to reach a value around 8 × 1010 cm−3 at 14 cm.
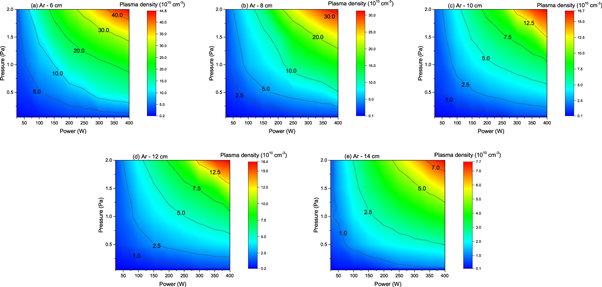
Figure 6. 3D graphs of the evolution of the plasma density as a function of power and pressure at (a) 6 cm, (b) 8 cm, (c) 10 cm, (d) 12 cm and (e) 14 cm in front of the center of the Aura-Wave plasma source for a pure argon plasma.
Download figure:
Standard image High-resolution imageThe comparison of the ion density obtained with the three gases shows that, for same plasma parameters (same distance, power and pressure), the density for argon plasma is higher than that of oxygen and nitrogen. In fact, with molecular gases, an amount of the injected energy, corresponding to the binding energy shown in figure 7(a), is used in the dissociation of the molecules which reduces the energy amount used for ionization. This could also be correlated with the electron temperature shown in figure 7(b) as a function of the microwave power at 10 cm from the source plane and a pressure of 1 Pa. As the electron temperature increases, the probability of ionization increases. The highest values obtained with argon around 2.2 eV are translated by higher ion densities than Oxygen and nitrogen with electron temperatures around 1.2 and 0.5 respectively. The electron temperature remains quite constant with increasing power for each gaz.

Figure 7. (a) Variation of the electron temperature as function of power and for the three plasma gases measured at 1 Pa (at 10 cm from the source plane). (b) necessary energies to dissociate or ionize molecular O2 and N2 and atomic Argon gas.
Download figure:
Standard image High-resolution imageMulti-source configuration
The density profiles obtained with a single source were used as a database for the simulation software to calculate the density generated by several plasma sources. The distance between the sources and the microwave power applied to each source could be optimized in order to have the highest plasma uniformity on a given diameter. Plasma sources could be used in a linear, circular or matrix configuration. Following, five examples of different configurations with different plasma parameters are presented. In each example, the impact of a different parameter on the plasma density and uniformity was discussed.
13 Aura-Wave, distribution optimization effect
Figure 8 shows the simulated and measured plasma densities at 14 cm from the source plane, for 13 Aura-Wave sources for an argon plasma at 0.5 Pa sustained by microwave power of 400 W/source. In figure 8(a), the sources were disposed in a quasi-matrix configuration with a distance of 90 mm between sources. A very high density around 50 × 1010 cm−3 is reached with 5% uniformity over 160 mm of diameter. In the configuration of figure 8(b), the distribution of the sources was optimized through simulations. It could be noticed the perfect correlation between experimental and simulation results. Experimental measurements show a decrease of the density (12 × 1010 cm−3) in favor to a huge gain of the plasma uniformity where 5% uniformity are achieved on a diameter around 400 mm.

Figure 8. Simulated and measured density profiles for argon plasma at 0.5 Pa, 400 W/source (5.2 kW total power) obtained at 14 cm with 13 Aura-Wave sources distributed in(a) quasi matrix configuration and (b) optimized configuration.
Download figure:
Standard image High-resolution imageMatrix distribution ( ) Aura-Wave, power optimization effect

Figure 9 shows the simulated density distribution and the experimental curve for a matrix configuration of 25 Aura-Wave with lattice constant a = 90 mm realized at 10 cm from the source plane for a nitrogen plasma at a pressure of 1 Pa. In figure 9(a), all the sources were equally supplied by 400 W. A very high maximum density of 35 × 1010 cm−3 is achieved. 5% plasma uniformity was found on 240 mm of diameter. The effect of power optimization is clearly seen in figure 9(b). The peripherical sources were supplied by 400 W/source while the 9 central sources were supplied by 75 W/source. A bigger uniformity diameter is achieved (370 mm for 5% uniformity). However, even if the maximum density records a small decrease, it still has a very high value around 20 × 1010 cm−3.
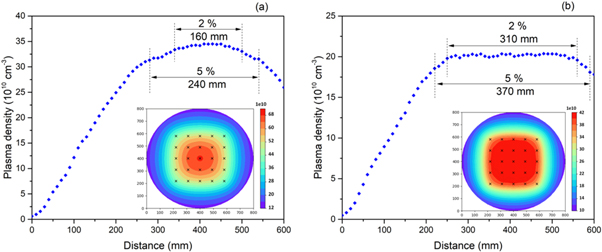
Figure 9. (a) Simulated and measured density profiles for a matrix of 25 Aura-Wave, a = 90 mm, d = 10 cm, N2, 1 Pa, (a) 400 W/peripherical sources and 400 W/central sources (10 kW total power) and (b) 400 W/peripherical source and 75 W/central sources (7.075 kW total power).
Download figure:
Standard image High-resolution imageFigure 10 shows the translation axis of the Langmuir probe for the measurements realized at 10 cm from the source plane. The trajectory is tilted around the diagonal axis because of the position of the port. This allows to have a profile corresponding to the diameter of the uniformity disk and not to the diagonal of the matrix.
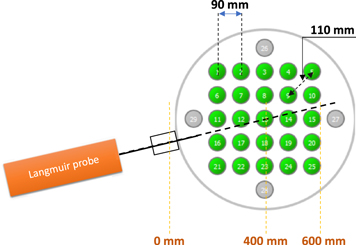
Figure 10. Schematic view of the translation axis of the Langmuir probe for measurements done at 10 cm from the source plane.
Download figure:
Standard image High-resolution imageMatrix distribution () Aura-Wave, N2 versus O2

Figures 11(a) and (b) show the density profile for a (3 × 3) matrix configuration (lattice constant a = 110 mm) realized at 10 cm from the source plane at 1 Pa for a plasma of nitrogen and oxygen respectively. With external sources at 400 W, the simulations have shown best uniformity when the central source is at 110 W and 80 W for nitrogen and oxygen, respectively. A good correlation between simulation and experimental measurements is observed. A uniformity of 5% is obtained on a diameter around 300 mm for both gases. The maximum density achieved with nitrogen plasma (∼14 × 1010 cm−3) is slightly higher than that obtained with oxygen plasma (∼10 × 1010 cm−3). However, the density profiles obtained with the two plasma gases are very similar.

Figure 11. Simulation and experimental density obtained with a matrix configuration of (3 × 3) Aura-Wave with lattice parameter a = 110 mm, at 10 cm from source plane at 1 Pa for (a) Nitrogen plasma (3.31 kW total power) and (b) Oxygen plasma (3.28 KW total power).
Download figure:
Standard image High-resolution imageMatrix distribution () Aura-Wave, 10 cm versus 14 cm

In this example, we investigated the evolution of the plasma density as function of the distance. Figure 12 represents the simulated and experimental density obtained with 16 Aura-Wave distributed in a  matrix configuration with lattice constant a = 110 mm realized at 10 cm (figure 12(a)) and 14 cm (figure 12(b)) from source plane for a nitrogen plasma at 1 Pa. The optimal power distribution allowing best uniformity was determined through simulations. With 400 W/source for the peripherical sources, the four central sources needed 150 W/source at both distances. At first, as described in part 1, as the distance increases the maximum density decreases. It passes from around 12 × 1010 cm−3 at 10 cm to around 8 × 1010 cm−3 at 14 cm. However, due to the increase of the diffusion the diameter of 5% of uniformity is slightly larger at 14 cm. We shall note that at both distances a high uniformity with large diameter is achieved.
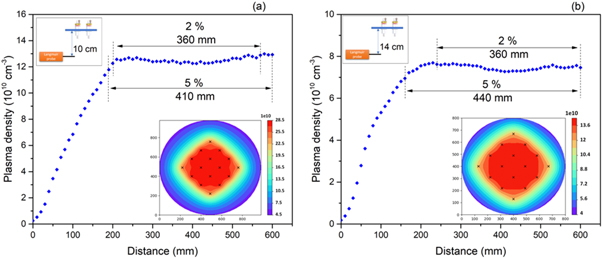
Figure 12. 2D simulation and Langmuir measurements of the plasma density distribution for a matrix configuration of 16 Aura-Wave, a = 110 mm, for nitrogen plasma at 1 Pa, 400 W/peripherical sources, 150 W/central sources (5.4 kW total power) (a) at 10 cm, (b) at 14 cm from the source plane.
Download figure:
Standard image High-resolution imageMatrix dimension: () versus ()


The effect of the matrix dimensions on the density could be clearly seen by comparing figures 11(a) and 12(a). For the same plasma parameters and lattice constant a, as the dimension of the matrix increases, the maximum density remains almost constant (∼13–14 × 1010 cm−3) while the uniformity diameter increases by almost 'a' (from 310 to 410 mm).
Linear configuration
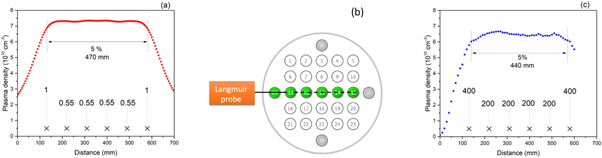
Figure 13(a) shows the plasma density calculated at 14 cm from the source plane for a nitrogen plasma sustained by 6 Aura-Wave at 1 Pa distributed in a linear configuration as shown in figure 13(b). The distance separating two adjacent sources is b = 90 mm. At this fixed position, the density needed by each source was optimized and the corresponding coefficient is presented in figure 13(a). The corresponding power was calculated from the optimized coefficient using the curve of power versus maximum density. As result, the uniform density was achieved when the peripherical sources were powered by 400 W while the in-between sources by 200 W. The experimental curve obtained with the same configuration is presented in figure 13(c). At first, we notice a good correlation between the experiment and the simulation. The maximum density obtained is around 7 × 1010 cm−3 in both curves. A uniformity of 5% is found on 440 mm length. This value is a little smaller than the simulated one (470 mm). This may be due to the wall effect affecting the first source situated at only 100 mm from the reactor wall. In fact, at a close distance from the wall, the electrons will lose their energy by collisions with the wall rather than with gas atoms which reduce the ionization degree. We have proved that if we add an additional source at the distance b, the plasma length with 5% uniformity is extended by 'b'. Thus, the length with 5% uniformity corresponds to the distance separating the extreme sources.
Figure 13. Plasma density of a linear configuration of 6 Aura-Wave with b = 90 mm at 14 cm from the source plane (a) Simulated curve showing the position of the sources and the relative coefficient of optimized density of each source, (b) schematic view of the translation axis for the Langmuir measurements and (c) experimental curve of the plasma density and the corresponding microwave power for each source (1.6 kW total power).
Download figure:
Standard image High-resolution image
Conclusion
The performances of the microwave plasma source, 'Aura-wave', have been investigated in terms of plasma density in the working pressure range between 0.1 and 4 Pa. Langmuir probe measurements have shown the high densities achieved by this source in different plasma conditions. It has been shown that the optimal pressure, at which the highest density is obtained, depends on the distance from the plasma source, due to the balance between ionization/losses close to the plasma source and diffusion phenomenon. A complete database of the variation of the plasma density as function of plasma parameters has been created. Thanks to an in-house developed software, using the created database, the plasma density of multi-source configurations has been calculated. Five examples of different configurations have been presented in this paper. Comparison between simulation and experimental results have shown perfect correlation. A linear configuration with 6 sources with inter-sources distance b = 90 mm allows to have a plasma column with 5% uniformity at a length of 440 mm. Every additional source added with the optimized power will increase the plasma column length by b.
Multi sources configurations, especially matrix configurations, have shown a great malleability in terms of plasma density and plasma uniformity over large surfaces able to be extended without scale limitation. To know:
- Adding more sources while conserving the compactness will increase the uniformity surface while keeping the density constant.
- Increasing the compactness (i.e., decreasing the lattice constant), with keeping the same number of sources, will increase the density and reduce the uniformity surface.
- Decreasing the compactness (i.e., increasing the lattice constant), while keeping the same number of sources, will decrease the density and increase the uniformity area.
- Increasing the compactness and the sources number will increase both the density and the uniformity surface.
The uniformity over large surfaces more than 400 mm achieved with 16 sources is very promising for semi-conductor industry for 400 mm wafers treatment. The high-density reaching values up to 50 × 1010 cm−3 makes of this source very suitable for plasma assisted processes such as PECVD, PEALD, Deep etching, RIE...
To prevent the pollution of the source and to increase its life time, an anti-pollution treatment is being under investigation. It consists on a sapphire window to protect the ceramic part and an alumina thin film deposited on the metallic parts exposed to the plasma.
Thanks to these results, the integration of the Aura-Wave sources in the cited processes, will allow an advanced optimization of the process with increasing its efficiency over large treatment surfaces.
Acknowledgments
This work has been funded in the framework of the EUROSTARS project Plasma S3tream E!12507.
Data availability statement
The data generated and/or analysed during the current study are not publicly available for legal/ethical reasons but are available from the corresponding author on reasonable request.