
Abstract
Results of a direct observation of the charging of spherical bodies in plasmas by means of a numerical experiment are presented. The prime objective of the simulation is to compare quantitative data obtained at different mass ratios of electrons and ions. It is established that the sphere acquires a greater charge at lesser values of the ratio, other things being equal. At high values of the sphere charge, contribution of trapped ions moving in finite orbits near the negatively charged sphere to its shielding by the plasma becomes quite significant. The net charge of the trapped-ion cloud also grows with decrease in the mass ratio as a parameter of the problem in the range of studied plasma parameters.
Export citation and abstract BibTeX RIS
1. Introduction
The process of charging of spherical bodies collecting electrons and ions in ambient plasmas has claimed the attention of many researchers due to numerous physical and technological applications of the phenomenon. It will suffice to mention calculations of a floating potential in electric probe theory [1–4], determination of charges of bodies in space plasmas [5–7] and the charge of an individual grain of dust in dusty plasma physics [8–10]. Recently we presented results of a direct numerical simulation of the kinetics of the charging in a collisionless plasma [11–13]. The collisionless approximation is of frequent use not only as applied to rarefied space plasmas [5] but also to describe kinetics of gas discharge plasma on condition that typical mean free paths of electrons λe and ions λi far exceed the radius of the body R and Debye length of shielding [3, 4, 10, 14]. At given distribution functions of charged particles in an unperturbed plasma, the problem of charging of the absorbing sphere has three dimensionless parameters. As a set of such parameters one can choose, for example, the ratio of the Debye length  , where
  , to the sphere radius D = d/R , the ratio between ion and electron temperatures in the unperturbed plasma Θ = Ti/Te and the electron to ion mass ratio μ = me/mi . Previously [12, 13], we observed the process of charging by means of a numerical experiment and found asymptotic value of the sphere charge at long times as a function of D and Θ. However, the third parameter corresponding to a hydrogen plasma had been fixed μ = μH = 1/1836 . At the same time, bearing in mind possible applications of the simulation to gas discharge plasmas, it is also of interest to determine the charge of the sphere for different μ. Below, we willdiscuss the results of the direct numerical experiments on charging of the spherical body at μH, μHe = 0.25μH and μNe = 0.05μH under the conditions for applicability of the collisionless approximation,
  . The chosen values correspond to the ion compositions in hydrogen, helium and neon plasmas. The principal purpose of our study is to compare the results of the simulation at different mass ratios.
2. Formulation of problem for the numerical simulation
Theoretical principles for the numerical experiment have already been discussed in detail in the previous papers [11–13]. Because of this, here we are concerned briefly only with the general formulation of the problem of the charging of the sphere collecting electrons and ions of an initially unperturbed uniform and isotropic plasma. It is assumed that the absorbing sphere has arisen in the plasma at the instant of time t = 0. As the electron flux onto the surface of the sphere usually exceeds the flux of ions, the sphere acquires a negative charge. The purpose of the numerical experiment is to trace plasma dynamics up to transition to a steady state and to determine asymptotic value of the sphere charge at long times far exceeding ion plasma period. Plasma kinetics is described by the following Vlasov equations for electrons and ions

where vr is radial velocity,

are the electron and ion effective potential energies, and  are absolute values of the angular momentum of the charged particles. The angular momentum of a particle is conserved in a central field and plays the role of a constant parameter [3, 5, 11–13]. The dynamics of charged particles in a central electrostatic field is well studied [3–5]. In the field independent of time, ∂ ϕ/∂ t = 0, the energy of a particle is a constant of the motion,
  , in addition to the angular momentum. In the general case,
  , the particles traverse very intricate trajectories [11–13], so that an analytical description of the motion is practically impossible, especially in the case of a self-consistent field. One can perform only a rough comparative analysis of the effect of the centrifugal
  and electric
  forces corresponding to the first and second terms in the equation (2). The motion of particles with high angular momenta M (i.e. with large impact parameters) is almost unperturbed by the electric field. In the limit
  , the particle trajectories, corresponding to free motion, degenerate into straight lines in the Cartesian coordinates. Particles moving towards the sphere with very small M travel in the close vicinity of the sphere. Reaching the sphere surface, they are absorbed. Particles with larger M do not reach the sphere surface, reflecting from the effective potential wall. At moderate values of the angular momenta, ion trapping is also possible. A qualitative analysis of the initial stage of charging of the sphere at
  gives the typical value of the angular momentum for the ion trapping
  , where the ion thermal velocity is
  [11]. However, this value was found as a result of a rough scaling, while the comprehensive pattern of the trapping process can be given only by the numerical simulation.
Self-consistent electric field E and electrostatic potential ϕ are determined by the Poisson equation

Initial (at t = 0) and boundary (at  ) conditions for the kinetic equations (1) have been taken in the form of the Maxwellian distributions

The corresponding initial condition for the electric field is  . The equations (1) and (3) are solved numerically with the help of 'particle-in-cell' method [15–17] modified appropriately in application to three-dimensional problems of plasma kinetics under condition of spherical symmetry of the problem [11–13]. Apart from solving the equations of motion of PIC macroparticles in the canonical form
  ,
,  with the Hamiltonian
  , see (1) and (2), the cells of the modified PIC method represent spherical layers [11–13] in contrast to the case of planar geometry [15]. The charge of the absorbing sphere Q0(t) is found by a direct summation of charges of PIC electrons and ions reaching the sphere surface, r = R, in the course of their motion. In its turn, the value of the sphere charge Q0(t) determines the electric field on the surface
  as a boundary condition for the equation (3). Hereafter, we will use the absolute values of the sphere charge Q and the electric field E.
Typically, the choice of parameters characterizing the algorithm of the simulation depend on the physical parameters. The difference in the typical electron and ion time scales inevitably leads to a noticeable increase in the required computing time, especially in the case of neon (μ = μNe) plasma. Here, as an example, we present the values of the parameters of the helium plasma simulation. The step in the time is about Δt/Tpe ≃ 0.015. The grid spacing along the radial coordinate is Δr/R ≃ 0.063. The PIC-discretization over M contains 1125 points. The discretization of the Vlasov fluid along the unperturbed particle trajectory for M = 0 contains about 60 points. These points represent the discrete spatial distribution of PIC-particles along the trajectory corresponding to a straight line in the Cartesian space. The number of PIC-particles in the computation region  is about 3 × 10⁶. The simulation code requires 200–400 MB of RAM. Each run usually takes about 4 hours.
3. Space-time dependences
The numerical experiment allows us to observe behavior of macroscopic physical quantities as well as evolution of electron and ion distributions in phase space [11–13]. Figure 1 shows growth of the sphere charge and electric field on the sphere surface at different mass ratios μ = me/mi for two sets of the parameters D = d/R and Θ = Ti/Te , namely, D = 0.56, Θ = 0.008 9 and D = 1.11, Θ = 0.035 5. Since the typical time scales of electron and ion dynamics differ significantly at small μ, the fast charging of the sphere at short times of the order of the electron plasma period  (
( ,
,  ) is shown separately in figure 2.

Figure 1. The temporal dependence of the sphere charge at different parameters μ = me/mi = μH, μHe, μNe, D = d/R and Θ = Ti/Te. The dimensionless electric field on the surface of the sphere  coincides with the dimensionless charge plotted on the graphs.
Download figure:
Standard image High-resolution image
Figure 2. The initial stage of charging at different μ = μH, μHe, μNe.
Download figure:
Standard image High-resolution imageIn the non-isothermal plasmas, Θ ≪ 1 , the heavy ions almost do not affect the shielding of the charged sphere at the initial stage due to their large inertia. As a consequence, at the times  , the sphere is shielded mainly by electrons. A rough qualitative estimate of the effective shielding length may be given by the expression
  . However, as time goes on, the shielding by ions becomes more important at
  , so that the effective length of shielding by passing (free) ions may be evaluated as
  at t ≫ Tpi. Noticeable contribution to the shielding may also be given by trapped ions moving on finite orbits near the charged sphere [12]. It is important that the formation of the trapped-ion cloud cannot be described within the framework of a linear plasma theory. In this sense, the typical scale of the linear approximation di does not reflect in full measure the physics of shielding at high values of the sphere charge Q0 and values of the trapped-ion cloud charge QT commensurable with Q0.
Figure 3 shows radial dependence of the self-consistent electric field in the steady state established at long times  . Similar spatial profiles E(r) were also observed earlier [11–13]. However, the plots allow one to see the distinctions caused by different values of the parameter μ = me/mi, all other parameters (D and Θ) being equal. The spatial dependence of the electric field in the steady state is used for calculation of the effective potential energies (2) as discussed in the next section.
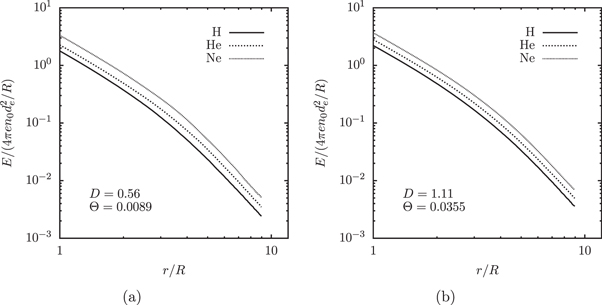
Figure 3. The spatial dependence of the electric field at long times ( ).
).
Download figure:
Standard image High-resolution imageRadial profiles of the electron, passing ion and net ion densities are shown in figure 4. The difference between the net ion density and the density of passing ions is caused by the presence of trapped ions. As follows from the figure, the trapped ion contribution to screening of the charged sphere is quite noticeable in close vicinity of the sphere, while at long distances, the trapped particle effect is small, in agreement with [18].

Figure 4. Spatial dependences of normalized number densities of electrons, ions and passing ions at D = 0.56, Θ = 0.008 9, μ = μHe = 1/7344 and t = 10 Tpi. The graph has been constructed by averaging of the PIC-particle distribution over spatial interval Δr = 0.3.
Download figure:
Standard image High-resolution image4. Relative charge of trapped-ion population
As noted above, the trapped-ion cloud may contribute considerably to the shielding of the negatively charged sphere at a large sphere charge Q0. Account of the trapped ions is especially important in a non-isothermal plasma [18],  . Computation of the self-consistent electric field in the process of the simulation allows us to determine spatial dependence of electrostatic potential and thereby to calculate the ion effective potential energy
  (2) in the steady state for any value of the ion orbital momentum Mi. Knowing the spatial dependence Ui (r) , one can select the trapped and passing (free) ions [3, 5, 19]. Such procedure permits also direct calculation of the net trapped-ion charge QT (D, Θ, μ) in the plasma steady state reached at long times in each computational experiment. It is convenient to evaluate the contribution of the trapped ions to the shielding of the sphere with the help of relative charge of the trapped-ion cloud qT = QT/Q0 . Figure 5 shows the values of qT in combination with the values of Q0 for the chosen two sets of the parameters D = d/R and Θ = Ti/Te at different mass ratios μ = μH , μHe , μNe . As follows from the plots, the growth of qT is observed with the reduction of μ as of a parameter of the problem. The most perceptible trapped-ion contribution to the shielding of the sphere is observed in the case of strongly non-isothermal plasma, Θ ≪ 1. The increase of qT with decreasing μ is explained by the large inertia of heavy ions. At the fast initial stage of the charging, the heavy ions are trapped in the rapidly increasing effective potential wells, almost without motion and perceptible displacement, due to the very fast growth of the electric field near the sphere. In other words, the effective potential wells change almost step-like on the typical time scale of the ion motion, Tpi ≫ Tpe . In the close vicinity of the sphere, the electric field is almost Coulomb, since the electron Debye radius exceeds the ion scale of shielding at
  . Under these conditions, a significant population of the trapped ions arises. However, at a later time, a portion of the trapped ions escapes from the effective potential wells with the decrease in the Debye length from
  to
to  . Lighter ions (at larger
  ) are more subject to the escape from the potential wells as a result of transient phenomena. They leave the vicinity of the sphere and go to infinity. As a consequence, part of the initially 'trapped' ions are lost in the course of the transients. According to the performed simulation, the smaller μ is, the smaller these losses are.
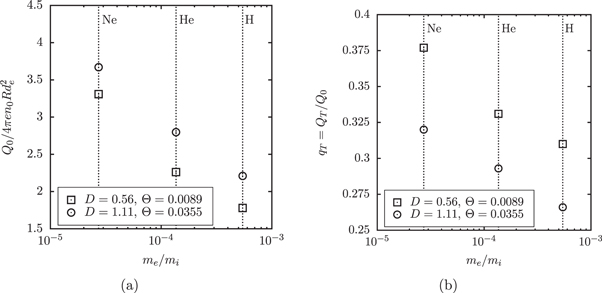
Figure 5. The asymptotic values of the sphere charge Q0 and the relative charge of the trapped-ion cloud qT = QT/Q0 at t = 10 Tpi for the chosen sets of the parameters D and Θ and different mass ratios me/mi.
Download figure:
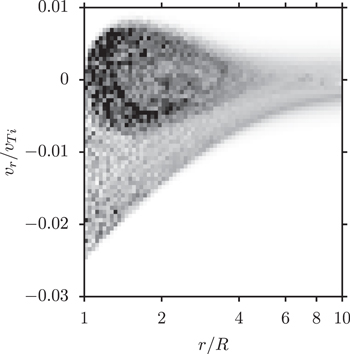
Standard image High-resolution imageThe ion distribution at long times (T = 10 Tpi) is shown in figure 6 in the projection on the plane (r, vr), where the radial distance r is normalized to sphere radius R and the radial velocity is normalized to the ion thermal velocity  . The brightness corresponds to averaged number density. The trapped-ion cloud near the charged sphere looks like a bright bunch. The bunch is very stable at long times far exceeding the ion plasma period.
Figure 6. Phase-space density distribution of ions in the steady state. Parameters of the simulation correspond to the values indicated in figure 4.
Download figure:
Standard image High-resolution image
5. Summary
In spite of a relatively simple physics of the charging of absorbing bodies in plasmas, the acquisition of reliable quantitative data is rather impeded by the strong non-linearity of the process. In particular, a serious obstacle on the way to a theoretical analysis of possible steady states of the strongly disturbed plasma is an uncertainty of the distribution function of trapped particles and their contribution to shielding of the charged body. This difficulty, noted many years ago [3, 5], can be eliminated by solving an initial-value problem. However, solving such a non-steady three-dimensional problem of plasma kinetics analytically is practically impossible. The difficulties of the theoretical studies generate the need for a numerical simulation.
Above, the results of direct numerical experiments on the charging of an absorbing spherical body in gas discharge plasmas with different ion compositions have been described. The simulation allowed us to clarify the main physical regularities of the charging process and to analyze the quantitative data depending on mass ratio of electrons and ions. According to the observations carried out, the charge acquired by the spherical body has been found to be greater in plasmas with more massive ions. The electrodynamics of charging exhibits a clearly defined nonlinear character. The non-linearity manifests itself, in particular, in the greater role of the trapped-ion cloud which shields the charged sphere. The phenomenon of trapping is especially important and should be taken into account for strongly non-isothermal plasmas.
Acknowledgments
This work was supported within the framework of the program OFN III-2 of Russian Academy of Sciences.