

Abstract
Research on methane (CH4) emissions from the oil and gas (O&G) industry informs policies, regulations, and international initiatives that target reductions. However, there has been little integration and synthesis of the literature to document the state of knowledge, identify gaps, and determine key insights that can guide research priorities and mitigation. To address this, we performed a scoping review of 237 English-language peer-reviewed articles on CH4 emissions from onshore O&G sources, charting data on five research themes: publication trends, geography, measurement levels and methods, emissions sources, and emissions rates. Almost all articles (98%) were published between 2012 and 2022 with an increasing publication rate, indicating a nascent and evolving understanding of the science. Most articles (72%) focused on CH4 emissions from the U.S. O&G industry and were written by U.S.-based authors (69%), while other major O&G-producing countries like Saudi Arabia, Russia, and China were under-represented. Upstream was the most frequently studied supply chain segment, where U.S.-focused articles accounted for 75% of the research. Nearly half the articles (43%) included in the review reported site-level measurements, limiting the identification of equipment- and component-level emissions sources and root cause. Articles that measured or identified equipment-level sources (18%) noted high emissions from tanks, unlit flares, and compressors. The most common stand-off measurement platforms were vehicles and aircraft, while the use of satellites increased in articles published since 2019. Reported emissions profiles were consistently heavy-tailed and indicate method-based and geographic differences in magnitude and skew. All articles (n = 26) that compared inventory- to measurement-based estimates of emissions found large discrepancies in that inventories under-estimated the latter by a factor of 1.2–10 times. We recommend future research focus on: (i) field-based emissions studies for under-represented regions and source categories, (ii) identifying root causes and linking measurements to mitigation, and (iii) multi-level measurement integration.
Export citation and abstract BibTeX RIS

Original content from this work may be used under the terms of the Creative Commons Attribution 4.0 licence. Any further distribution of this work must maintain attribution to the author(s) and the title of the work, journal citation and DOI.
1. Introduction
In the 6th assessment report, the Intergovernmental Panel on Climate Change (IPCC) declared that limiting global temperature rise to 1.5 °C—the target of the 2015 Paris Agreement—is nearly out of reach (IPCC 2022). One of the key actions to limit warming in the near-term is to reduce anthropogenic emissions of methane (CH4)—a highly potent short-lived climate pollutant (SLCP)—from the agriculture, waste, and fossil fuel sectors. To accelerate these reductions, international initiatives like the Global Methane Pledge—a voluntary initiative to reduce CH4 emissions 30% across all economic sectors of participating countries by 2030 relative to 2020 levels—have emerged. To support implementation of the Pledge, the United Nations Environment Program (UNEP) has funded and launched the International Methane Emissions Observatory (IMEO). The objective of the IMEO is to integrate different types of CH4 emissions measurement data to identify priority mitigation targets (UNEP 2022). The IMEO has since initiated the Methane Alert and Response System (MARS)—a multi-stakeholder strategy that uses satellites to detect and quantify large CH4 emissions and notifies the company or government responsible so they can abate the emissions.
While momentum is building on reducing CH4 emissions from agriculture and waste through measures such as improved manure management and landfill gas capture, most of the near-term reductions in CH4 are expected to come from oil and gas (O&G) within the fossil fuel sector (UNEP and CCAC—Climate and Clear Air Coalition 2021). O&G is one of the largest emitters globally and is notably important as many abatement opportunities are both technically and economically feasible (Ocko et al 2021). This has prompted governments globally to directly target CH4 emissions from the O&G industry with country-level policies and regulations (e.g., CCAC 2022, European Commission 2023, Government of Canada 2023, U.S. EPA 2023a), which have either been finalized, implemented, or are in the process of being strengthened.
Government pledges to reduce CH4 emissions from the O&G industry are a positive step to limit global warming, but understanding of CH4 emissions is evolving, which increases uncertainty in the outcomes of these policies, regulations, and initiatives. For example, there is a growing number of reports indicating that the CH4 emissions inventories used by governments to report emissions and develop regulations are flawed. Many studies indicate CH4 emissions from the O&G industry are much greater than inventory estimates (Alvarez et al 2018, Chan et al 2020, , Robertson et al 2020, Zhang et al 2020, Mackay et al 2021, Shen et al 2021, 2022, Tyner and Johnson 2021, Zavala-Araiza et al 2021). Planning abatement actions and investment based on under-estimated emissions is unlikely to yield the desired impact. Another emerging characteristic are new observations of the global prevalence of extreme emissions events, referred to as 'ultra-' or 'super-' emitters (Duren et al 2019, Varon et al 2019, 2022, Cusworth et al 2021, Irakulis-Loitxate et al 2021, 2022, Lauvaux et al 2022, Wang et al 2022). Most of these events are missing in national inventories. These and many other examples underscore the importance of documenting, evaluating, and synthesizing the research literature to identify major themes, knowledge gaps, and priorities that can inform government actions, investment, and research priorities.
Here, we document, evaluate, and synthesize 237 peer-reviewed journal articles on CH4 emissions measurements from onshore O&G sources using a standard scoping review methodology. The objective is to characterize the current state of research regarding the detection and quantification of CH4 emissions from the O&G industry. We extract data from the articles based on five major research themes: publication trends, geography, measurement levels and methods, emissions sources, and emissions rates. We summarize and interpret the data and provide recommendations on research priorities to address knowledge gaps, improve understanding and management of CH4 emissions, and inform mitigation and abatement efforts.
2. Methodology
2.1. Overview
To ensure effective review of the literature, we use a standard and well-vetted scheme for literature reviews: the Preferred Reporting Items for Systematic Reviews and Meta-Analyses extension for Scoping Reviews (PRISMA-ScR, Tricco et al 2018). The main steps in the PRISMA-ScR framework are: (1) literature search, (2) literature selection with pre-defined inclusion and exclusion criteria, (3) data extraction, and (4) synthesis of results. A checklist reporting the location of all required elements of the PRISMA-ScR framework in this work is available in the Supplementary Information (SI).
2.2. Literature search
Search term sets were developed using the study population, concept, and context (PCC) approach (Tricco et al 2018, Peters et al 2020a). In this study, the population is the O&G industry, the concept is CH4emissions, and the context is the detection and quantification of CH4 emissions. Each search term set was used to individually query the titles, abstracts, and keyword sections of articles in three databases: Environment Complete, Scopus, and Web of Science. Results from each search term set were combined and refined to include only peer-reviewed literature published in English from 01 January 2002 to 31 December 2022. Review papers and gray literature were not included. The same search term sets were used in each database search, but functional differences between databases required adjusting some elements of the search strategy (see SI for search term sets and database-specific search strategies).
It is important to acknowledge the bias in our literature search strategy. Searching for articles published in English excluded potentially relevant articles published in other languages from the review. Furthermore, we tuned the search strategy to identify peer-reviewed articles published in academic journals. We elected not to search for sources of gray literature such as industry or technical reports, guidance documents, or other non-peer-reviewed manuscripts. Given the biases these decisions introduced, the results presented in this scoping review are only based on a partially complete scan of the literature on measurements of CH4 emissions from the global onshore O&G industry.
2.3. Selecting literature
Results from the three database searches were combined, and duplicates were removed in Covidence literature management software (Covidence 2022). Eligibility screenings of articles were completed in Covidence in two parts. First, titles and abstracts of articles were screened using the inclusion criteria. If the articles did not meet the inclusion criteria, they were ineligible for the next step. Second, articles that conformed to the inclusion rule were subjected to full-text screenings with the exclusion criteria. Articles excluded based on any rule were assigned a reason for exclusion. Figure 1 steps through the literature selection process with the inclusion and exclusion criteria, reasons for exclusion, and the number of articles remaining in each step. All screenings were done by a single author. Definitions of each criterion can be found in the SI. A total of 237 articles passed the inclusion and exclusion criteria and were reviewed in this work. This includes four known articles that were added because they were not returned during the database searches (Kohler et al 2022, Stokes et al 2022, Johnson et al 2023, Pandey et al 2023). Four of the articles were in the pre-print stage at the time of review (Varon et al 2022, Johnson et al 2023, Pandey et al 2023, Wang et al 2023). See SI for a list of all 237 articles.

Figure 1. PRISMA-ScR flow diagram and reasons for exclusion.
Download figure:
Standard image High-resolution image2.4. Data extraction
A data extraction template was developed a priori. We define the O&G industry as onshore infrastructure in the upstream, midstream, and downstream segments of the supply chain, and abandoned wells. Here, the upstream segment includes oil and natural gas production, gathering, and processing, while the midstream segment encompasses transmission and storage. The downstream segment includes facilities and pipelines associated with natural gas metering, regulating, and distribution, as well as customer meters. We added a supply chain segment for abandoned wells to categorize articles that measured CH4 emissions from decommissioned oil and natural gas wells (plugged or unplugged), and old legacy wells. This was necessary given the differences in the methods used to measure CH4 from abandoned and producing infrastructure and the emissions rates.
We did not include offshore O&G in the review because there is a comparatively smaller number of articles published in the literature compared to those that measure CH4 emissions from onshore O&G. Furthermore, there are noteworthy differences between the infrastructure and potential sources of emissions in onshore and offshore O&G. In offshore O&G, infrastructure consists of platforms located in shallow- and deep-water, floating production storage and offloading vessels (FPSOs), and under-water pipelines (Yacovitch et al 2020, Ayasse et al 2022). Offshore platforms and other facilities are also large, fewer in count, and well-constrained to specific geographic regions such as the Gulf of Mexico, Canada's east coast, the North Sea in Europe, and China's south and east coasts. In contrast, there are hundreds of thousands of small onshore sites—often consisting of only a wellhead, storage tank, and separator—that are widely distributed geographically. As such, there are many more potential emissions sources onshore compared to offshore. Additionally, it is important to note that offshore facilities can be difficult to access, either due to their remote locations, or legitimate security concerns, whereas plumes from onshore infrastructure can be detected by driving on public roads or in walking surveys (e.g., Hugenholtz et al 2021). The differences in infrastructure, geographic distribution, and accessibility between onshore and offshore O&G create different challenges for characterizing emissions. This has influenced the measurement methods that have been used and the types of research that have been performed onshore and offshore. Considering these reasons and the smaller number of offshore publications, we focus the review on onshore O&G to improve the synthesis of research findings across the articles reviewed.
Data extracted included: publication year, journal name, geographic focus of study, author country, O&G supply chain segment, methodology (detection/measurement platform, quantification method), spatial and temporal levels of measurement, and measurement findings (including identified sources of emissions). Articles often made > 1 unique report in the data extraction categories (e.g., multiple measurement methods or locations studied), resulting in counts of articles within some categories exceeding the total number of articles included in the review. Here, we consider 'detection' and 'quantification' both as forms of CH4 measurement. Full-text review was performed on all 237 eligible articles, and data were charted in NVivo qualitative analysis software (Lumivero 2017). A single author completed all data charting. Information on accessing the data can be found under the Data Availability Statement in this article.
2.5. Result synthesis
Data extracted from eligible articles were organized into five themes for synthesis based on fit: publication trends, geography, measurement levels and methods, emissions sources, and emissions rates. Article counts, number of reports, and supporting evidence were analyzed following a descriptive-analytical approach (Arksey and O'Malley 2005, Levac et al 2010, Peters et al 2015, 2020a, 2020b, Khalil et al 2021). Results from data charting deemed to be most important to inform the knowledge foundation, mitigation, regulations, and future research directions were prioritized for analysis.
3. Results
3.1. Publication trends
The majority (98.3%) of the 237 peer-reviewed journal articles included in the scoping review were published between 2012 and 2022 (figure 2(a)). The relative recentness of the peer-reviewed literature and timing of the 2012 uptick in publication frequency may be related to the U.S. shale gas boom between 2005 and 2010 (Wang and Krupnick 2013) and subsequent interest in the atmospheric impacts associated with hydraulic fracturing. In 2011, Howarth et al published a seminal article estimating that 3.6% to 7.9% of produced shale gas is vented or leaked into the atmosphere. These estimates were nearly 2 times greater than estimates of CH4 losses from conventional gas. Howarth et al (2011) called for more scientific studies measuring CH4 emissions from the U.S. O&G industry to reduce uncertainties in future loss estimates, as these have been used to evaluate the potential climate benefit of natural gas use over coal and oil. The publication of Howarth et al (2011) may have led U.S-based researchers, institutions, and organizations to mobilize on CH4 emissions from the O&G industry in the years following publication. For example, the inter-annual variation shown in figure 2(a) is likely related to pulses of articles in the years following coordinated measurement campaigns in U.S. O&G production regions such as the 2013 Barnett Coordinated Campaign (Harriss et al 2015), the 2013 Southeast Nexus measurement campaign (Peischl et al 2015, Yuan et al 2015, Cui et al 2019), and the Twin Otter Projects Defining Oil-Gas Well Emissions (TOPDOWN) campaigns in 2014 (Peischl et al 2016, Gvakharia et al 2017) and 2015 (Frankenberg et al 2016, Smith et al 2017). More broadly, many other international milestones and initiatives related to CH4 were achieved, implemented, or in development over the same period and may have contributed to the increase in research on CH4 emissions from the O&G industry since 2012. This includes: the IPCC's 2013 scientific assessment (IPCC 2013), the 2015 Paris Agreement; regulatory actions in Canada, the U.S., and Europe (Government of Canada 2022, European Commission 2023, U.S. EPA 2023a); and various commitments and initiatives such as the Oil and Gas Climate Initiative (OGCI), Global Methane Pledge, IMEO, MARS, and efforts to establish responsibly sourced natural gas certification schemes.

Figure 2. (a) Annual publication frequency of articles included in the review. Counts exclude four articles that were in the pre-print stage at the time of review (Varon et al 2022, Johnson et al 2023, Pandey et al 2023, Wang et al 2023). (b) Counts of first author country based on affiliations listed in the articles. The 'Other' category aggregates the first author countries of Australia, Brazil, Denmark, Finland, Malaysia, Poland, Saudi Arabia, Switzerland, and Turkey.
Download figure:
Standard image High-resolution imageMost (68.8%) of the 237 articles were written by U.S.-based authors (figure 2(b)). Canadian- and Chinese-based authorship totalled 10.1% and 4.2% of the articles included in the review, respectively. Articles written by authors located in these three countries account for 83.1% of all articles included in the review. Searching for peer-reviewed journal articles published only in English may partially explain the high counts of articles written by U.S.- and Canadian-based authors. After the U.S., Canada, and China, authors based in 17 different countries contributed the remaining 40 (16.9%) articles. Authorship of articles on CH4 emissions detection and quantification identified with the database searches was limited to 20 countries.
Figure 3 shows the top 10 peer-reviewed journals where the 237 articles included in the scoping review were published. Full journal names are listed alongside abbreviations in the figure caption. There were 53 unique journals represented by the 237 articles included in this review. This excludes the names of any pre-print repositories. The 10 journals in figure 3 account for 160 (67.5%) of the 237 articles reviewed. A total of 56 (23.6%) of the 237 articles were published in Environmental Science and Technology (EST), which is between 3.5 times to 4 times the volume of literature compared to the next three journals: Elementa: Science of the Anthropocene (Elementa), Science of the Total Environment (STE), and Atmospheric Chemistry and Physics (ACP). The other journals in figure 3 account for 3.0% to 6.8% of the articles included in the review. The remaining 77 (32.5%) of the 237 articles not included in figure 3 were published across 43 different journals. At the time of writing, only 4 of the journals in figure 3 are fully open access: Elementa, ACP, Geophysical Research Letters (GRL), and Atmospheric Measurement Techniques (AMT). The other journals are not fully open access, which can limit the ability of some researchers to access the articles.

Figure 3. Journals with the 10 highest publication frequencies based on articles included in the review. Journal names are abbreviated for clarity: Environmental Science and Technology (EST), Elementa: Science of the Anthropocene (Elementa), Science of the Total Environment (STE), Atmospheric Chemistry and Physics (ACP), Geophysical Research Letters (GRL), Journal of Geophysical Research Atmospheres (JGRA), Atmospheric Environment (AE), Proceedings of the National Academy of Sciences of the United States of America (PNAS), Atmospheric Measurement Techniques (AMT), and Journal of the Air and Waste Management Association (JAWMA).
Download figure:
Standard image High-resolution image3.2. Geography and supply chain segments
The articles revealed geographic emphasis on U.S. studies, with the majority (n = 169, 71.3%) of the 237 articles focused on this country (figure 4(a)). Canada, Turkmenistan, and the U.K. follow the U.S., with 23 (9.7%), 10 (4.2%), and 10 (4.2%) articles, respectively. Countries with notable O&G production, such as Russia (n = 8), China (n = 7), Saudi Arabia (n = 1), and UAE (n = 1) were comparatively under-represented. Similar to the counts of articles by first author country in figure 2(b), the results in figure 4 are likely modulated to some extent by only searching for and including peer-reviewed journal articles published in English in the scoping review. Articles included in this review from outside the U.S., Canada, and the U.K. relied mostly on satellite measurements. This is noteworthy in the context of the measurement method. Turkmenistan stands out from other countries in the Middle East and Asia because more articles focused on Turkmenistan than its neighboring countries. All the articles in this review that report measurements of CH4 emissions attributable to the O&G industry in Turkmenistan were made exclusively with satellites by researchers at institutions in other countries (Varon et al 2019, Ehret et al 2022, Irakulis-Loitxate et al 2022, Lauvaux et al 2022, Sánchez-García et al 2022). The case is similar in Russia—the second-largest O&G producer in the world—where the only articles included in this review published within the last decade have used satellites (Ialongo et al 2021, Ehret et al 2022, , Lauvaux et al 2022, Pandey et al 2023). Several other countries have been flagged by global-level analyses with satellites for having large ('ultra') emitting sources associated with O&G production and transmission (Ehret et al 2022, Lauvaux et al 2022, Pandey et al 2023), but detailed field-based articles are either lacking or were not identified by the search term sets and databases.
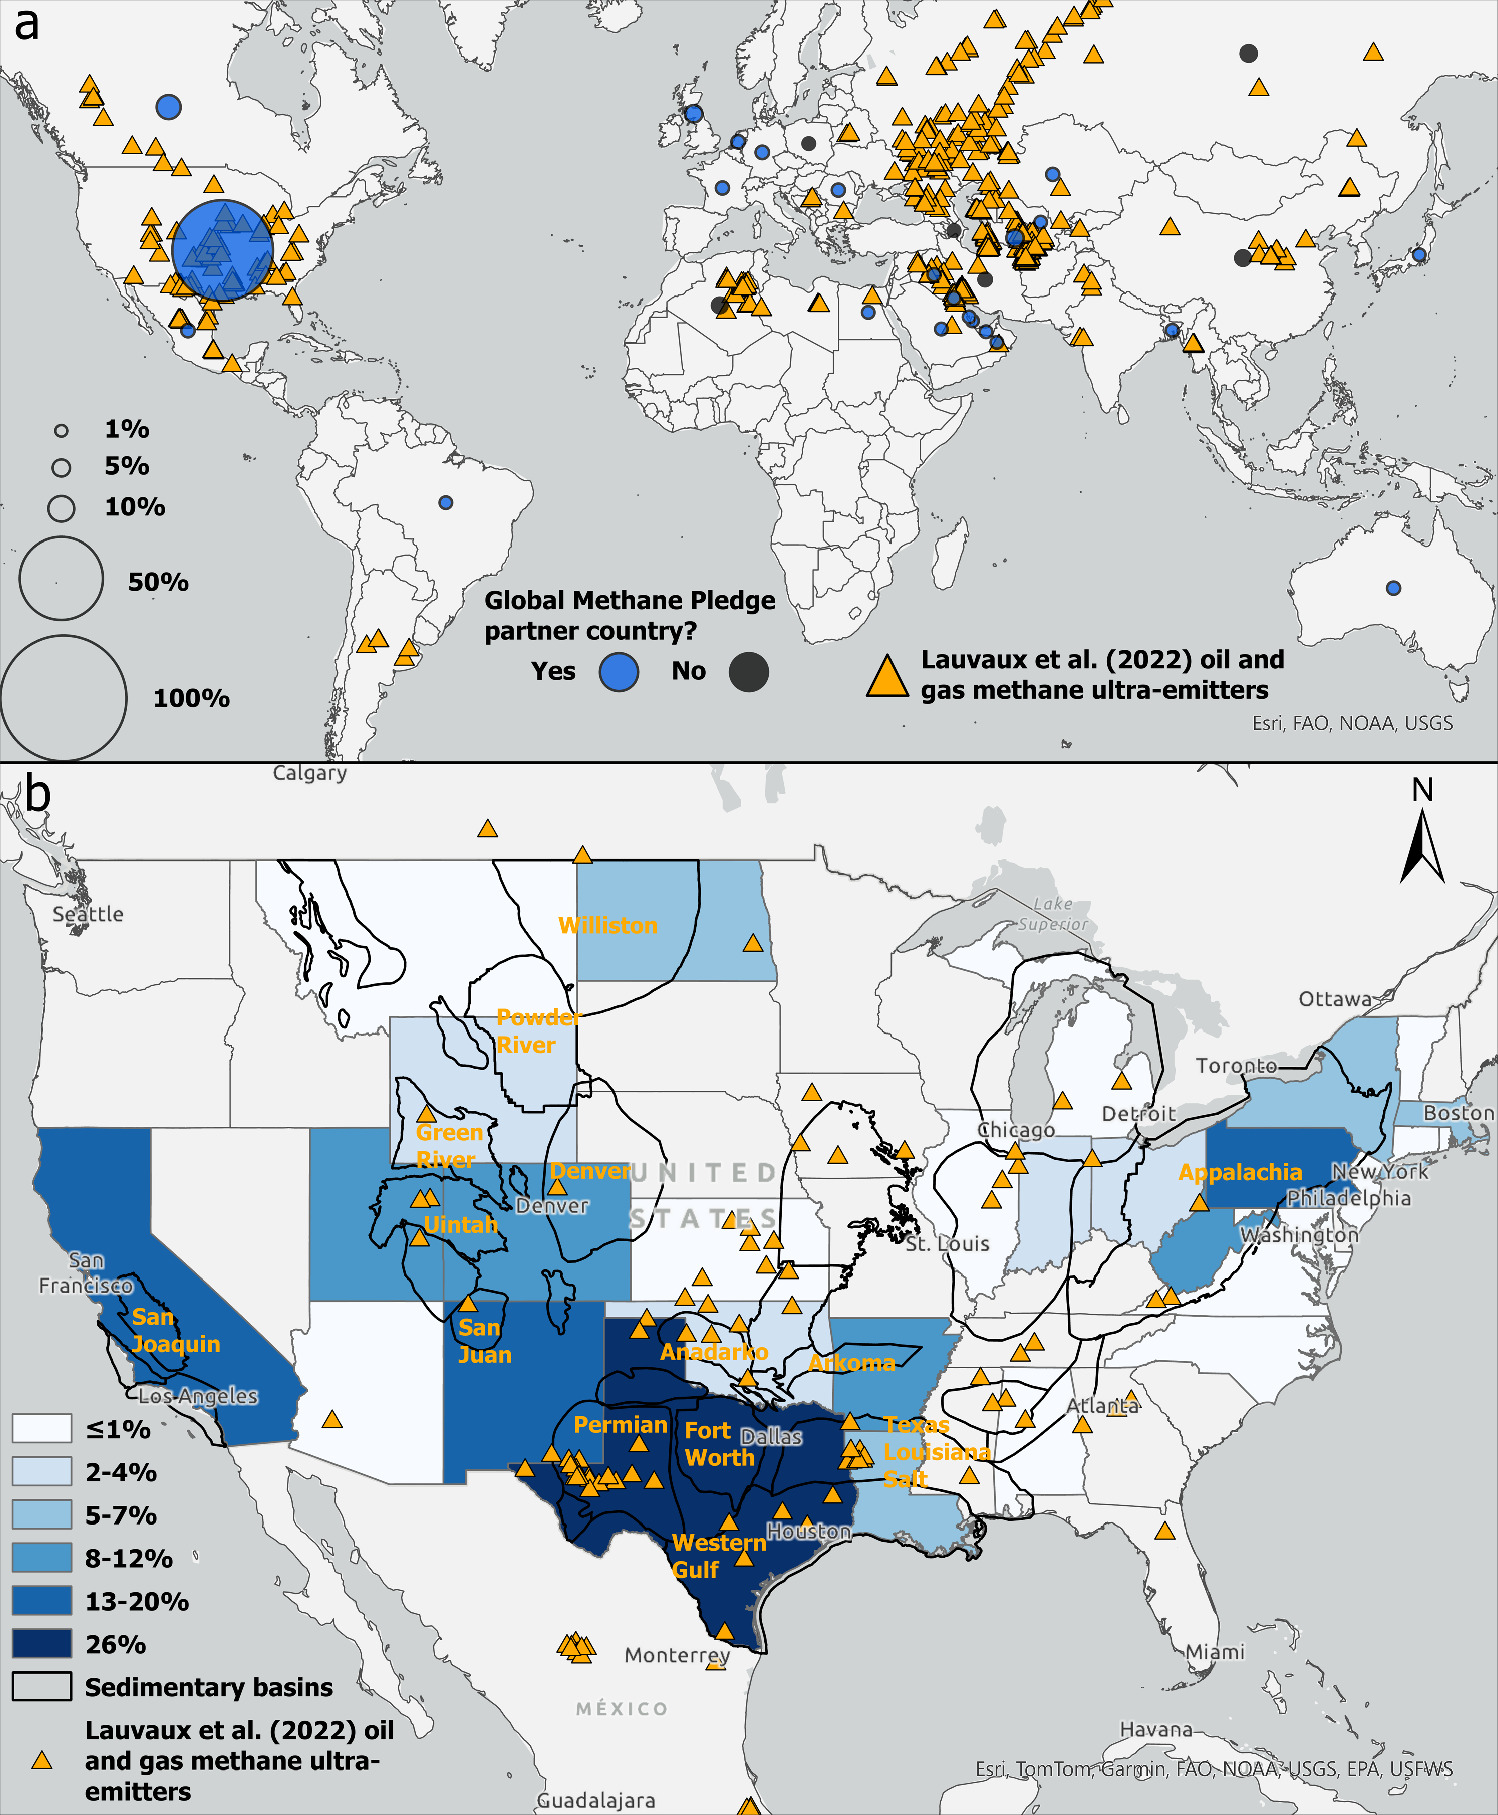
Figure 4. (a) Country-level article counts as a percentage of the total number of articles reviewed. Circle size is proportional and circle colors indicate partnership to the Global Methane Pledge. (b) State-level article counts as a percentage of the total number of U.S.-focused articles (n = 169) and various sedimentary basins. Colors are graduated. Some U.S.-focused articles (n = 18) did not report at a finer level than the national level, mostly due to data anonymization, and were not included in (b). Orange triangles in both figures are O&G ultra-emitters reported by Lauvaux et al (2022). Total country (a) and state-level percentages (b) exceed 100% because individual articles studied O&G CH4 emissions in multiple countries and U.S. states.
Download figure:
Standard image High-resolution imageThe U.S. study emphasis in figure 4(a) warrants further attention given the high number of articles. The geographic distribution of U.S.-focused articles reveals some association between the study locations and major O&G-producing regions or basins (figure 4(b)). For example, Texas—the largest O&G producer in the U.S.—had the highest article count at the state-level (n = 44/169, 26.0%), with the Permian, Fort Worth, and Western Gulf basins accounting for 18 (40.9%), 14 (31.8%), and 11 (25.0%) of the Texas-focused articles, respectively (figure 4(b)). Pennsylvania was second to Texas in terms of article counts—the result of its central location in the gas-producing Appalachian basin (Marcellus Shale)—with 33 (19.5%) of the 169 U.S. articles. Other states with high article counts correlating with O&G-producing basins are New Mexico (n = 28/169, 16.6%), California (n = 25/169, 14.8%), Colorado (n = 20/169, 11.8%), and Utah (n = 16/169, 9.5%). North Dakota (n = 11/169, 6.5%) and Oklahoma (n = 6/169, 3.6%) had low article counts relative to other states despite their ranks as the third- and sixth-largest crude oil producers in the U.S. (EIA 2022a). Oklahoma is also the fifth-largest producer of marketed natural gas (EIA 2022b). Louisiana (n = 8/169, 4.7%) and Ohio (n = 6/169, 3.6%)—which rank third and sixth for natural gas production—were also under-represented in the U.S. articles.
Articles in the review detected and quantified CH4 emissions across different supply chain segments including upstream, midstream, downstream, and abandoned wells. We define these segments in §2.4. Figure 5 shows country-level counts of supply chain segments studied in the articles, which was evident based on the target infrastructure or region and the spatial context of the measurements (e.g., in a production basin or city). It was common for articles that performed region/basin-level measurements or used satellites to screen for large point-sources across multiple geographies to cover more than one supply chain segment because of the co-located nature of infrastructure.

Figure 5. Counts of articles reporting CH4 emissions measurements in different O&G supply chain segments at the country level. The total number of articles in the figure exceeds the total number of articles reviewed because many articles covered > 1 segment and studied > 1 country.
Download figure:
Standard image High-resolution imageResults in figure 5 underscore the geographic trends in the literature. A total of 75.4%, 72.7%, 58.0%, and 75% of the upstream, midstream, downstream, and abandoned well research from articles included in the review is focused on the U.S. Percentages for the upstream, midstream, and abandoned well segments are comparable, but the midstream segment stands out as having received less attention compared to the other segments in the U.S. The distribution of research in Canada is skewed towards the upstream segment (n = 19). Combined, European countries have a higher article count in the midstream segment (n = 15) compared to the upstream segment (n = 10). Article counts in the distribution segment in Europe (n = 10) are high relative to the other segments. Russia's contribution to European transmission segment counts (n = 6) is notable in the context of large plumes from transmission compressor stations and pipelines that have been observed with satellites (Lauvaux et al 2022). Countries in the Middle East and Asia have the highest article counts in the upstream segment compared to other supply chain segments. Single article counts for the upstream and midstream segments in several Middle Eastern countries are the product of one article that used the Tropospheric Monitoring Instrument (TROPOMI) for regional satellite measurements of emissions over oil fields and transmission pipelines (Farahat 2022). There is very little research on the distribution segment outside of North America and Europe and none on abandoned wells.
3.3. Measurement methods
Two main categories of methods used to measure CH4 emissions were identified in the articles: stand-off and close-range. Stand-off methods involve passive or active atmospheric sensing of CH4 from a fixed or mobile platform located some distance away from the source, ranging from several meters to hundreds of kilometers for satellites. Generally, as the distance increases, the ability to pinpoint the source location and emitting component decreases. As such, stand-off measurements are typically referred to as screening measurements because they cannot directly diagnose the specific source and root cause of the emission without close-range inspection. Stand-off methods can be conducted without knowledge of the operator, from off-site. This can limit risk of operator bias or manipulation of emissions. In contrast, close-range methods involve the use of a portable instrument or substance on site to detect or quantify component-level emissions, typically through direct contact with the source or through close-range sensing less than several meters away.
A total of 194 (82.0%) out of the 237 articles reported measurements with stand-off methods, whereas 99 (41.8%) articles reported measurements with close-range methods (figure 6). The sum of these counts is 293, thus 56 articles reported using > 1 close-range or stand-off method, or both methods to measure emissions.

Figure 6. Counts of articles reporting close-range measurement methods (a) and stand-off measurement methods (b) by publication year. Colors and numbers show article counts for each method. The total number of articles in the figure is 293, which exceeds the 237 articles included in the review as 56 articles reported using > 1 close-range or stand-off method, or both methods.
Download figure:
Standard image High-resolution imageWithin the stand-off method category, articles showed preference to individual platforms, which has implications for the measurement lens in which emissions are observed and measured. Figure 6 shows that vehicle systems (n = 84/194, 43.3%) and aircraft (n = 64/194, 33.0%) dominated the measurement reporting of stand-off methods, followed by satellites (n = 35/194, 18.0%), fixed sensors (n = 35/194, 18.0%), and other platforms (n = 10/194, 5.2%). Reports of vehicle systems peaked in 2015, which may be related to their use in the Barnett Coordinated Campaign (Harriss et al 2015). This campaign was performed in 2013, which led to the publication of several articles in 2015. Articles reporting measurements with vehicle systems have remained at consistently elevated levels relative to other platforms since 2015, suggesting they are a mature and established CH4 emission measurement platform (cf Fox et al 2019). The highest count of articles reporting aircraft platforms was in 2017. The use of aircraft platforms to measure CH4 emissions has remained relatively steady since, except for a slight decrease in 2020. Figure 6 also shows that articles reporting satellite measurements increased markedly in the last few years of the review period. The biggest jump occurred in 2022 (n = 13). Article counts involving measurements with fixed sensors were relatively low prior to 2019, but have increased since, similar to satellites. Most fixed sensors reported in articles were of the airshed-type, involving permanent or semi-permanent stations with lab-grade CH4 analyzers and meteorological instrumentation. These stations are typically operated by regulators, government scientists, and academics for regional level monitoring. Conversely, 9/35 (25.7%) articles described measurements with fixed sensors deployed on or around the periphery of O&G sites. Low counts of articles reporting measurements with the remaining platforms (drones and backpacks, n = 10) suggest that these platforms are less widely used.
Compared to stand-off methods, counts of articles reporting close-range methods are less skewed toward individual methods and are more evenly distributed over time. Figure 6 indicates that handheld laser CH4 detectors were the most common close-range method, with 41/99 (41.4%) of close-range articles reporting their use. Hi-flow samplers (or similar) and sampling canisters (or similar) were each used in 37/99 (37.4%) articles reporting close-range methods. These were followed by optical gas imaging (OGI) cameras (n = 35/99, 35.4%), flux chambers (n = 20/99, 20.2%), various gas/flow meters (n = 10, 10.1%), and soap screenings (n = 3/99, 3.0%). Hi-flow samplers (or similar), flux chambers, and gas/flow meters are used to quantify emissions rates, whereas laser CH4 detectors, sampling cannisters (or similar), and OGI cameras are typically used for detection.
3.4. Spatial and temporal measurement characteristics
The spatial and temporal characteristics of CH4 measurements were charted from the articles to examine how the methods or research objectives influenced how emissions were described. Four spatial levels of measurement were identified in articles, which was based on interpretation of the measurement methods used and target sources reported. This includes the component-, equipment-, site-, and region-/basin-levels. Some articles reported measurements at more than one spatial level, resulting in a total count of 297.
The temporal characteristics of measurements reported in the articles were identified as either snapshot or multi-temporal. Snapshot measurements were typically performed over a timespan of seconds to hours and were not related to characterizing the temporal variability of emissions using a targeted research approach. In contrast, multi-temporal measurements involved repeat measurements or continuous monitoring of the same sources over days, months, or years to track changes in emissions over time. Total snapshot and multi-temporal counts are equal to the total number of articles reviewed (n = 237) because the temporal characteristics of measurements were determined at the article level.
The most common spatial level of emissions measurements reported in articles was site-level (n = 102/297, 34.3%; figure 7). Site-level measurements were followed by the region/basin (n = 77/297, 25.9%) and component (n = 76/297, 25.6%) levels. Measurements at the equipment-level were reported in 42 (14.1%) articles in the review. These counts indicate that most research has either targeted emissions or used measurement methods with spatial resolutions that are too coarse to identify the specific sources and root causes of emissions.
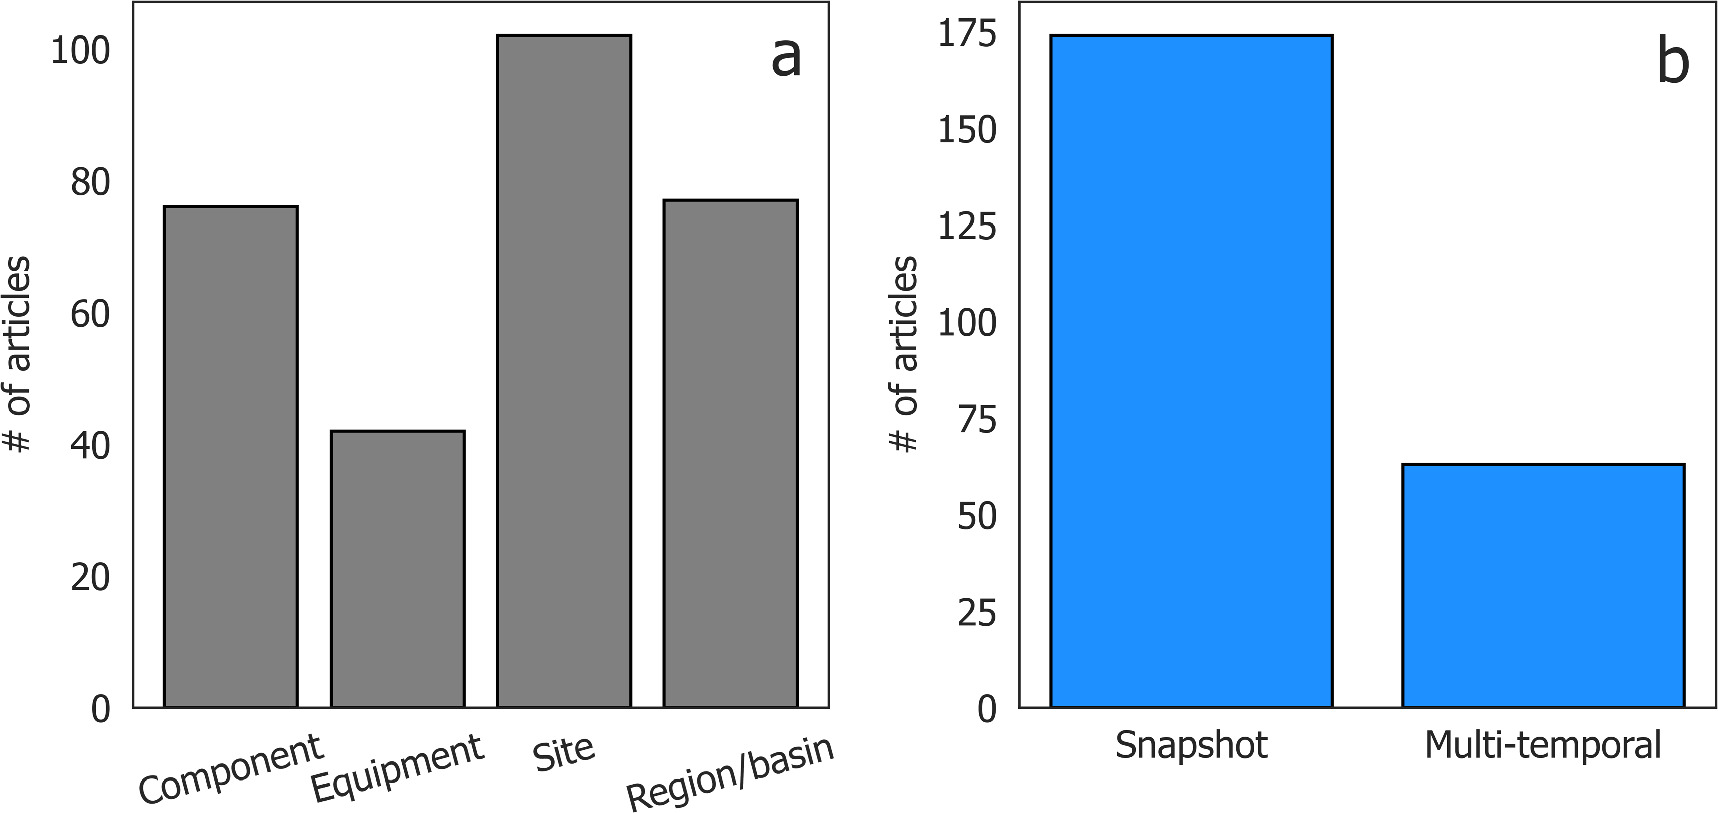
Figure 7. Spatial (a) and temporal (b) levels of CH4 emissions measurements. The total number of articles included in panel (a) is 297, which exceeds the 237 articles included in the review. The reason is that many articles measured emissions at > 1 spatial level. The total number of articles in panel (b) is the same as the total number of articles reviewed because the temporal characteristics of measurements were determined at the article level.
Download figure:
Standard image High-resolution imageFor the temporal characteristics, article counts indicate that the majority focused on snapshot measurements (174/237, 73.4%), whereas 63/237 (26.6%) focused on multi-temporal measurements (figure 7). A total of 17 (27.0%) of the 63 multi-temporal articles performed source revisits with either close-range or stand-off methods, whereas 44/63 (69.8%) articles monitored sources over time with fixed sensors or satellites. Two (3.2%) articles performed both site revisits and continuous monitoring in the same study to track changes in emissions over time and compared snapshot measurements with the continuous time series (Alden et al 2020, Wang et al 2022).
3.5. Emissions sources
The highest resolution emissions source reported in each article was identified during data charting. This includes a mix of source resolutions based on the results in figure 7(a). In some instances, multiple equipment units were aggregated to equipment groups (e.g., tanks) to simplify the process. There is an overlap between source counts depending on how the sources were described in the articles. Counts reflect sources confirmed as emitting from measurements or as highly probable sources based on ancillary evidence.
The five most common sources of O&G CH4 emissions identified from this scoping review are not necessarily the five most important sources of emissions, but those that appeared most frequently across all articles reviewed. Emissions sources reported most frequently in articles were well pads and batteries (n = 66/237, 27.8%), compressors/compressor stations (n = 62, 26.2%), tanks (n = 53, 22.4%), flares (n = 38, 16.0%), and gas processing plants (n = 36, 15.2%). It should be emphasized that these sources are tied to the spatial resolution of the measurement method used in articles. Thus, tanks were charted as a distinct emissions source from well pads and batteries despite the association between the two (e.g., 'tank batteries').
While these five sources are only examples of what industry, scientists, regulators, and governments can target for measurement and mitigation, they are significant in the context that equipment-level sources such as tanks, compressors, and unlit or malfunctioning flares are often some of the largest emitting sources within the O&G industry (Lyon et al 2016, Englander et al 2018, Shaw et al 2020, Cusworth et al 2021, Irakulis-Loitxate et al 2021, 2022, Tyner and Johnson 2021, Varon et al 2021, 2022, Johnson et al 2022, Vogt et al 2022, Johnson et al 2023, Pandey et al 2023).
3.6. Emissions rates
3.6.1. Emissions profiles
The articles in the review that developed emissions profiles from measurements indicate unanimously that they follow heavy-tailed distributions (n = 70), whereby a small proportion of sources contribute to most emissions (Brandt et al 2016). Articles reported finding a heavy-tail CH4 emissions distribution across various infrastructure types in the upstream (Brantley et al 2014, Mitchell et al 2015, Rella et al 2015, Yacovitch et al 2015, 2017, Frankenberg et al 2016, Omara et al 2016, 2018, Zavala-Araiza et al 2017, Caulton et al 2019, Schwietzke et al 2019, Deighton et al 2020, Ravikumar et al 2020, Robertson et al 2020, Tyner and Johnson 2021, Zhou et al 2021, Chen et al 2022, Delre et al 2022, Footer et al 2022, Stokes et al 2022, Vogt et al 2022, Wang et al 2022), midstream (Subramanian et al 2015, Zimmerle et al 2015), downstream (Lamb et al 2015, Hendrick et al 2016, Maazallahi et al 2020, Williams et al 2022), and abandoned well segments (Kang et al 2014, Lebel et al 2020, Riddick et al 2020), including shut-in wells (Townsend-Small and Hoschouer, 2021). The heavy-tail was also pervasive across component-, equipment-, and site-levels of measurement.
While emissions profiles reported in articles were consistently heavy-tailed, there are notable differences between and within studies. Figure 8(a) shows 12 CH4 emissions profiles by measurement method for different locations globally, while figure 8(b) shows the same profiles but as a function of the cumulative proportion of measurements. The data shown in figure 8 were extracted from 14 articles in the review (ERG 2011 from Brandt et al 2016, Brantley et al 2014, Robertson et al 2017, 2020, Clearstone Engineering (2019), Omara et al 2018, Zavala-Araiza et al 2018, Duren et al 2019, Cusworth et al 2021, Irakulis-Loitxate et al 2021, Tyner and Johnson 2021, Ehret et al 2022, Lauvaux et al 2022, Wang et al 2022). Most of the underlying measurements were performed at or downwind of upstream O&G wells and facilities, but measurements of emitting infrastructure in other segments of the supply chain are included in some profiles (e.g., Duren et al 2019). The superscripts associated with each measurement method in the legend in figure 8 correspond with the superscripts listed for the references in the figure caption.

Figure 8. (a) Cumulative CH4 emissions (i.e., emissions profiles) by measurement method, and (b) cumulative CH4 emissions as a function of the cumulative proportion of measurements by measurement method. The data used in both panels were extracted from Brantley et al (2014)1, Omara et al (2018)2, Robertson et al (2017, 2020)3,4, Lauvaux et al (2022)5, Irakulis-Loitxate et al (2021)6, Cusworth et al (2021)7, Clearstone Engineering (2019)8, Duren et al (2019)9, Wang et al (2022)10, ERG (2011) from Brandt et al (2016)11, Ehret et al (2022)12, Zavala-Araiza et al (2018)13, and Tyner and Johnson (2021)14. The legend is shared for both panels (abbreviation in legend B.C.: British Columbia), and superscripts next to each measurement method correspond with the superscripts listed for each reference. The Bridger aircraft platform and OGI/Hi-Flow data from Tyner and Johnson (2021) are measurements at multi-well batteries and were extracted from the main text using WebPlotDigitizer (Rohatgi 2022).
Download figure:
Standard image High-resolution image
Generally, studies that used stand-off methods with high minimum detection limits (MDLs) show larger emissions profiles than studies that used close-range quantification methods like hi-flow samplers (figure 8(a)). This discrepancy reflects differences in study locations, timing, detection limits, emissions sources, capabilities of measurement equipment, the spatial resolution of the methods, and possibly other factors. Only two studies in the review directly compared emissions estimates from close-range and stand-off methods at the same sites (Schwietzke et al 2019, Tyner and Johnson 2021). Data from Schwietzke et al (2019) are not shown in figure 8 because CH4 emissions rate distributions were not reported in the article. In both articles, the stand-off method (aircraft) found fewer but much larger sources and total emissions. These studies show that: (i) many sources detected with OGI and quantified with hi-flow are below the detection limit of aircraft, and (ii) the largest emitting sources at O&G sites such as tanks, compressors, and unlit flares are largely outside the measurement capabilities of common close-range methods.
Several articles in the review highlighted the challenges with close-range methods measuring some (especially larger and taller) sources due to method limitations, safety, or accessibility issues (Kuo et al 2015, Subramanian et al 2015, Zimmerle et al 2015, Bell et al 2017, Vaughn et al 2017, Schwietzke et al 2019, Ravikumar et al 2020, Tyner and Johnson 2021, Lavoie et al 2022, Wang et al 2022). Visual estimation of emissions rates based on OGI observations of plume characteristics and behavior is sometimes used as a substitute for measurement (e.g., Tyner and Johnson 2021). Close-range methods can also miss large, short-duration emissions events resulting from process upsets or operator maintenance. This is related to the time intensiveness and limited spatial coverage of the method relative to the temporal characteristics of these events, in addition to the size and nature of the emissions (Vaughn et al 2018). Therefore, similar to unsafe or inaccessible sources, large, short-duration emissions events are generally not directly measured with close-range methods. These examples suggest that reporting and other emissions estimates informed exclusively by close-range methods such as OGI and hi-flow may be inaccurately estimating emissions, not fully accounting for the largest sources, or some combination of the two.
Figure 8(b) shows noteworthy differences in the skew of CH4 emissions profiles measured with different methods. The OGI/Hi-Flow emissions profiles from Alberta, Canada (Clearstone Engineering 2019) and Texas, U.S. (ERG 2011) are extremely skewed, where 1.4% and 5.2% of the measurements were responsible for ∼50% of the total CH4 emissions, respectively. The emissions profile measured with OGI/Hi-Flow in British Columbia (B.C.), Canada (Tyner and Johnson 2021) is less skewed (10.8% of measurements emitted 50% of emissions). It is important to note that the B.C. OGI/Hi-Flow rates were extracted from a figure in Tyner and Johnson (2021) and may not be exact. For the profile measured with a vehicle system and the U.S. EPA's Other Test Method (OTM) 33 A in different regions in the U.S. (Brantley et al 2014, Omara et al 2018, Robertson et al 2017, 2020), 6.3% of the measurements emitted 50% of emissions. Vehicle tracer flux measurements in Alberta, Canada (Zavala-Araiza et al 2018) show less skew, where 12% of the measurements emitted 50% of the emissions. This difference may be due to the smaller sample size (n = 25) in Zavala-Araiza et al (2018) with this method or other factors. Results are mixed for measurements with different aircraft platforms. The profiles of Bridger Gas Mapping LiDAR (GML) measurements in the U.S. and B.C., Canada show high and similar skew (5.6% and 6.5% of measurements emitted ∼50% of emissions, respectively). In contrast, the profile of NASA Jet Propulsion Laboratory (JPL) aircraft platform measurements in the Permian Basin and California in the U.S. show nearly 3 times less skew (15.7% and 17.5% of measurements were responsible for 50% of the emissions, respectively). It is possible this is due to differences in the MDLs of these aircraft platforms (AVIRIS-NG 5–10 kg/h, Frankenberg et al 2016, Thompson et al 2016, Bridger GML ∼1.5 kg h−1 at low wind speeds, Johnson et al 2021) or the types and magnitudes of sources that exist in the regions surveyed. For satellites, the proportions of measurements responsible for ∼50% of total emissions measured are 14.5% (Ehret et al 2022), 21.6% (Irakulis-Loitxate et al 2021), and 22.4% (Lauvaux et al 2022). Overall, satellite emission profiles show the least skew relative to other methods.
The results in figure 8(b) suggest that as methods with higher MDLs are used to measure CH4 emissions, profiles become less skewed. There are several profiles that follow the '5–50' rule (Brandt et al 2016), where 5% of measurements account for 50% of total CH4 emissions (e.g., OGI/Hi-Flow—ERG 2011, Clearstone Engineering (2019), aircraft platforms—Tyner and Johnson 2021, vehicle-based OTM 33 A—combination of Brantley et al 2014, Omara et al 2018, Robertson et al 2017, 2020). However, conformance with this rule appears to become less likely as the MDL of the method increases. For profiles with less skew, a higher number of measurements must be summed to account for 50% of total CH4 emissions. This could indicate important differences in the emitting sources and processes being measured with different methods, modulated by the MDL. The extreme skew of some emissions profiles—especially component- and equipment-level profiles—may indicate that CH4 emissions from both normal and abnormal processes are being detected and measured, with the abnormal (large) emissions being rare but accounting for the majority of total emissions (Zavala-Araiza et al 2017). On the other hand, the profiles with substantially less skew suggest that certain methods—mainly some aircraft and satellite platforms—could be measuring mostly similar (and larger) emissions associated with malfunctions (unlit flares) or maintenance activities (blowdowns). Due to their higher MDLs, these methods cannot detect the numerous small emitters associated with normal processes (pneumatic venting) or leaks that influence the emissions profiles obtained by other methods with lower MDLs. As such, the CH4 emissions profiles measured with high MDL methods have less skew because the sources and rates being quantified are similar, these may be limited mostly to large emissions events or process malfunctions at site. Root cause analysis of emissions detected with higher MDL methods could corroborate or challenge this hypothesis.
3.6.2. Top-down versus bottom-up
A total of 26 articles that measured CH4 emissions with top-down (TD) methods reported discrepancies between those measurements and bottom-up (BU) inventories of emissions. Another 10 articles reported discrepancies between their TD measurements of CH4 emissions and industry estimates of emissions. The TD approach uses measurements to estimate total CH4 emissions. In contrast, the BU approach estimates total O&G CH4 emissions by multiplying measured or estimated emissions rates per source category by counts of activities or components for each source category. TD > BU emissions estimates in all 26 articles, with TD estimates between ∼1.2 times to 10 times greater than BU estimates (Karion et al 2015, McKain et al 2015, Omara et al 2016, 2018, Peischl et al 2016, Atherton et al 2017, Buchwitz et al 2017, Johnson et al 2017, Leifer et al 2018, Barkley et al 2019, Plant et al 2019, 2022, Ren et al 2019, Riddick et al 2019, Chan et al 2020, Robertson et al 2020, Zhang et al 2020, Cui et al 2021, Liu et al 2021, MacKay et al 2021, Shen et al 2021, Tyner and Johnson 2021, Zavala-Araiza et al 2021, Vogt et al 2022, Yu et al 2022, Johnson et al 2023). This finding is consistent with synthesis articles not included in this review (Brandt et al 2016, Alvarez et al 2018). Similarly, for the 10 articles that compared TD measurements to industry estimates of emissions—which are often determined using engineering calculations and production accounting volumes—TD estimates were between 2 times to ∼300 times higher (Karion et al 2013, Kort et al 2014, Lavoie et al 2015, Peischl et al 2016, Johnson et al 2017, Zavala-Araiza et al 2018, 2021, Floerchinger et al 2019, Thorpe et al 2020, Wang et al 2022). As an extreme example, Zavala-Araiza et al (2021) quantified CH4 emissions from a gas processing facility in Tabasco, Mexico, at a rate of 5700 kg h−1, which was almost 300 times higher than the 20 kg h−1 reported by the operator.
3.6.3. Temporal variability
Temporal variability of CH4 emissions rates was extracted from 12 (19.0%) out of 63 multi-temporal articles. These articles found that emissions rates varied between measurements by 2.6 times to as high as 560 times (Brantley et al 2014, Lavoie et al 2015, 2017, Nathan et al 2015, Mehrotra et al 2017, Johnson et al 2019, Alden et al 2020, Deighton et al 2020, Thorpe et al 2020, Johnson and Heltzel 2021, Varon et al 2021, Wang et al 2022). The largest fluctuation between measurements was reported by Johnson and Heltzel (2021), who performed 17 site revisits to a dry gas well pad in West Virginia, U.S. over 4 years. One of their visits resulted in a site emissions total of 43.4 kg h−1, which was ∼560 times greater than the smallest site emissions rate of 0.08 kg/h. They attributed almost all the emissions to a produced water storage tank venting to atmosphere. Snapshot measurements may not capture this emissions variability (cf Johnson et al 2023).
4. Discussion
This scoping review documented details from the peer-reviewed scientific literature to define the current state of knowledge that policies, actions, and international initiatives are building upon to achieve rapid and substantial reductions of CH4 emissions from the O&G industry. The articles indicate that the scientific foundation for understanding CH4 emissions from the O&G industry is young and nascent but growing rapidly.
We discuss the broad trends and synthesize these results into emerging research needs. However, while publication trends provide a measure of what areas are important, publications can miss important aspects of a topic. In general, for a publication on CH4 emissions measurement to exist, the following ingredients must be present: topical importance, funding, equipment, expertise, and in many cases, access. Lack of one or more of these ingredients—beyond just topical importance—has shaped the publication trends. We highlight areas that have been influenced by this bias to shed more light on the state of the science and to identify barriers that are limiting a more complete understanding of CH4 emissions.
4.1. Geographic bias and trends
The literature shows a strong geographic bias to studies in the U.S. that are developed and reported by U.S. researchers. The U.S. research focus is evident across the upstream, midstream, and abandoned well segments of the onshore O&G industry, but slightly less pronounced in the distribution segment. Studies elsewhere are lagging.
On a fundamental level, geographic bias is expected as onshore O&G infrastructure is geographically biased. Upstream CH4 emissions are concentrated in O&G production basins and are absent where there is no upstream infrastructure (e.g., see figure 4). Downstream and midstream emissions relate to where natural gas is used, primarily concentrated to higher latitude, denser, and wealthier population centers with extensive urban distribution networks. Compared to natural gas, significantly less CH4 is emitted from oil activities in the downstream and midstream segments of the supply chain; most oil-related emissions occur upstream at the wellhead (e.g., U.S. EPA 2023b). The U.S. is the world's largest producer of O&G with > 70% of total production occurring onshore, but there is extensive onshore production and distribution globally. This explains the presence of studies in the U.S., but not the absence elsewhere.
Friction in access can strongly control studies. Some methods (e.g., close-range methods) require direct site access; others require adjacent ground access, or some authorization to operate. It can be difficult for researchers to obtain access to industrial facilities to perform research. The O&G industry may not have incentive to allow research on their sites and not all jurisdictions are easy to operate in, even if no site access is required. Furthermore, the logistics effort to conduct measurements varies considerably around the world. In the situation where many researchers are based in the U.S., mobilizing internationally with expensive measurement equipment (e.g., vehicles, aircraft) is difficult or may be impossible. Additionally, most of the onshore O&G infrastructure in the continental U.S. is easy to access with extensive public road networks and services available. These effects are difficult to quantify, but more measurements can be accomplished with less funding and risk when there are lower mobilization costs and extensive, publicly available support services, as is common throughout the continental U.S.
Funding, execution of larger scale programs, and the characteristics of academic institutions in the U.S. may also exert geographic bias. Many studies in this review were conducted under larger project umbrellas (e.g., Barnett Coordinated Campaign, Harriss et al 2015), which leverage geographic focus and loose coordination to produce a more comprehensive understanding of CH4 emissions in one region. Extensive funding for these campaigns is often provided by governments or organizations like the Environmental Defense Fund (EDF) to researchers working at independent, English-speaking institutions. Similar funding may not be available in other countries. Peer-reviewed journal articles detailing the science performed in these campaigns are also written and published in English given the location of authorship. The combination of these elements may result in geographically clustered studies, but does not indicate the issue of CH4 emissions is absent elsewhere, or even particularly notable in some target regions in the U.S.
Although research on CH4 emissions is geographically clustered to the U.S., there is abundant evidence that suggests that CH4 emissions could be greater elsewhere (e.g., Lauvaux et al 2022). As such, there is clear and pressing need for research outside of the U.S. to help monitor emissions globally. This has been recognized by the research community, and satellites are widely touted as a tool to help remotely monitor emissions with a globally consistent methodology that is not affected by friction in ground access. The rapid, recent acceleration of satellite papers (see figure 6)—most with global focus—suggests that the issue of geographic bias could be less prominent in the future, but not entirely resolved (Gao et al 2023). We recommend that more work be conducted on the ground to support the satellite work outside of the U.S., possibly leveraging the model of large-scale programs to ease the logistical and stakeholder relations work for individual researchers.
The role of the U.S. as the world's largest O&G producer means that individual states contribute significantly to global production. North Dakota is responsible for ∼10% of crude oil production in the U.S. and thus almost 1.5% globally (EIA 2022a). The oil-producing nature of the Bakken Formation in North Dakota has translated to significant flaring of associated natural gas at the wellhead and documented occurrences of flares that are unlit, malfunctioning, or not operating at engineered efficiencies (Plant et al 2022). Similarly, Oklahoma produces 3.5% and 0.5% of U.S. and global crude oil, respectively, and 7% of the marketable natural gas in the U.S. (EIA 2022b). Despite this, fewer articles in the review focused on North Dakota and Oklahoma compared to other states with notably lower production volumes (e.g., California, Colorado, Utah).
4.2. Methodological bias and trends
The methods used to measure emissions varied considerably (figure 6), and our classification into close-range or stand-off helpfully summarize the general capabilities of each. Underlying these trends, however, is some major and notable evolution in measurement. Access to these measurement tools—and their relative utility—inherently exerts control on the methodology trends in publications.
Measurement technology has rapidly advanced in the past decade—some methods became available partway through the review window. For example, new satellites and methods to work with satellite data (e.g., Lauvaux et al 2022) have emerged in a particularly effective form only recently. This availability and the relative utility of different methods modulates trends in methodology (figure 6); the increase in popularity of a certain method may be the result of its availability. Further to this, technology availability is the first step in a relatively long maturation process. Measurement technology must be tested in both controlled and uncontrolled environments and the limitations understood on the path to acceptance in scientific studies. Broadly, figure 6 shows uptake of a suite of methods that are relatively young and in many cases immature.
Additionally, methodology can reflect study goals and research questions. Measurement campaigns can provide monitoring at a region-/basin-level (e.g., Chan et al 2020), or focus on root cause and the mechanics of emissions (e.g., Johnson et al 2019), similar to most industry leak detection and repair (LDAR) programs. The study goal of monitoring emissions, without providing direct data to reduce CH4 emissions, tends to suit larger scale, stand-off methods. The study goal of providing data on root cause often requires close-range methods and O&G industry involvement. Both close-range and stand-off methods have increased in popularity throughout the review (figure 6). The differences here may also reflect perspectives of researchers in the role of the scientific community. Some researchers, lacking site access or deep knowledge of O&G processes, put the responsibility for assessing root cause and mechanically reducing emissions to the O&G industry. In contrast, other researchers engage directly with the O&G industry to obtain site access, deploying close-range methods to provide insight on the mechanics of emissions.
Objectivity considerations are an important modulator of study method. There is a possibility for bias when site access is required, or when the O&G industry has advance notice of a measurement campaign. Bias can exist when certain sites are provided for researcher access, or even when process conditions are deliberately changed during the measurement campaign (e.g., Mitchell et al 2015). Regardless of whether bias exists—the possibility for bias is enough for many researchers to preferentially value stand-off methods that can be operated without industry involvement, partially modulating method choice.
Although large scale monitoring is helpful, there is also value in advancing knowledge of the root cause of emissions. The O&G industry faces pressure to abate emissions, but if knowledge on the exact sources is vague, efforts can be misguided or inefficient. Science work on O&G sites with close range methods can be difficult, but there is important value in identifying root cause to accelerate abatement and provide general science-based, publicly accessible guidance on effective abatement strategies.
Identifying root cause may be most relevant in the context of new, very large CH4 emissions being detected globally with satellites. Most of what is currently known about these emitters is based on remote hypotheses of potential sources and causes; little ground-based verification has been performed. Empirical measurements are not always possible or required to identify root cause—more open dialogue between researchers and the O&G industry could provide a better understanding of root cause and accelerate abatement. This work is already underway as part of the IMEO's MARS and forthcoming in the U.S. EPA's super-emitter response program (U.S. EPA 2023a), but efforts to improve researcher-industry dialogue could be expanded and amplified through similar initiatives.
4.3. Measurement completeness
This review highlights that a reliable, comprehensive, and complete representation of CH4 emissions from the O&G industry does not exist. This is perhaps most strongly indicated by the widespread lack of agreement between emissions-factor based inventories and measurements (at various levels). While many articles in the review were unsuccessful at explaining the differences between these two approaches to estimate emissions, Rutherford et al (2021) used measurements from several component-level studies in a statistical framework to derive a BU estimate of CH4 emissions from U.S. O&G production. Their estimate agrees with the estimate from Alvarez et al (2018)—a national synthesis of site-level measurements—to within ∼10%. The former study also found that equipment-level emissions and unintentional releases from liquids storage tanks were the main sources of disagreement between their estimate and the U.S. Greenhouse Gas Inventory (GHGI). Future comparisons between TD and BU emissions data should incorporate similar techniques demonstrated in Rutherford et al (2021) to improve the accuracy of estimates and identify the areas where these approaches diverge.
Measurement is often discussed as a solution to produce a more accurate portrait of CH4 emissions. However, this review showed that measurements are not all commensurate. Measurements are modulated by large differences in method observational extent, detection limit, and spatial and temporal coverage. For example, the emissions profiles in figure 8 are quite different—a result that is partly conditioned by the measurement method. No one method can measure it all.
Thus, it is likely that measurement completeness will only be achieved through integration of data from many different types of measurement methods, ideally with complementary characteristics. Few publications in this review approached the topic of measurement integration (cf, Johnson et al 2023); however, we believe integration to be a necessary next step. Measurement integration demands excellent understanding of method skill, which requires careful, dedicated, and expensive testing (Conrad et al 2023). Following this, measurements must be brought together in a statistical framework that carefully tracks uncertainties. Further, there are important considerations addressing temporal variability (Vaughn et al 2018) in sources. Temporal variability primarily links uncertainty to the extent of results but can be addressed with statistical tools. At present, the tools and methods for integration of measurements are not well developed. We recommend additional research on measurement integration, which is a recommendation shared by other stakeholders and initiatives such as the IMEO to help address this research gap.
5. Conclusions and recommendations
This scoping review documented and synthesized research on CH4 emissions measurements from onshore O&G sources in 237 peer-reviewed journal publications. The objective was to benchmark the current state of knowledge and provide key insights on future research directions amidst increasing global momentum to reduce CH4 emissions. The following major research themes were documented from articles:
- The research domain is relatively new. There is an upward trend in publication frequency from 2012 to 2022.
- Most articles included in the review studied CH4 emissions from the U.S. O&G industry and were published by U.S.-based authors. Other countries were under-represented in articles.
- Upstream O&G was the most frequently studied supply chain segment, with most articles focused on the U.S. upstream segment.
- Most articles performed measurements at the site- or region-/basin-levels, which limits identification of the sources and root causes of emissions.
- The most common emissions sources identified in articles were well pads, compressors/compressor stations, tanks, unlit flares, and natural gas processing plants. Large emissions from these sources were noted.
- High temporal variability of emissions was reported in some articles, but most articles acquired one-off, snapshot measurements of sources.
- Reported CH4 emissions profiles were consistently heavy-tailed but varied by region and method. The largest emissions profiles were obtained with satellites, but these profiles showed the least skew relative to those obtained with other methods.
- Research consistently showed that BU inventories, as well as industry estimates of emissions, under-estimate emissions compared to TD measurements.
Based on these major themes identified in the literature, we recommend that future research focus on:
5.1. Field-based emissions studies for under-represented regions and source categories
Most studies targeted the U.S. O&G industry, but little is known from the English-language peer-reviewed literature about CH4 emissions in other countries beyond new insights from satellites. Rectifying geographic bias will take extensive time and effort, but is essential to accurately portray CH4 emissions from the O&G industry globally, not just the U.S.
5.2. Identifying root causes and linking measurements to mitigation
Measurements at the site- or regional-level can be useful to understand emissions from the O&G industry and monitor performance; however, close-range measurements are required to identify root cause and guide mitigation. There is substantial ambiguity around the exact sources of CH4 emitted from O&G infrastructure, and research and enhanced dialogue between stakeholders on these topics can help advance the general state of knowledge surrounding emissions.
5.3. Multi-level emissions integration
Emissions profiles are conditioned by the measurement method, and all profiles are incomplete. Therefore, future research must characterize emissions with multiple measurement methods at different spatial levels to fully inform strategies and policies to reduce emissions. Integration of source measurements from different methods is required to contextualize the emissions data, enabling a more accurate identification of mitigation priorities. Integration will improve the certainty in current emissions estimates, which is needed to credibly track progress and verify reductions.
This review highlights a state of science that is young, immature, and rapidly evolving. Measurement has some identifiable shortcomings, which introduce uncertainty into the efficacy of strategies, policies, and actions to reduce emissions developed in response. The nascency of understanding of CH4 emissions from the O&G industry requires accelerating and intensifying the current pace of scientific research—with new and welcome rigor—to advance the knowledge foundation in support of immediate and large-scale reductions in CH4 emissions globally.
Acknowledgments
We thank Kayrros SAS for providing the methane ultra-emitters dataset. This research was supported with funding from the Canada First Research Excellence Fund (CFREF) Global Research Initiative (GRI) and a Natural Sciences and Engineering Research Council (NSERC) of Canada scholarship. We thank the reviewers and editors for their thoughtful comments and suggestions that led to improvements to the paper.
Data availability statement
Covidence literature management software was used to remove duplicate articles from the database searches and screen articles for eligibility (Covidence 2022 ). NVivo qualitative analysis software Version 12 was used to review and extract data from the articles (Lumivero 2017). Microsoft Excel was used to update the review at the end of 2022. The NVivo project and data charting codebook, as well as the Excel project update file, can be downloaded here: https://doi.org/10.5683/SP3/OOCMMZ. NVivo can be used to view the data charting structure and sources of evidence extracted from articles included in this work. Methane ultra-emitters shown in figure 4 were provided by Kayrros SAS. The U.S. Energy Information Administration (EIA) was the source for the sedimentary basin data used in figure 4(b): https://www.eia.gov/maps/maps.htm (EIA 2016). The data from Tyner and Johnson (2021) used in figure 8 are measurements at multi-well batteries and were extracted from the main text using WebPlotDigitizer version 4.6., available at https://automeris.io/WebPlotDigitizer/ (Rohatgi 2022).
Supplementary information (0.1 MB DOCX)