

Abstract
Urban blue-green spaces offer numerous environmental and social benefits to human beings. As these spaces vary by season, residents' preferences may also change. However, the seasonal differences in preferences and the factors influencing waterfront degree preferences in different seasons remain unclear. This study employs space syntax theory to measure the configurational attributes of blue-green spaces in Changhe Park, Dezhou, China, and utilizes a four-section questionnaire to investigate residents' preferences. The methods applied in this research include convex analysis, Mann-Whitney U test, and Spearman's rho correlation analysis. The main findings are fourfold: (1) park users predominantly consist of older, less educated, and lower-income individuals; (2) blue spaces have higher choice values than green spaces; (3) season significantly impacts waterfront preferences, with 21.8% of respondents preferring high-degree waterfronts in summer, compared to 4.6% in winter; (4) age group is the sole decisive factor for blue space preference in summer, while sex and time spent in the park contribute to winter preferences. These findings contribute to the understanding of seasonal preferences for urban blue-green spaces and inform planning and design strategies, such as targeting specific demographic groups or adjusting waterfront features to enhance year-round appeal.
Export citation and abstract BibTeX RIS

Original content from this work may be used under the terms of the Creative Commons Attribution 4.0 licence. Any further distribution of this work must maintain attribution to the author(s) and the title of the work, journal citation and DOI.
1. Introduction
In recent years, over half of the global population has come to reside in urban environments (United Nations 2015). This escalating urbanization has led to a notable decline in both the accessibility and quality of nature experiences for urban residents (Van Den Berg et al 2007, Soga et al 2016), particularly in developing countries, where rapid rural-urban migration and urban land area expansion prevail (Gong et al 2012). These emergent challenges pose significant obstacles to urban planning efforts aiming to enhance the well-being of an increasing number of city inhabitants. However, such challenges also present a unique opportunity for fostering green urban development by implementing strategic measures that maximize the potential benefits of urban blue-green spaces, ultimately elevating the living standards of urban dwellers.
Blue-green spaces, which refer to the combination of water bodies (blue spaces) and green vegetation (green spaces) within urban areas, serve as essential components of sustainable urban planning and design. These spaces exhibit varying characteristics at both macro and micro levels, with the macro-level encompassing broad ecological areas such as water bodies, forests, coastal zones, cultivated land, parks, and gardens, and the micro-level referring to smaller vegetated spaces such as urban parks, gardens, courtyards, urban forests, and urban farms (Taylor and Hochuli 2017). These spaces provide numerous ecological, social, and health benefits to urban residents, contributing to enhanced environmental quality (Tzoulas et al 2007). At the macro scale, blue-green spaces promote urban resilience by mitigating the adverse effects of climate change, such as heat island effects, flooding, and stormwater management (Gill et al 2007, Bowler et al 2010, Sun and Chen 2012, Liu et al 2021). Furthermore, they support biodiversity by providing habitats and connectivity for various plant and animal species within urban contexts (Dearborn and Kark 2010). Moving to the micro scale, blue-green spaces positively impact the mental and physical well-being of urban residents by offering opportunities for recreation, social interaction, and stress reduction (Kaplan 2001, Hartig et al 2014). Additionally, they enhance the aesthetic appeal and identity of cities, fostering a sense of place and improving overall quality of life for inhabitants (Niemelä et al 2010).
The various components of urban landscapes can significantly influence visitors' preferences and experiences. These components include plant compositions, openness-enclosure of spaces, size of spaces, and connection of spaces. The type and arrangement of plants in urban landscapes have been found to significantly influence people's preferences, psychological well-being, and perceived safety (Chiesura 2004, Nordh et al 2011, Shanahan et al 2015). Different combinations of grass, grass-shrub, and grass-shrub-tree can create varying aesthetic and ecological values within urban landscapes (Todorova et al 2004, Harris et al 2018). The degree of openness or enclosure in a space can create different experiences and levels of accessibility (Coeterier 1996, Lindal and Hartig 2013). Open spaces often promote social interactions and facilitate visibility, while enclosed spaces can provide a sense of intimacy, privacy, and protection from the elements (Ode et al 2009, Korpela et al 2010). The size of urban landscape spaces can also impact peoples' the perception of and preference for these areas. Larger spaces can evoke a sense of grandeur and provide opportunities for various recreational activities, while smaller spaces can offer a more intimate and cozier atmosphere (Stamps 2011). The connectivity of urban landscape spaces can impact how people perceive and navigate the urban environment (Mehta 2007, Brown et al 2012). High connectivity promotes ease of movement, accessibility, and social interaction, while lower connectivity can foster a sense of seclusion and tranquility (Van Herzele and Wiedemann 2003, Korpela et al 2010).
The configuration of blue-green spaces can significantly impact the activities that take place within them (Baran et al 2013, Ma 2020). As blue-green spaces are often unevenly distributed over space, some parts of these areas may be disproportionately available to a subset of visitors. Empirical research has revealed that the configuration of the urban environment is correlated with the number of leisure walking trips, pedestrian movement rates, and route choices (Baran et al 2008, Pont and Marcus 2015, Ozbil et al 2016). The evaluation of spatial configuration can help identify potential and usability issues of services such as car parking spaces, toilets, and drinking fountains (Perry et al 2018). By identifying and addressing potential barriers to access and usability, urban planners and designers can create blue-green spaces that offer greater benefits to a larger portion of the population.
Despite the extensive research on blue-green spaces, there is limited understanding of the seasonal variation in residents' preferences for these areas. Some studies have touched upon the subject indirectly, such as examining seasonal differences in the visual aesthetic preference (Xu et al 2022) and physical activity in urban green spaces (Roberts et al 2017, Kim et al 2018) and the influence of weather conditions on the perception of urban blue spaces (Hewer et al 2015, Zhou et al 2022). Other research has considered the impacts of seasonality on mental health benefits associated with green spaces (Barnes et al 2019, White et al 2021), as well as the effects of season on the microclimate and thermal comfort of urban green areas (Wang et al 2018, Elliott et al 2019). However, these studies only partly address the question of how residents' preferences for blue-green spaces might change with the season, leaving room for further investigation. Therefore, further investigation into the seasonal variation in residents' preferences for blue-green spaces is necessary to create more effective and equitable blue-green spaces that contribute to the well-being and satisfaction of urban residents throughout the year.
While a substantial body of research has investigated the general preference for waterfront spaces (Wu Li et al 2019, Wang et al 2020), little attention has been paid to how seasonal variations might affect the factors influencing these preferences. Although some studies have considered seasonal changes in visitor behavior and perception of urban green spaces (Wu Chen et al 2019), the specific issue of waterfront preference in different seasons remains understudied. Furthermore, while studies have examined the ecosystem services provided by waterfront spaces, such as improving biodiversity and providing a cooling effect during hot summers (Jiang et al 2020, Yang et al 2020, Hyseni et al 2021), the role of spatial configuration in determining preferences for blue-green spaces is not well understood. Identifying the factors that influence waterfront preferences and understanding the role of spatial configuration in shaping these preferences can provide valuable insights for urban planners and designers seeking to create more responsive and effective waterfront spaces.
Against this backdrop, this study seeks to address the need to better understand seasonal preferences and factors influencing residents' choices for blue-green spaces, particularly in rapidly urbanizing areas like Dezhou, China. The research is conducted in response to the growing demand for sustainable urban development and the increasing importance of blue-green spaces in enhancing the quality of life for residents. The study applies space syntax theory to measure the configurational attributes of blue-green spaces, investigates the preferences of residents for blue-green spaces through a questionnaire survey, and analyzes the factors that influence the degree of waterfront preference among residents in different seasons. Specifically, this study aims to answer the following research questions: (1) What is the role of spatial configuration in determining blue-green space preferences? (2) How do seasonal variations affect residents' preferences for blue-green spaces in an urban park setting in Dezhou, China? (3) What factors influence the degree of waterfront preference among residents in different seasons? (4) How can the findings be applied to inform landscape design and urban planning that accommodates seasonal variations and diverse user preferences? The findings of this study will serve as a realistic reference for both theoretical and practical urban and regional planning with respect to landscape design, providing valuable insights into the design of blue-green spaces that are responsive to seasonal variations and meet the diverse needs and preferences of urban residents.
2. Literature review
Urban blue-green spaces, integrating water bodies (blue spaces) and green vegetation (green spaces) within urban locales, have gained recognition for their multidimensional benefits. These benefits include ecological, psychological, and social contributions, enhancing human well-being and urban livability (Tzoulas et al 2007, Kabisch et al 2015). In the context of urban landscape and design, these spaces incorporate various features such as parks, gardens, green roofs and walls, wetlands, rivers, canals, and ponds (Yang et al 2020, Yu et al 2020, Sun et al 2021). The conceptualization of blue-green spaces has evolved over the years, reflecting the growing understanding of their multidimensional benefits. Key benefits include promoting physical and mental health (Hartig et al 2014), enhancing biodiversity (Donati et al 2022), mitigating urban heat island effects (Liu et al 2021), and facilitating recreation and social interaction (Vaeztavakoli et al 2018, Pouso et al 2021).
Blue spaces, in particular, offer distinctive benefits for healing and wellness (Völker and Kistemann 2011, Gascon et al 2017), exhibiting positive mood effects (Foley and Kistemann 2015), attractiveness (Kati and Jari 2016), and perceived restorative abilities (Nutsford et al 2016). Additionally, many healing sites are situated near springs and other water sources (Gesler 2003, Adams 2016), and sounds of water, such as breaking waves and flowing streams, are often perceived as calming and restorative (White et al 2010). Overall, the multitude of benefits from blue-green spaces accentuates their significance in urban design and planning.
Existing studies have investigated different aspects of blue-green spaces, such as accessibility (Wolch et al 2014), user preferences (Özgüner and Kendle 2006), and perceived benefits (Wang et al 2022). Research on accessibility normally focuses on identifying disparities in the distribution and availability of blue-green spaces in urban areas (Mayen Huerta 2022, Venter et al 2023). User preference studies have sought to understand how different demographic groups perceive and interact with blue-green spaces (Luo et al 2023), and how these preferences might inform the design and management of these environments (Lamond and Everett 2019). Factors such as age, gender, cultural background, and socio-economic status have been found to influence preferences for specific types of blue-green spaces and amenities (Van Herzele and Wiedemann 2003, Zhang et al 2017). Studies on the perceived benefits of blue-green spaces have examined the multitude of ways in which these spaces contribute to human well-being, including physical and mental health, social cohesion, and environmental sustainability (White et al 2013, White et al 2020). Despite the wealth of knowledge on blue-green spaces, gaps remain in our understanding of how seasonal variations and spatial configuration influence user preferences and the factors affecting waterfront degree preferences in different seasons.
The investigation of spatial configuration and human behavior in blue-green spaces has employed a variety of methodologies. Geographic Information Systems (GIS) for spatial analysis (Zhang et al 2017, Stessens et al 2020), agent-based modeling for human behavior simulation (Picascia and Mitchell 2022), and landscape metrics for quantifying landscape patterns (Wu et al 2002) are among the most utilized. However, the potential of space syntax theory in examining spatial configuration, particularly in urban areas, has recently been recognized (Kim and Sohn 2002, Mahmoud and Omar 2015, Yao et al 2021). Space syntax offers an analytical framework that examines the arrangement and connectivity of spaces to determine their influence on human behavior, movement, and urban social interactions (Peponis et al 2008, Marcus et al 2016). Ma (2020) deployed this methodology on an urban scale to examine the correlation between the distribution of urban green spaces and street connectivity in Jinan, China (Ma 2020). In contrast, on a site scale, Mahmoud and Omar (2015) explored the effect of a proposed tree planting design on visual fields in an urban park in Cairo, Egypt, leveraging space syntax theory (Mahmoud and Omar 2015). The applicability of space syntax theory in discerning the interplay between spatial configuration and human behavior has facilitated the creation of efficient, equitable, and sustainable blue-green spaces. Recent studies have further explored the theory's utility in evaluating the relationship between the spatial arrangement of blue-green spaces and human behaviors, such as movement patterns (Jeong et al 2021), social interaction (El-Darwish 2022), and preferences for particular landscape features (Foltête and Piombini 2007, Li et al 2016). These investigations have yielded insights on how the design and organization of blue-green spaces can influence public engagement and user experience.
Connectivity, integration, and choice are fundamental measures in space syntax analysis, often used to evaluate the accessibility and flow potential of various spaces within an urban environment (Hillier 2007). Connectivity measures the number of neighboring spaces that are directly connected to a specific space. Integration measures the degree of accessibility of a given space from other spaces, with global and local integration representing the average accessibility from all other spaces in the configuration and the average accessibility from spaces that can be reached through a particular number of convex spaces, respectively. Prior research has demonstrated that global integration is positively correlated with pedestrian movement and leisure walking, while local integration is negatively associated with these factors (Hillier 2007, Baran et al 2008, Sharmin and Kamruzzaman 2018). Choice, also known as betweenness, measures the extent to which a given space is encountered on the shortest path between any two spaces in the configuration, indicating the center of the configuration and providing insight into pedestrian movement flows (Lerman et al 2014, Berhie and Haq 2015). These measures have been effectively employed in the analysis of diverse urban environments, including public spaces and parks, underscoring their relevance and utility in investigating the interplay between spatial configuration and human behavior.
In conclusion, this study extends the current knowledge on blue-green spaces by focusing on the impact of seasonal variations on user preferences and the influence of spatial configuration on the experience of users. Building on the existing research on accessibility, user preferences, and perceived benefits, this study aims to provide a more comprehensive understanding of blue-green spaces and their potential to enhance the health, well-being, and resilience of urban residents. Such a comprehensive understanding is essential in the development of urban planning and design strategies that effectively leverage the benefits of blue-green spaces for all residents, regardless of their demographic characteristics or seasonal preferences.
3. Methodology
3.1. Methodological framework
The methodological framework of this study is illustrated in figure 1. First, we collected basic data on Changhe Park and conducted field measurements for validation. To perform convex analysis, we constructed a convex map to analyze the spatial relationships within the park. Descriptive statistics and multivariate analysis of variance (MANOVA) were then applied to the convex analysis results to identify differences between green and blue spaces.

Figure 1. Methodological framework.
Download figure:
Standard image High-resolution imageSimultaneously, a literature review and semi-structured interviews were conducted to inform the design of our questionnaire survey. A pre-test was carried out prior to the formal survey to ensure its validity. Subsequently, we analyzed the survey data using descriptive statistics, the Mann-Whitney U test, and Spearman's rho correlation analysis. Based on the findings, we provided design recommendations for urban blue-green spaces.
The following sections provide detailed information and approaches to achieve the abovementioned aspects.
3.2. Study site
This study was conducted in Changhe Park, located in Dezhou City, China (figure 2). Dezhou City is located at 36°24'25'' to 38°0'32'' N and 115°45' to 117°36' E, and has a continental monsoon climate with hot summers and cold winters. The average daily low temperature drops below −5 °C during winter (Dezhou Bureau of Statistics 2019). Changhe Park, a representative blue-green space in northern China, is situated in northwestern Dezhou City. The park encompasses an area of 7.3 km2, including 2.4 km2 of water space.

Figure 2. The location of the study site.
Download figure:
Standard image High-resolution imageThe selection of Changhe Park as the study site was justified by its attributes: a diverse and stable landscape, an integrated blue-green ecosystem, and the capacity to support various recreational activities while promoting social cohesion. These characteristics are not only desirable but also commonly observed in urban blue-green spaces across the globe. Therefore, although the study focuses on Changhe Park, the insights obtained could be relevant to a broad range of similar urban settings, providing generalizable principles for urban blue-green space design and planning.
Basic data, encompassing the park plan and functional zoning map, were supplied by the Dezhou Architectural Planning and Design Institute.
3.3. Spatial syntactic analysis
We apply space syntax theory to measure the configurational attributes of blue-green spaces. Space syntax theory is a powerful tool that considers the spatial characteristics of an environment and how they affect the movement and behavior of individuals (Hillier and Hanson 1989). Convex analysis, which focuses on the spatial configuration of an environment and its impact on human movement and behavior patterns, is used to explain the spatial relationships within the study area. Specifically, we use three key measures of space syntax theory - connectivity, integration, and choice - as syntactical measurements (Hillier and Iida 2005) to analyze the spatial configuration of Changhe Park. These elements were chosen as they provide valuable insights into the spatial relationships within Changhe Park, helping to understand how different landscape components and spatial configurations influence human preferences for blue-green spaces.
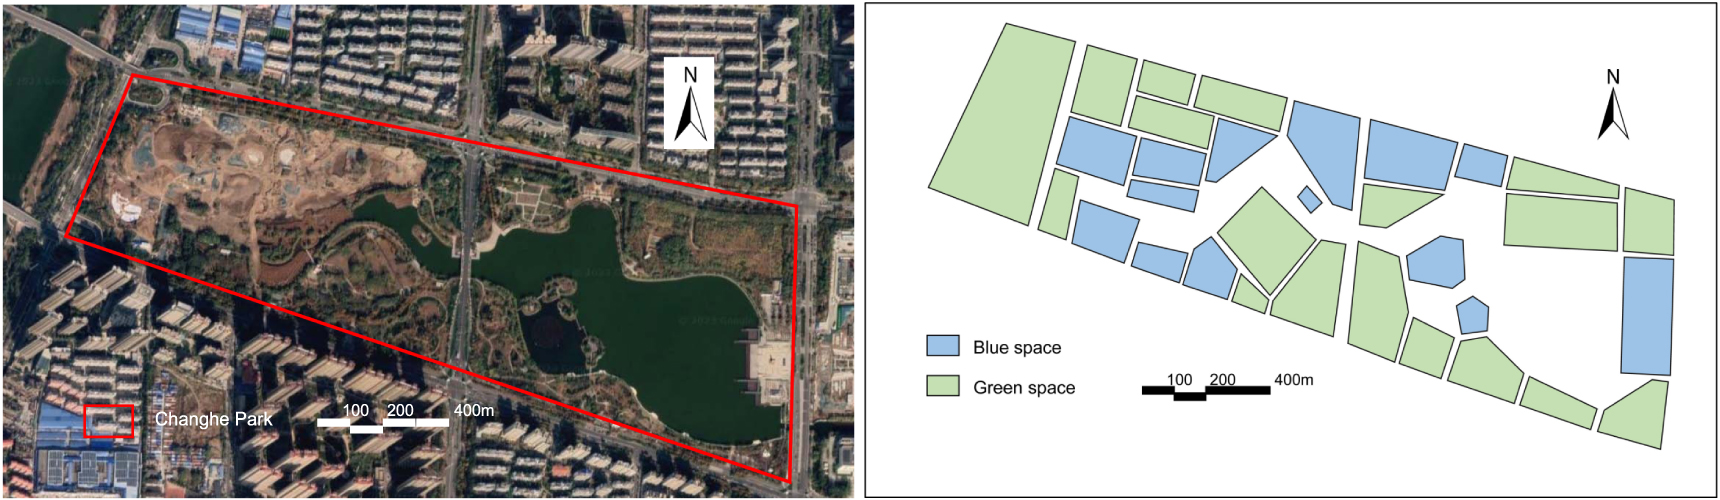
To conduct the spatial analysis, we utilized the convex space partitioning method, which converts continuous space into a connected set of discrete units. Convex space, a fundamental unit of topological space in the space syntax theory (Hillier 2007) was used to partition Changhe Park into a set of convex spaces, creating a convex map (figure 3). The spaces were categorized into blue and green, resulting in a total of 32 convex spaces, comprising 14 blue spaces and 18 green spaces. For the syntactic analysis, we used depthmapX, an open-access software platform that performs a range of spatial network analyses designed to understand social processes within the built environment.

Figure 3. Satellite image of Changhe Park (left) and justified graphs (right) of blue and green spaces.
Download figure:
Standard image High-resolution imageThe diagram and justified graphs in figure 4 illustrate the syntactical relationships between spaces in Changhe Park, providing a visual representation of the permeability between the different spaces. The justified graphs extend from the root spaces (entries 1–5) to connect all the spaces in the system, allowing for the calculation of integration and choice measures for each space. The descriptive results of connectivity for each convex space are shown in table 1. These measures will be used to examine how spatial configuration affects residents' preferences for blue-green spaces in different seasons.

Figure 4. Permeability between spaces, and justified graphs for Spaces.
Download figure:
Standard image High-resolution imageTable 1. Connectivity of changhe park.
| Connectivity | Number of spaces | Space number |
|---|---|---|
| 1 | 2 | 12 16 |
| 2 | 11 | 0 3 5 8 19 21 22 23 25 26 31 |
| 3 | 13 | 2 4 6 13 14 15 18 20 24 27 28 29 30 |
| 4 | 6 | 1 7 9 10 11 17 |
3.4. Questionnaire survey
This study conducted a structured questionnaire survey to explore residents' preferences for Changhe Park. Based on the literature review and face-to-face semi-structured interviews with local residents, the questionnaire was designed with four sections, covering questions about the respondents' socioeconomic conditions, commuting and usage habits in Changhe Park, preference for landscape components, and preference for degree of waterfront. The units of inquiry were individual park users.
In this study, individual-level sociodemographic variables were collected to understand how these variables may influence preferences for blue-green spaces. These variables included sex (male or female), age group (≤14, 15–24, 25–44, 45–64, and ≥ 65 years), education levels (secondary school or lower, high school or technical school, degree, master or higher), and monthly income per capita (no income, ≤ 2 000, 2 000–3 000, 3 000–5 000, 5 000–10 000, and ≥10 000 CNY). Commuting and usage habits were also assessed through the survey, including the respondent's cost time for access (<5, 5–15, 15–30, and >30 min), means of commuting transportation (walking, cycling, public transport, driving), use frequency (daily, 1–3 x per week, 1–3 x per month, 1–6 x per year, and rarely), normal duration of visits (<1, 1–3, and >3 h), and preferred activities (walk or sport, walk the dog, babysitting, trip with family and friends, and recreation). In addition, the landscape components of blue-green spaces were extended to a combination of plants (grass, grass-shrub, grass-shrub-tree), openness-enclosure of spaces (open, half-open, and closed), size of spaces (small, medium, and large), and connection of spaces (low, medium, and high). These data were collected to examine how individual-level and environmental factors may interact to influence preferences for different types of blue-green spaces in different seasons.
To examine residents' preferences for degree of waterfront in different seasons, the degree was divided into three categories: low, medium, and high. These categories represent varying levels of visibility and proximity to the water within the blue-green spaces (Völker and Kistemann 2011, Gascon et al 2017). A low waterfront degree refers to areas where the water is not visible due to obstructions such as vegetation or built structures. A medium waterfront degree indicates areas where the water can be seen through the plants or other landscape elements, providing partial visibility and interaction with the water. Lastly, a high waterfront degree represents areas directly near the water, offering unobstructed views and immediate access to the waterfront, which have been shown to be particularly attractive and beneficial to users. Respondents' preferences for each category in winter and summer were assessed in the survey to determine the factors that influence the degree of waterfront preference among residents in different seasons.
The sample size of 350 study participants was determined based on previous studies on urban park preferences (Özgüner and Kendle 2006, Özgüner 2011, Mak and Jim 2019), as well as the recommendation of Krejcie and Morgan (1970) for determining sample sizes for populations of unknown size (Krejcie and Morgan 1970). The sampling technique employed was stratified random sampling, in which park visitors were proportionally selected on weekends and weekdays, as well as during different hours of the day, to ensure a representative sample of park users.
To ensure the validity of the questionnaire, a smaller pre-test study was conducted using an intercept survey method to randomly select visitors on-site (Beatty and Willis 2007, Groves et al 2011). The formal questionnaire survey was then conducted in December 2019, with informed consent obtained from all individual participants included in the study. Prior to answering the questions, participants were introduced to the purpose of the survey for one minute. The survey was conducted face-to-face in the local language (Mandarin) to ensure accurate responses, clarify any questions or confusion, and maintain a high response rate. A stratified random sampling technique was employed to proportionally select park visitors on weekends and weekdays, as well as during different hours of the day, to ensure a representative sample of park users. Out of the 350 survey sheets collected, 307 were considered valid and included in the analysis.
The study is a non-interventional study. Informed consent was obtained from all individual participants included in the study.
3.5. Statistical analysis
After data collection, multiple statistical analyses were conducted using R version 4.1.2, an open-source programming language and software environment for statistical computing and graphics (R Core Team 2016). Descriptive statistics were used to analyze the syntactical measures, while multivariate analysis of variance (MANOVA) was used for choice, local integration, and global integration to determine the differences between green and blue spaces, allowing for the simultaneous examination of multiple dependent variables (Hair 2009). The demographic information of the participants was first analyzed using basic descriptive statistics. The non-parametric Mann-Whitney U test, which compares the distributions of two independent samples, was used for pair-wise comparison analysis to identify differences among residents' preferences for space in summer and winter. Finally, Spearman's rho correlation analysis, a non-parametric measure of the strength and direction of the association between two ranked variables (Hauke and Kossowski 2011), was performed to determine the relationship between space preference and respondents' demographic characteristics, commuting habits, and landscape design elements.
4. Results
4.1. Spatial syntactic characteristics of changhe park
The results of the syntactic analysis showed significant differences in the characteristics of green and blue spaces within Changhe Park. Specifically, the MANOVA test confirmed a significant difference between the combined morphology of the green and blue spaces (F = 3.025, p < 0.05), with significant differences found in choice (p = 0.029) and global integration (p = 0.098), but not in local integration (p = 0.713) (table 2). Blue spaces were found to have a significantly higher choice than green spaces, with a mean choice 1.7 times higher than that of the green spaces (169.64 versus 100.17) (table 2 and figure 5). The design pattern of blue spaces was also found to be more permeable, providing easier syntactic accessibility between spaces compared to green spaces, as evidenced by their location within paths penetrating other convex spaces (figures 3 and 4). In terms of global integration, blue spaces had a slightly higher mean value than green spaces, indicating that they were easier to access on average (table 2 and figure 5). Furthermore, the standard deviation of global integration for blue spaces was 1.7 times higher than that of green spaces, suggesting that the depth of green spaces varies more than that of blue spaces. The wider range of blue spaces' global integration values (0.49 to 0.76) compared to that of green spaces (0.53 to 0.70) also supports this finding (table 2 and figure 5).
Table 2. Descriptive statistics and MANOVA analysis for syntactical parameters of blue and green spaces.
| Blue space | Green space | MANOVA Sig. | ||
|---|---|---|---|---|
| 0.046** | ||||
| Choice | Mean | 169.64 | 100.17 | 0.029** |
| St.Dev | 107.87 | 62.35 | ||
| Maximum | 293.00 | 199.00 | ||
| Minimum | 0.00 | 0.00 | ||
| Global | Mean | 0.66 | 0.61 | 0.098* |
| Integration | St.Dev | 0.10 | 0.06 | |
| (Rad = n) | Maximum | 0.76 | 0.70 | |
| Minimum | 0.49 | 0.53 | ||
| Local | Mean | 1.24 | 1.21 | 0.713 |
| Integration | St.Dev | 0.31 | 0.21 | |
| (Rad = 3) | Maximum | 1.81 | 1.65 | |
| Minimum | 0.81 | 0.89 |
Notes: ** and * denote statistical significance at the 5%, and 10% levels, respectively

Figure 5. Boxplots of syntactical parameters of blue and green spaces.
Download figure:
Standard image High-resolution image
4.2. Descriptive statistics of questionnaire surveys
4.2.1. Demographic characteristics of the respondents
The demographic profiles of Changhe Park users indicated that the majority were older adults with lower levels of education and income. The gender distribution was balanced, with 50.2% male and 49.8% female respondents (table 3), similar to the official gender ratio of Dezhou City in 2019 (Dezhou Bureau of Statistics 2019). Specifically, 42.7% of the respondents were over 65 years old, while 33.6% were between 45 and 64 years old. Educational attainment was low, with half of the respondents reporting no educational experience or only primary or secondary education, and 24.4% with high school or technical school education (table 3). Furthermore, 77.2% of respondents had a monthly income under 5,000 CNY (table 3). These findings suggest that the park may be more commonly used by older residents with lower levels of education and income, which should be considered in designing and managing blue-green spaces for diverse populations.
Table 3. Descriptive statistics of participant characteristics.
| Variables | N | % |
|---|---|---|
| Sex | ||
| Male | 154 | 50.2 |
| Female | 153 | 49.8 |
| Age group | ||
| 14 years | 27 | 8.8 |
| 15–24 years | 16 | 5.2 |
| 25–44 years | 30 | 9.8 |
| 45–64 years | 103 | 33.6 |
| >65 years | 131 | 42.7 |
| Education | ||
| Missing, Primary or secondary school | 136 | 44.3 |
| High school or technical school | 75 | 24.4 |
| Degree | 87 | 28.3 |
| Master or higher | 9 | 2.9 |
| Monthly income per capita | ||
| No income | 35 | 11.4 |
| ≤2,000 CNY | 58 | 18.9 |
| 2,000–3,000 CNY | 40 | 13.0 |
| 3,000–5,000 CNY | 104 | 33.9 |
| 5,000–10,000 CNY | 66 | 21.5 |
| ≥10,000 CNY | 4 | 1.3 |
| Cost for access | ||
| <5 min | 27 | 8.8 |
| 5–15 min | 214 | 69.7 |
| 15–30 min | 57 | 18.6 |
| >30 min | 9 | 2.9 |
| Means of transportation | ||
| Walking | 158 | 51.5 |
| Cycling | 94 | 30.6 |
| Public transport | 22 | 7.2 |
| Driving | 33 | 10.7 |
| Frequency | ||
| Daily | 63 | 20.5 |
| 1–3 x per week | 187 | 60.9 |
| 1–3 x per month | 42 | 13.7 |
| 1–6 x per year | 12 | 3.9 |
| Not at all | 3 | 1.0 |
| Duration of visiting | ||
| <1 h | 16 | 5.2 |
| 1–3 h | 244 | 79.5 |
| >3 h | 47 | 15.3 |
| Preferred activities | ||
| Walk or sport | 81 | 26.4 |
| Walk the dog | 36 | 11.7 |
| Babysitting | 52 | 16.9 |
| Trip with family and friends | 61 | 19.9 |
| Recreation | 77 | 25.1 |
| Combinations of plants | ||
| Grass-bushes-trees | 16 | 5.2 |
| Grass-bushes | 226 | 73.6 |
| Grass | 65 | 21.2 |
| Openness-enclosure of spaces | ||
| Open | 101 | 32.9 |
| Half-open | 201 | 65.5 |
| Closed | 5 | 1.6 |
| Size of spaces | ||
| Large | 38 | 12.4 |
| Medium | 202 | 65.8 |
| Small | 38 | 12.4 |
| Connection of spaces | ||
| High | 40 | 13.0 |
| Medium | 222 | 72.3 |
| Low | 45 | 14.7 |
4.2.2. Commuting and usage habits of the respondents
The results indicate that the respondents of Changhe Park preferred easier access and daily use of the park, with walking being the most popular mode of transportation (51.5%) and most respondents reporting a typical access time of 5–15 min (69.7%) (table 3). Additionally, the most frequent duration of visits was reported to be 1–3 h by 79.5% of the participants, with the majority of respondents visiting the park 1–3 times a week (60.9%) (table 3). The most preferred activity in the park was walking or doing sports (26.4%), followed by recreational activities (25.1%) (table 3). These findings suggest that Changhe Park is used as a place for regular physical activity and leisure time, and the easy accessibility of the park may play a significant role in its popularity among local residents.
4.2.3. Respondents' preferred landscape components
The analysis of the landscape components revealed that respondents preferred blue-green spaces that are more open, medium-sized, and with a medium degree of connection. A grass-shrub combination was the most popular plant combination among the respondents (73.6%), followed by grass (21.1%), and a grass-shrub-tree combination (5.2%) (table 3). In terms of the openness-enclosure of spaces, 65.5% of respondents preferred spaces with medium degrees of openness, whereas only 1.6% preferred closed spaces (table 3). The most preferred size of spaces was medium-sized, as indicated by 65.8% of respondents (table 3). With respect to the connection of spaces, medium connection spaces were the most preferred (71.4%), followed by low connection spaces (14.7%) and high connection spaces (13.0%) (table 3). These findings provide insight into the landscape design elements that are most likely to enhance the experience of visitors in blue-green spaces.
4.3. Comparing preference for spaces in summer and winter
Table 4 presents the results of the Mann-Whitney U test for residents' preference for spaces in summer and winter. The descriptive statistics show that most respondents (64.8%) preferred a mid-degree waterfront in summer, while 21.8% preferred a high waterfront degree, and 13.4% preferred a low waterfront degree. However, the preference for waterfronts was lower in winter than in summer. Specifically, the majority of respondents (70%) preferred a medium waterfront degree in winter, 25.4% preferred a low waterfront degree, and only 4.6% preferred a high waterfront degree. The Mann-Whitney U test results showed that the null hypothesis of no difference in preference for waterfront degree between summer and winter was rejected, indicating a statistically significant difference in the preference for waterfronts between the two seasons. This suggests that seasonality has a significant effect on residents' preference for waterfronts.
4.4. Influence factors for resident's preference for spaces in different seasons
Tables 5 and 6 present the outcomes of the Spearman's rank correlation coefficient analysis (ρ), which was conducted to examine the factors influencing the preference for spaces across different seasons. These factors include the demographic characteristics of respondents, their usage habits, and landscape design elements. In the summer season, a weak negative correlation was found between the age group and the preference for blue spaces (ρ = −0.096, p = 0.094), indicating that younger respondents preferred blue spaces more than older respondents (table 5). Regarding winter preferences, the analysis revealed that being female (ρ = −0.103, p = 0.071) and having longer stays (ρ = −0.103, p = 0.072) were negatively correlated with the preference for blue spaces (table 6). This suggests that male respondents preferred blue spaces more during the winter season, and participants with shorter stays had a higher preference for blue spaces compared to those with longer stays. However, no significant associations were observed between respondents' preferences for landscape design elements and their inclination towards blue spaces.
Table 5. Influence factors for resident's preference for spaces in summer.
| Correlation coefficient | P-Value | |
|---|---|---|
| Sex | −0.045 | 0.430 |
| Age group | −0.096 | 0.094* |
| Education | 0.043 | 0.455 |
| Monthly income per capita | 0.026 | 0.654 |
| Cost for access | −0.075 | 0.188 |
| Means of transportation | −0.062 | 0.275 |
| Frequency | 0.032 | 0.575 |
| Duration of visiting | −0.047 | 0.413 |
| Preferred activities | −0.079 | 0.166 |
| Combinations of plants | −0.021 | 0.710 |
| Openness-enclosure of spaces | 0.024 | 0.674 |
| Size of spaces | 0.007 | 0.904 |
| Connection of spaces | −0.013 | 0.814 |
Table 6. Influence factors for resident's preference for spaces in winter.
| Correlation coefficient | P-Value | |
|---|---|---|
| Sex | −0.103 | 0.071* |
| Age group | −0.012 | 0.835 |
| Education | 0.053 | 0.352 |
| Monthly income per capita | 0.093 | 0.104 |
| Cost for access | −0.003 | 0.956 |
| Means of transportation | −0.021 | 0.703 |
| Frequency | 0.085 | 0.135 |
| Duration of visiting | −0.103 | 0.072* |
| Preferred activities | 0.006 | 0.912 |
| Combinations of plants | −0.040 | 0.484 |
| Openness-enclosure of spaces | −0.019 | 0.743 |
| Size of spaces | −0.004 | 0.951 |
| Connection of spaces | −0.009 | 0.882 |
5. Discussion
This study aimed to identify residents' preferences for blue-green spaces and investigate the seasonal differences in preferences and factors influencing waterfront degree preferences. Our findings provide valuable insights into the preferences and underlying factors that contribute to the use and enjoyment of blue-green spaces. By comparing our results with previous research, we highlight the contributions of this study and identify potential areas for future investigation.
The results of our study indicated that blue spaces had a higher choice and were more globally integrated compared to green spaces, indicating the importance of visual and physical accessibility to water bodies for park users. This aligns with previous studies highlighting the importance of accessibility and walkability in blue spaces (Wolch et al 2014, Shanahan et al 2015). By applying space syntax theory, we were able to quantify the configurational attributes of blue-green spaces and their relationship with walkability (Hillier 2007, Baran et al 2008, Sharmin and Kamruzzaman 2018). These findings align with previous work that has investigated the role of spatial configuration in shaping human behavior and preferences in urban environments (Foltête and Piombini 2007, Li et al 2016, Marcus et al 2016).
The seasonal differences observed in our study have important implications for urban planning and design. The fact that preferences for blue spaces were higher in summer than in winter indicates the need for a dynamic approach in designing blue-green spaces that consider seasonal changes in users' preferences. For instance, urban planners and designers may consider enhancing the design features of blue spaces to attract more visitors during winter months when the preference for blue spaces is relatively lower. This may include providing more attractive winter activities such as ice-skating or designing spaces that offer more shelter from the cold. Moreover, the increase in the number of respondents who did not prefer to be near water from summer to winter highlights the importance of providing a diverse range of green spaces that cater to the different needs and preferences of users across different seasons. This finding is consistent with previous research that has emphasized the importance of providing a variety of green spaces that can be used and appreciated throughout the year (Kabisch et al 2015, van den Bosch and Ode Sang 2017).
Our study provides further evidence of the complexity of factors influencing preferences for blue-green spaces, which may vary based on season, age, gender, and stay duration. Our observation that residents' preference for blue spaces was higher in summer than in winter was not consistent with the results of previous research, which showed that blue space adversely affected physical activity in summer while having no impact in winter (Zhou et al 2022). We also found that the age group significantly influenced preferences for blue spaces in summer, possibly because older adults had longer activity durations and their metabolic rate was less affected by the thermal condition (Niu et al 2022). In winter, males preferred blue spaces more than females, and participants who stayed shorter preferred blue spaces. These findings expand upon previous research by illustrating the complexity of factors influencing preferences for blue-green spaces (Roberts et al 2017, Nazemi Rafi et al 2020). Notably, our study did not find a significant relationship between respondents' preference for landscape components and their preference for waterfront spaces, suggesting that other factors, such as individual experiences or cultural backgrounds, may also play a role in shaping preferences for blue-green spaces. Our study highlights the importance of considering multiple factors when designing and planning blue-green spaces that meet the needs and preferences of local residents.
This study has some limitations that suggest avenues for future research. First, the lack of detailed hierarchical abstraction of landscape elements is an area that could be addressed in future studies using more advanced spatial analysis techniques. Second, our study focused on seasons as a significant influence but did not account for other potential confounding factors, such as subtle differences in urban environmental attributes. Future research could explore these factors in more depth to gain a comprehensive understanding of how they affect landscape preferences.
In summary, this study adds to the understanding of residents' preferences for blue-green spaces by identifying seasonal differences and underlying factors. The implications of this study can inform both theoretical and practical aspects of urban park design and management. First, our application of space syntax theory to measure blue-green spaces' configurational attributes extends the existing literature on spatial configuration and user preferences. Second, by highlighting seasonal variations in user preferences, we emphasize the importance of flexible design elements and programming to maintain year-round appeal. Third, our identification of demographic factors influencing preferences for blue-green spaces offers insights for targeted park design and programming to cater to diverse user groups, enhancing overall park experience and inclusivity. Lastly, our study underlines the need for further research to address its limitations and explore additional influencing factors, such as socio-economic status and cultural background.
6. Conclusion
This study investigated seasonal preferences for blue-green spaces, with a specific focus on the waterfront degree in Changhe Park, Dezhou City, China. By employing space syntax theory to measure configurational attributes of blue-green spaces and utilizing a questionnaire survey to investigate residents' preferences, we were able to identify critical factors influencing the seasonal preferences for urban blue-green spaces. The findings revealed that blue spaces were preferred over green spaces, and waterfront preferences were significantly impacted by season. Furthermore, the age group was found to be the sole decisive factor for blue space preference in summer, while sex and time spent in the park contributed to winter preferences. These results contribute to the understanding of seasonal preferences for urban blue-green spaces and can inform planning and design strategies that target specific demographic groups or adjust waterfront features to enhance year-round appeal. Despite the valuable insights provided by this study, it is recommended that future research consider additional influential factors, including individual experiences and cultural backgrounds. Further, the implementation of alternative methodologies, such as Landscape Visual Impact Assessment (LVIA), could augment understanding of the impact of seasonality on urban park users' preferences. Overall, this study underscores the importance of understanding residents' preferences for blue-green spaces and considering seasonal changes when planning and designing urban landscapes to create more resilient and attractive urban environments that cater to the diverse needs and preferences of the public.
Acknowledgments
The author would like to express deep gratitude to the reviewers whose insightful comments and suggestions significantly improved the quality of the manuscript. The effort and dedication of the editor throughout the process are greatly appreciated. A special note of thanks to WDY for assistance in collating the survey results, to those who participated in the survey, and to the park management for their cooperation. The author also wishes to acknowledge the Dezhou Architectural Planning and Design Institute for providing comprehensive information about the park's layout, features, and amenities, which proved invaluable to the study.
Data availability statement
The data cannot be made publicly available upon publication because no suitable repository exists for hosting data in this field of study. The data that support the findings of this study are available upon reasonable request from the authors.
Funding information
This study did not receive any specific grant from funding agencies in the public, commercial, or not-for-profit sectors.
Authors' contributions
This paper was written by the sole author who designed and conducted the research, analyzed the data, and drafted the manuscript.
Declaration of interest statement
The author declares that there are no conflicts of interest.