

Abstract
In this study, the wind and solar energy resources over China are projected during 2031–2060 under the Representative Concentration Pathway (RCP) 8.5 scenario with the Weather Research and Forecasting (WRF) model and Regional Climate Model version 4 (RegCM4). The bias correction method based on probability distribution is applied to correct the simulated 100-m wind speed and surface down-welling shortwave radiation. The results show that the bias correction method can remarkably improve the skill of the individual simulations and the ensemble mean in capturing the features of wind speed and shortwave radiation from the aspects of spatial distribution, annual cycle, quantile distribution, probability distribution and cumulative probability distribution. The future projections from the bias-corrected ensemble show that both the wind and solar energy resources are abundant over northwestern China, with higher wind power density reaching up to 130 W m−2 in winter and richer surface down-welling shortwave radiation above 240 W m−2 in summer. Generally, the wind and solar energy resources will decrease in the future, by around 6% over the western regions and 4% over southeastern China in winter, respectively. The interannual variability of the two resources is projected to increase over most areas of northern China, indicating a decrease in the stability of resources, while tends to decrease over Southeastern China.
Export citation and abstract BibTeX RIS

Original content from this work may be used under the terms of the Creative Commons Attribution 4.0 licence. Any further distribution of this work must maintain attribution to the author(s) and the title of the work, journal citation and DOI.
1. Introduction
In order to deal with global warming, it has become popular to develop and utilize renewable energy resources all over the world, such as wind energy resource and solar energy resource (Alessandrini and McCandless 2020, Akinsanola et al 2021). Due to their vulnerability to topography and climatic conditions, wind and solar energy resources have certain limitations when used individually, while the hybrid power generation technology can make up for the defects. Over China, the wind and solar energy resources are temporally complementary, with strong Sunlight and low wind speed during the day and summer while weak Sunlight and high wind speed at night and in winter (Li et al 2022). With the development of combined power generation technology, it is necessary to understand the future changes of wind-solar resources before utilization.
Specifically for wind and solar energy resources, the capacity factor (CF) can be used as an indicator to measure the potential power generation capacity. The CF is expressed as the ratio of output power to rated power or full-load operation time of a power generation system (Li et al 2020, Qiu et al 2022). Bett and Thornton (2016) used ERA-Interim reanalysis to investigate the CF in Britain, indicating a weak anticorrelation between the wind and solar resources throughout the year. The magnitude of CF for wind energy resource deeply depends on wind speed. Wind energy resource over China has also been analyzed in several works (Li et al 2020). Gao et al (2019) pointed out that wind resource is abundant over northern China, which is richest in spring among the four seasons.
For solar energy resource, the magnitude of CF depends on surface down-welling shortwave radiation. Surface down-welling shortwave radiation over China decreases from Northwest to Southeast (Hou et al 2020), and features a decrease during 1960–1990, followed by a recovery trend since 1990 s (Xia 2010). By using ERA5 reanalysis, Qiu et al (2022) revealed that high CF of solar energy resource is mainly distributed over Northwest China.
In the future, changes in wind speed, temperature and shortwave radiation will affect the output power of wind and solar power plants. Using global climate models (GCMs) from Coupled Model Intercomparison Project Phase 6 (CMIP6), Wu et al (2020) found that surface wind speed is projected to decrease in most parts of China. Compared with GCMs, regional climate models (RCMs), having higher resolution, can provide better representation for wind energy resource (Hueging et al 2013). The World Climate Research Program (WCRP) established the Coordinated Regional Downscaling Experiment (CORDEX, http://cordex.org/), which produces coordinated sets of regional downscaled projections worldwide (Giorgi et al 2009). Using the RCMs within the CORDEX framework, Sawadogo et al (2021) and Schlott et al (2018) carried out the future projections of renewable energy (including wind and solar resources) over Africa and Europe, respectively. Currently, the East Asian branch of CORDEX initiative (CORDEX-EA) has advanced the second phase (CORDEX-EA-II), with higher horizontal resolution than the first phase (CORDEX-EA-I; Yu et al 2020). Previous studies have investigated the future renewable energy resource over CORDEX-East Asia (Gao et al 2019, Chen et al 2022, Sherman et al 2021, Wu et al 2022). Wu et al (2021) predicted future changes in wind energy potential, demonstrating a decrease over most areas of China.
Several studies investigated future changes in shortwave radiation and solar energy resource over China (Zhao et al 2020, Lu et al 2022, Perez et al 2019). Using GCMs, Yang (2018) and Xiao (2019) projected a decrease in solar energy over western China and an increase over southeastern China. By using multiple RCMs within CORDEX-EA-II, Park et al (2022) projected the solar energy resource and surface down-welling shortwave radiation over East Asia to decrease under the Representative Concentration Pathway (RCP) 8.5 scenario. Wu et al (2022) pointed out that the solar energy was projected to decrease consistently over China under the RCP 4.5 and RCP 8.5 scenarios.
Generally, RCMs show systematic biases due to the imperfect physical parameterization, unpredictable natural variabilities and biases inherited from driving fields (Teutschbein and Seibert 2012, Li et al 2019). Previous studies have found that the RCM simulations under the CORDEX-EA framework overestimate the wind speed and shortwave radiation over China (Gao et al 2019, Li et al 2020, Hui et al 2019). To reduce the systematic biases of RCMs, bias correction techniques are recommended (Teutschbein and Seibert 2012). It has been confirmed that the bias correction methods can improve the performances of RCMs in reproducing precipitation, temperature and extreme events (Piani et al 2010, Dosio and Paruolo 2011). Moemken et al (2018) and Tobin et al (2015) investigated future change of wind energy resource over Europe with Weibull distribution-based quantile mapping and cumulative distribution function transform (CDF-t), respectively, and both of them projected a small change of wind energy output in future decades. Although previous works have projected wind energy resource based on bias correction over many regions, limited studies are conducted over China. Li et al (2019) compared the skills of different bias correction methods in correcting the simulated wind speed over CORDEX-East Asia, indicating that the quantile mapping based on Weibull distribution performs best among all the methods. For solar energy resource, rare efforts are made to apply bias correction method to correct simulated shortwave radiation over China.
Under the CORDEX-EA-II framework, limited studies have used multi-RCM simulations downscaled from multi-GCM to perform hybrid analysis of wind and solar energy resources. Additionally, whether bias correction method can correct simulated shortwave radiation still needs further research. In this study, we first evaluate the skill of the bias correction method based on probability distribution function in correcting simulated 100-m wind speed and surface down-welling shortwave radiation. Then, the future features of wind and solar energy resources are investigated over China during 2031–2060 under RCP 8.5 scenario. The rest of the paper is organized as follows. Section 2 describes the models, data and methodology. Section 3 demonstrates the evaluation of bias correction method and the future projections of wind and solar energy resources. Conclusions are given in section 4.
2. Models, data and methodology
2.1. Models and experimental design
In this study, WRF (V3.6.1; Skamarock et al 2008) and RegCM4 (Giorgi et al 2012) are utilized to conduct historical simulations and future projections under the CORDEX-EA-II framework. Developed by the U.S. National Center for Atmospheric Research (NCAR), WRF is a non-hydrostatic model using a terrain-following vertical coordinate and an Arakawa-C grid. The RegCM4 model is developed by International Centre for Theoretical Physics (ICTP), and adopts a terrain-following σ-pressure vertical coordinate system and an Arakawa-B grid finite differencing algorithm. The outputs of four global climate models (GCMs) from the Coupled Model Intercomparison Project Phase 5 (CMIP5; Taylor et al 2012), that is, CNRM-CM5 (Voldoire et al 2013), GFDL-ESM2M (Dunne et al 2012), EC-EARTH (Hazeleger et al 2010) and MPI-ESM-LR (Jungclaus et al 2010), are applied as the initial and boundary conditions for the downscaling simulations with WRF and RegCM4.
The detailed physical schemes used in the RCM simulations, including land surface, radiation, convection, microphysics and planetary boundary layer (PBL) schemes, are shown in table 1. The historical experiments are conducted during the period of 1981–2005, and the future projections are carried out during 2031–2060 under the RCP 8.5 scenario. All the RCM simulations provide the variables of 10-m wind speed, surface down-welling shortwave radiation and air temperature over China, with a spatial resolution at 0.22°. The simulated 10-m wind speed has been extrapolated to the wind-turbine hub height of 100 m.
Table 1. Model configurations.
| WRF | RegCM4 | |
|---|---|---|
| Dynamic framework | Non-hydrostatic | Hydrostatic |
| Initial and boundary conditions | CNRM-CM5 (Voldoire et al 2013), | CNRM-CM5 (Voldoire et al 2013), |
| EC-EARTH (Hazeleger et al 2010), | EC-EARTH (Hazeleger et al 2010), | |
| GFDL-ESM2M (Dunne et al 2012), | GFDL-ESM2M (Dunne et al 2012), | |
| MPI-ESM-LR (Jungclaus et al 2010) | MPI-ESM-LR (Jungclaus et al 2010) | |
| Land surface | NOAH (Chen and Dudhia 2001) | CLM3.5 (Oleson et al 2008) |
| Radiation | CAM (Collins et al 2004) | CCM3 (Kiehl et al 1998) |
| Convection | Kain–Fritsch (Kain 2004) | MIT-Emanuel (Emanuel 1991) |
| Microphysics | WSM5 (Hong et al 2004) | SUBEX (Pal et al 2000) |
| PBL scheme | YSU (Hong et al 2006) | Holtslag (Holtslag et al 1990) |
| Historical period | 1981–2005 | |
| Future period | 2031–2060 |
2.2. Reference data
The fifth generation of atmospheric reanalysis (ERA5) released by European Centre for Medium-Range Weather Forecasts (ECMWF) is used to calibrate the simulated data and validate the skill of the bias correction method. The spatial and temporal resolution of the ERA5 reanalysis is 0.25° and 3-hourly, respectively. The 100-m wind speed and surface down-welling shortwave radiation data from the ERA5 reanalysis has been proved reliable in the previous studies (Liu et al 2021, He et al 2021). Several studies pointed out that reanalysis datasets exhibit deviation in wind speed and shortwave radiation (Kennedy et al 2011; Fan et al 2021), while ERA5 can reduces the biases compared with other reanalysis (Fan et al 2021; He et al 2021). The station observations sometimes can be inhomogeneous and inaccurate because of anthropic factor and instrument failure, while ERA5 can supply dynamically gridded data, particularly for areas without observations. Thus, ERA5 is selected as reference dataset. The data from ERA5 reanalysis during 1981–1995 and 1996–2005 is utilized to correct the raw simulated data and to verify the bias correction method, respectively. The raw simulated data is interpolated to 0.25° × 0.25° grids for easy calibration and validation, by using simple inverse distance squared weighting.
2.3. Bias correction method
The bias correction method of quantile mapping based on probability distribution function is applied in this study, assuming that the observational and simulated probability distributions are consistent with each other for a given month during the calibration period. Weibull distribution and normal distribution are adopted for the distribution approximation of 100-m wind speed and surface down-welling shortwave radiation, respectively. The bias correction method is implemented for daily data at each grid point individually:
where 
 and
and  represent the bias-corrected data during the calibration period (1981–1995), validation period (1996–2005) and future period (2031–2060), respectively, and
 and
and  are the raw simulated data.
  and
and  are calculated during the calibration period, and indicate the cumulative distribution function of raw simulated data and the inverse cumulative distribution function of observation data, respectively. For 100-m wind speed, Weibull distribution is adopted as the cumulative distribution function:
where k and c are shape parameter and scale parameter, respectively, and w represents wind speed. For shortwave radiation, the cumulative distribution function is expressed as normal distribution:
where  and
and  are mathematical expectation and standard deviation, respectively. The parameters, k and c in Weibull distribution and
  and
and  in normal distribution, are calculated for each grid in a given month to correct the seasonal biases.
2.4. Wind power density and capacity factor of wind energy resource
Wind power density (WPD) and capacity factor (CF) are employed to quantitatively measure the wind energy resource. Both of them are calculated based on the wind speed at 100 m, which can be extrapolated from 10-m wind speed according to an empirical power law (Gao et al 2019):

where w and W represent the wind speed at 10 m and 100 m, respectively, and  is the wind shear exponent, which is equal to
Wind power density is defined as (Pryor & Barthelmie 2010)

where  is the air density at 100 m and equal to 1.213 kg m−3.
As in Li et al (2020), the capacity factor of wind energy resource is expressed as the ratio of output power to rated power:

where  is output power, and
  is rated power, which is taken as 3000 kw.
2.5. Capacity factor of solar energy resource
The capacity factor of solar energy resource is calculated as follows (Bett and Thornton 2016).
where  = 800 W m−2,
  = 48 °C and
  = 20 °C.
  and
and  are reference values for surface down-welling shortwave radiation and ambient temperature.
  and T represent module temperature and ambient air temperature, respectively, and G is surface down-welling shortwave radiation.

where  = 4.2 × 10⁻³ K−1,
  = −4.6 × 10⁻³ K−1,
  = 0.033 and
  = −0.0092.
  and
and  are air temperature and shortwave radiation under standard test conditions, and equal to 25 °C and 1000 W m−2, respectively.
  is relative efficiency.
Then, the capacity factor of solar energy resource is
2.6. Robust coefficient of variation
The variability at different temporal scales can reflect the variation amplitude and change rate of renewable resources (Gao et al 2019). In this study, the robust coefficient of variation (RCoV) is used to measure the variability of wind and solar energy resources. It is defined as
where  represents wind power density or surface down-welling shortwave radiation. The annual mean, monthly mean and daily mean time series are utilized to calculate the interannual, intra-annual and interdiurnal variability, respectively (Li et al
2020).
represents wind power density or surface down-welling shortwave radiation. The annual mean, monthly mean and daily mean time series are utilized to calculate the interannual, intra-annual and interdiurnal variability, respectively (Li et al
2020).
3. Results
3.1. Added value of the bias correction method
Figure 1 shows the bias of annual mean 100-m wind speed in the RCM simulations during the validation period before and after using the bias correction method. Without bias correction, the WRF and RegCM4 simulations driven by four GCMs all generate evident overestimation of wind speed, with little discrepancy among different driven fields. The WRF simulations exhibit great overestimation over southeastern China and northern China, with the bias around 2 m s−1 and 1 m s−1 respectively (figures 1(a)–(d)). The four RegCM4 simulations generate less bias (almost below 2 m s−1) than WRF over southeastern China (figures 1(e)–(h)). By applying bias correction, all the RCM simulations show remarkable improvement in capturing the annual mean wind speed over whole China, with the negligible bias within ±0.5 m s−1.
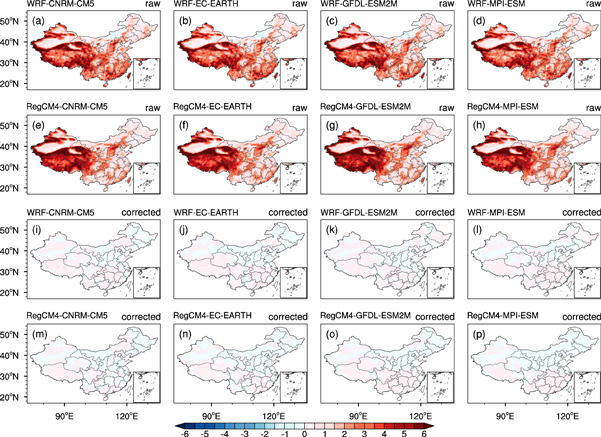
Figure 1. The differences of annual mean 100-m wind speed between the RCMs and the ERA5 reanalysis during the validation period of 1996–2005 before (a)–(h) and after (i)–(p) using the bias correction method (unit: m/s).
Download figure:
Standard image High-resolution imageThe bias of surface down-welling shortwave radiation in the raw and bias-corrected simulations is illustrated in figure S1. Without bias correction, the four WRF simulations consistently overestimate the shortwave radiation, with the bias up to 80 W m−2 over southeastern China and within 20–60 W m−2 in other regions (figures S1(a)–(d)). The raw RegCM4 simulations underestimate the shortwave radiation over northern China, with the negative bias ranging from −80 W m−2 to −20 W m−2. Overestimation below 60 W m−2 is located over southeastern China (figures S1(e)–(h)). Generally, the bias-corrected shortwave radiation demonstrates slight bias within ±20 W m−2 over whole China, and positive bias is mainly located in the western areas and negative bias in the eastern areas (figures S1(i)–(p)).
To comprehensively evaluate the RCMs' skill in capturing the wind speed features, various statistical approaches are adopted, including annual cycle, quantile-quantile plot (Q-Q), probability distribution function (PDF), cumulative distribution function (CDF) and Taylor diagram (figure 2). The raw RCM simulations demonstrate remarkable deficiency in simulating the annual cycle of domain-averaged wind speed, with greater bias in winter than in summer. Specifically, the bias in RegCM4 is about 1.5 m s−1 in summer, while reaches up to 3.5 m s−1 in winter. In addition, almost all RCM simulations prepone the wind speed peak for one month, which occurs in April in the observation (figure 2(a)). The Taylor diagram is further applied to depict the consistency of monthly mean wind speed between the RCMs and observation. The raw RCM simulations can well capture the characteristics of intra-annual variation, with the temporal correlation coefficients (TCCs) above 0.55. However, both WRF and RegCM4 tend to enlarge the variation amplitude, with the ratios of standard deviation around 1.5 and 2.5, respectively (figure 2(e)). The Q-Q plot indicates overestimation at all quantiles in the raw simulated data. Comparing the two RCMs, it is found that the RegCM4 simulations generate smaller bias than WRF for lower quantiles and greater bias for higher quantiles (figure 2(b)). The raw RCM simulations tend to shift the spectrums of both PDF and CDF rightward. For CDF, the deviation of the raw simulations from the observation gets smaller for higher wind speed. It means that the raw simulations underestimate the frequency of lower wind speed and overestimate that of higher wind speed (figures 2(c)–(d)). After bias correction, the simulated data can properly portray the annual cycle, intra-annual variability, quantile distribution, PDF and CDF of wind speed, with the bias-corrected result almostly overlapping with the observation.
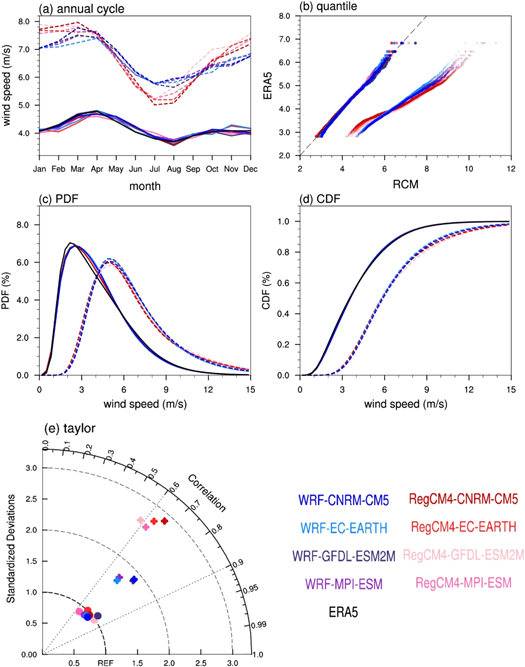
Figure 2. The annual cycle (a), quantile-quantile plot (b), probability distribution function (c), cumulative distribution function (d) and Taylor diagram (e) of 100-m wind speed from the RCM simulations during the validation period before and after bias correction. The dotted lines in (a), (c) and (d) and the plus signs in (b), (e) represent the result without correction, and the solid lines and filled circles indicate the bias-corrected result. Domain-averaged monthly data are used in (a) and (e), and daily values at each grid point are used in (b), (c) and (d).
Download figure:
Standard image High-resolution imageFigure S2 shows the statistical results for surface down-welling shortwave radiation. The ERA5 reanalysis exhibits a unimodal pattern of annual cycle, with the peak around 260 W m−2 in May. The raw WRF and RegCM4 simulations overestimate and underestimate the domain-averaged shortwave radiation respectively, especially in late spring and summer. Specifically, the positive bias in WRF can reach up to 80 W m−2 in June and negative bias in RegCM4 are around −50 W m−2 in May. What's more, WRF and RegCM4 postpone the radiation peak for one and two months, respectively (figure S2(a)). The Taylor diagram shows that the raw WRF and RegCM4 simulations can successfully produce the intra-annual variation characteristics, with the TCCs above 0.9. However, WRF and RegCM4 enlarge and lessen the intra-annual variability respectively (figure S2(e)). As shown in figure S2(b), all the quantiles of daily shortwave radiation are overestimated in the raw WRF simulations and underestimated in RegCM4 (figure S2(b)). The PDF in the ERA5 reanalysis demonstrates a bimodal pattern with the major frequency peak at around 180 W m−2 and a secondary peak at around 240 W m−2. The raw WRF simulations can generally capture the bimodal pattern, but shift the spectrum rightward. The RegCM4 simulations falsely produce a unimodal pattern of radiation PDF, and shift the spectrum leftward. As a result, the CDF spectrum is also rightward and leftward shifted in the WRF and RegCM4 simulations respectively (figures S2(c), (d)). As expected, the deviation between RCMs and ERA5 can be greatly corrected after using the bias correction method, and the bias-corrected data exhibits great consistency with the ERA5 reanalysis from the aspects of annual cycle, intra-annual variability, quantile distribution, PDF and CDF.
The bias correction method has been proved to be effective in correcting individual RCM simulations. Furthermore, the applicability of the bias correction method for the multi-model ensemble mean is investigated by using several metrics, including mean absolute error (MAE), root-mean-square error (RMSE) and TCC. Figure 3 displays the spatial distributions of MAE, RMSE and TCC of monthly mean 100-m wind speed and surface down-welling shortwave radiation in both raw and bias-corrected ensemble mean. The MAE and RMSE of raw simulated wind speed are around 2 m s−1 over most parts of China (figures 3(a), (b)), while the bias correction brings obvious improvement to the monthly mean wind, with the MAE and RMSE below 0.5 m s−1 (figures 3(d), (e)). The TCCs of wind speed are below 0.3 over southeastern China and some northwestern areas in the raw simulation, which increase to around 0.5 in the bias-corrected result (figures 3(c), (f)). In terms of surface down-welling shortwave radiation, the raw simulation exhibits distinct bias over southeastern China, with the MAE and RMSE up to 70 W m−2 (figures 3(g), (h)). By comparison, the MAE and RMSE in bias-corrected ensemble are just within 20 W m−2 (figures 3(j), (k)). Both the raw and bias-corrected simulations successfully produce the intra-annual variation of monthly mean radiation, with the TCC above 0.8 over most parts of China, and the bias-corrected result improves the TCC over the southern coastal regions (figures 3(i), (l)).
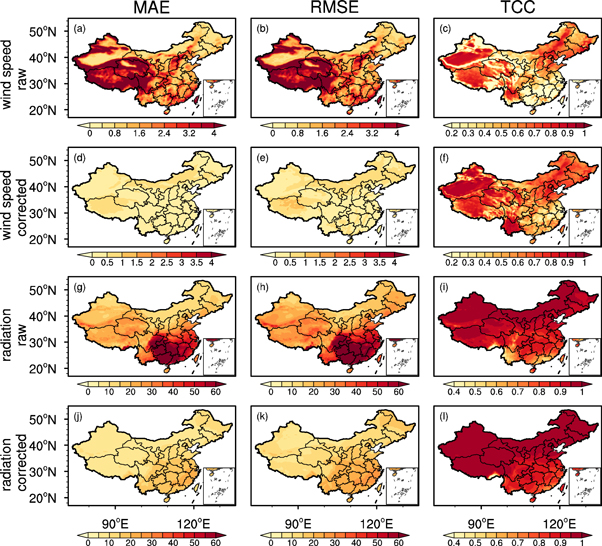
Figure 3. The mean absolute error, root-mean-square error and temporal correlation coefficient of monthly mean 100-m wind speed (a)–(f) and surface down-welling shortwave radiation (g)–(l) in the raw (a)–(c), (g)–(i) and bias-corrected (d)–(f), (j)–(l) ensemble mean. The unit in (a), (b), (d) and (e) is m/s; the unit in (g), (h), (j) and (k) is W/m2.
Download figure:
Standard image High-resolution image3.2. Future projections of wind and solar energy resources
A clear understanding of future change is vital for exploiting renewable energy. For its satisfactory performance, the bias-corrected ensemble mean is adopted to provide projections of wind and solar energy resources during 2031–2060 under the RCP 8.5 emission scenario. Figure S3 illustrates the relative changes in the seasonal mean 100-m wind speed and surface down-welling shortwave radiation between 2031–2060 and 1981–2005 from the bias-corrected data. The wind speed is projected to decrease in four seasons in the ensemble mean and seven out of the eight individual RCM simulations. The multi-model ensemble projects a relative change of about −2% in spring and around −1% in other seasons. Generally, the RegCM4 simulation downscaled from GFDL-ESM2M shows obvious inconsistence with the other simulations, with a relative decrease of −5% in spring and a increase of 1.5% in autumn (figure S3(a)). The shortwave radiation in the four seasons also tends to decrease in the multi-model ensemble mean and at least six individual simulations, with the relative changes ranging from −2% in autumn to −0.5% in spring in ensemble mean. The RegCM4 simulation driven by GFDL-ESM2M also shows disagreement with the other simulations, with a intensive decrease of −6% in autumn and a increase of 2% in spring and winter (figure S3(b)).
Future projections of annual and seasonal mean wind power density and surface down-welling shortwave radiation from the bias-corrected ensemble mean are shown in figure S4. In the future, the wind energy resource is abundant over northwestern and northeastern China, with the annual mean WPD around 100 W m−2(figure S4(a)). Over southeastern China, the annual and seasonal mean WPD is just around 30 W m−2. Moreover, more plentiful wind energy is found in winter than in summer (figures S4(b), (c)). The WPD is projected to decrease over most areas of China, with the relative changes around −6% over the western regions, while the summer and winter WPD will slightly increase (within 4%) over Southeast China (figures S4(d)–(f)).
The surface down-welling shortwave radiation demonstrates an increasing gradient from southeast to northwest, with the strongest radiation over the Tibetan Plateau (figures S4(g)–(i)). Unlike wind energy, the future solar energy resource is much richer in summer than in winter. For example, the shortwave radiation over Southeast China can be above 180 W m−2 in summer while only around 100 W m−2 in winter (figures S4(h), (i)). The annual mean shortwave radiation is generally projected to decrease, with the relative changes ranging from −2% to 0% (figure S4(j)). Over southeastern China, the shortwave radiation is projected to decrease (around 4%) and increase (within 2%) in winter and summer, respectively (figures S4(k), (l)).
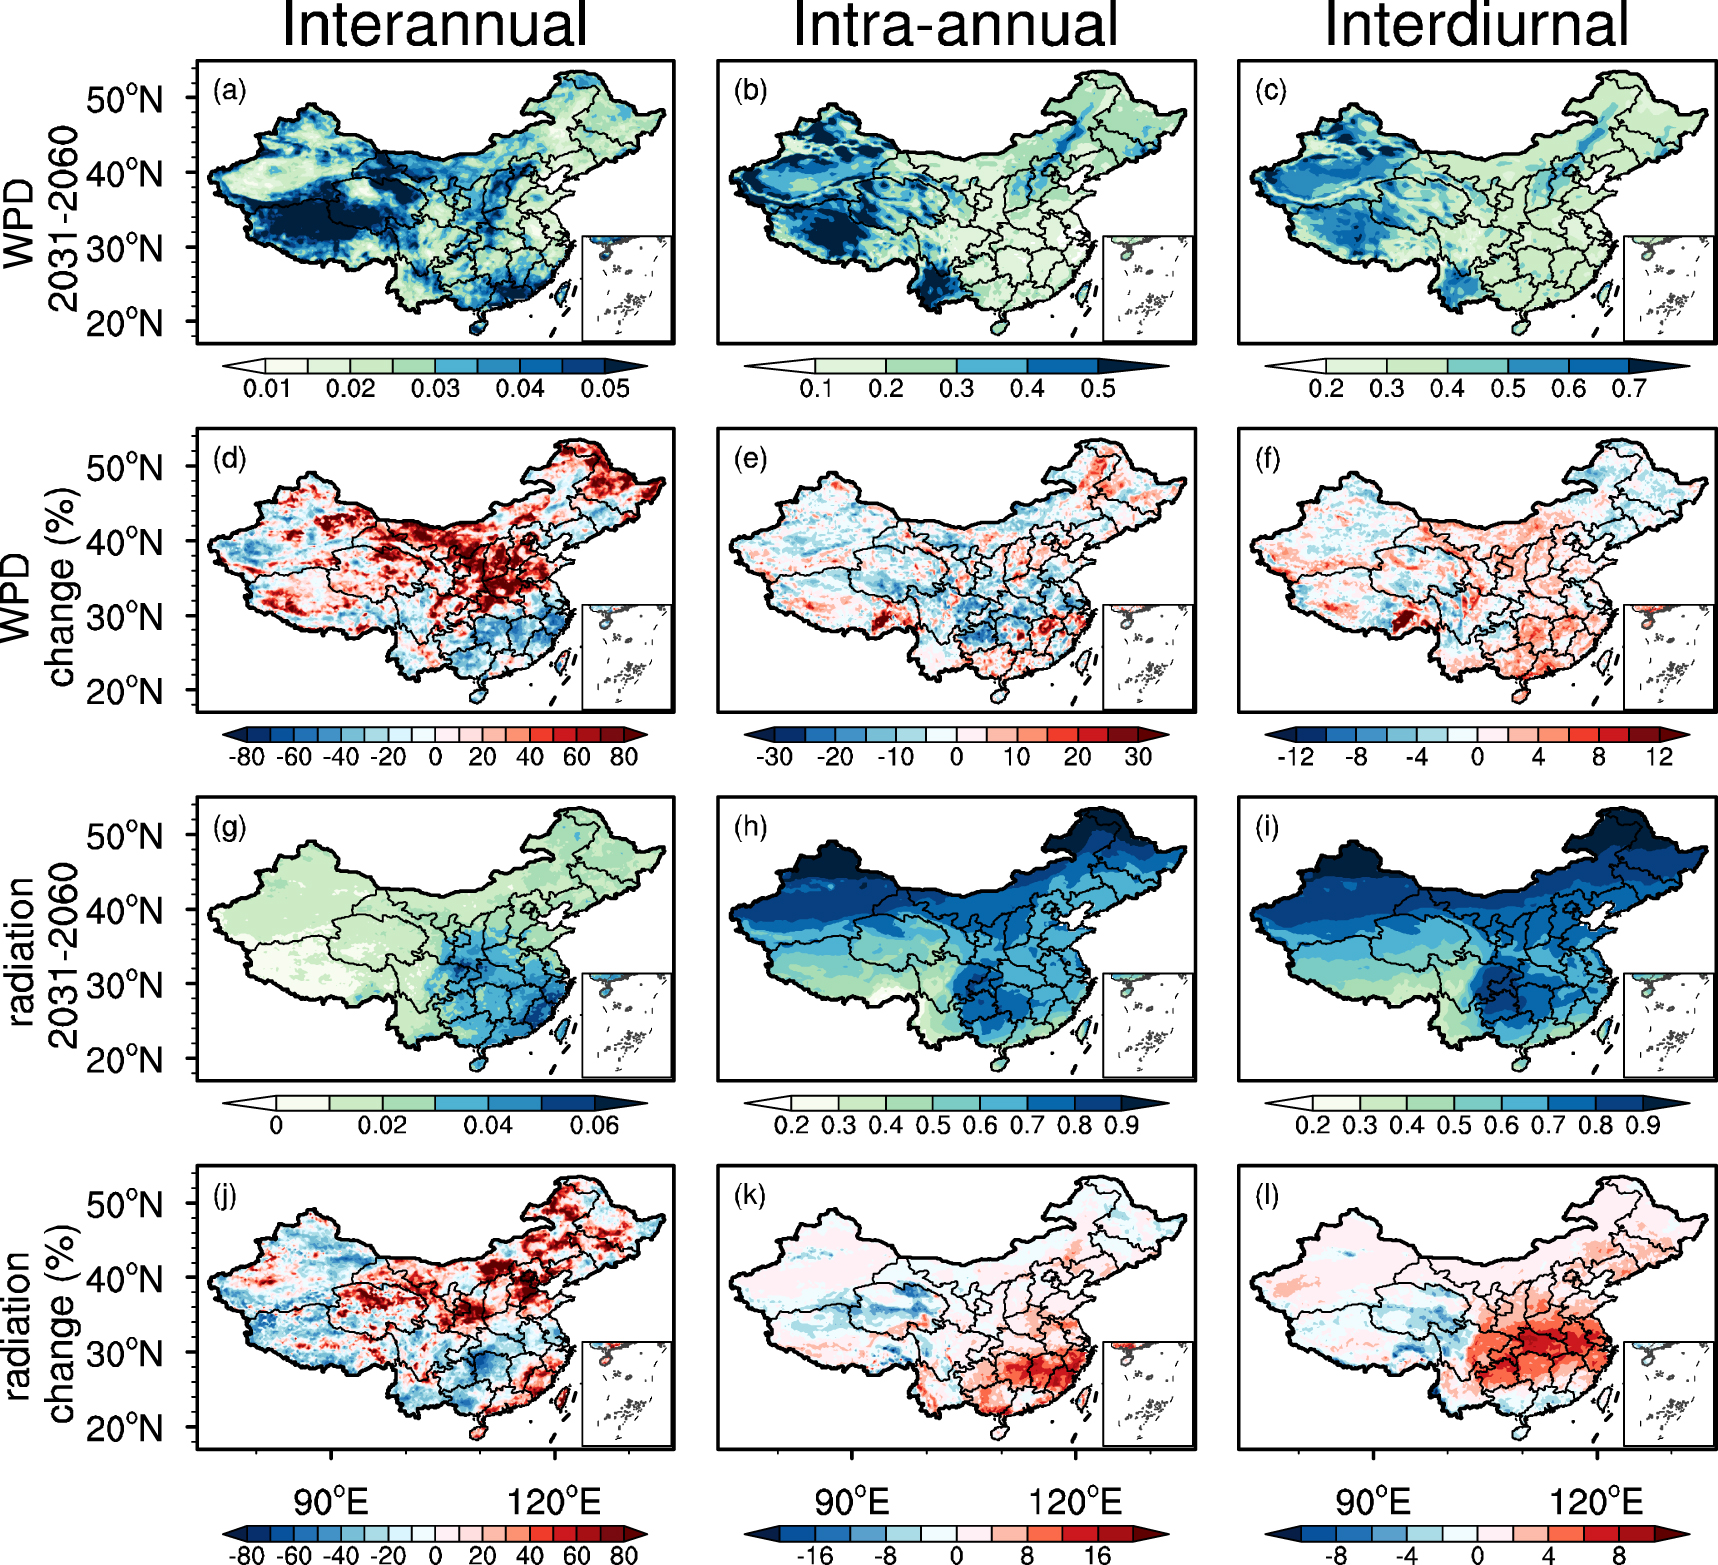
The variability of energy at multiple temporal scales plays an important role for the implement of power plants. Thus, the RCoV is used to quantify the interannual, intra-annual and interdiurnal variability of WPD and surface down-welling shortwave radiation (figure 4). The future WPD exhibits more pronounced interdiurnal variability than interannual and intra-annual variability (figures 4(a)–(c)). The interannual RCoV is generally less than 0.05, with large value over the Tibetan Plateau, Inner Mongolia and Guangdong (figure 4(a)). The intra-annual and interdiurnal RCoV demonstrates large value over Northwest China, which can reach up to 0.5 (figures 4(b), (c)). The interannual variability of WPD tends to increase by about 50% over northern China, while decrease by around 40% over Southeast China (figure 4(d)). The intra-annual and interdiurnal variability generally features an irregular pattern of decrease and increase respectively, with the relative changes mostly within ±10% (figures 4(e), (f)).

Figure 4. The interannual, intra-annual and interdiurnal robust coefficient of variation (RCoV) of wind power density (a)–(c) and surface down-welling shortwave radiation (g)–(i) during 2031–2060 from the multi-model ensemble, and their relative changes between the future projections and the historical runs (d)–(f), wind power density; (j)–(l), shortwave radiation).
Download figure:
Standard image High-resolution imageThe surface down-welling shortwave radiation in the future shows larger interannual variability over southeastern China than northern China, with the RCoV around 0.04 and 0.02, respectively (figure 4(g)). The RCoV of intra-annual and interdiurnal variability demonstrates large value above 0.6 over some areas of China (figures 4(h), (i)). The interannual variability of shortwave radiation shows increase of around 40% over northern China and southeastern coastal areas, while decrease of around 30% over Northwest China and interior Southeast (figure 4(j)). The intra-annual and interdiurnal variability tends to increase over most areas of China, with the relative changes over Southeast China up to 8% and 6%, respectively (figures 4(k), (l)).
The above analysis reveals that the variability of both wind power density and shortwave radiation is more pronounced at short-term scales, while the long-term variability would experience more dramatic change in the future. This conclusion coincides with the characteristics of wind speed and WPD variability in Li et al (2020).
Figure 5 shows the future projections of CF for wind and solar energy resources to quantitatively assess the capacity of the resources. The projected annual and seasonal mean CF of wind energy resource demonstrates similar pattern with that of WPD (figures 5(a)–(c)). Abundant wind resource is located over Northeast and Northwest China, and the CF is higher in winter than summer, with the winter CF above 0.3 in some areas of Northeast China (figure 5(c)). Generally, the CF of wind energy resource is projected to decrease (around −5%) over most areas of China, except for southeastern China (figures 5(d)–(f)). The CF of solar energy resource exhibits similar spatio-temporal features to that of surface down-welling shortwave radiation, with high value over Northwest China (figures 5(g)–(i)). In addition, it indicates higher CF in summer than in winter (figure 5(h)). Overall, the annual and seasonal mean CF of solar energy resource will experience reduction over most areas of China, with the greatest negative change up to −5% over southeastern China in winter (figures 5(j)–(l)).

Figure 5. The future projections of annual, summer and winter mean capacity factor of wind energy resource (a)–(c) and solar energy resource (g)–(i) during 2031–2060 from the bias-corrected ensemble mean, and the relative changes in capacity factor of wind energy resource (d)–(f) and solar energy resource (j)–(l) between the future projections (2031–2060) and the historical runs (1981–2005).
Download figure:
Standard image High-resolution image
Gobiet et al (2015) argued that the bias correction can bring improvement in predictions of climate change. To exhibit the role of bias correction, figure S5 shows future projections and relative changes of RCoV from the raw ensemble mean. Predicted results of RCoV are comparable before and after bias correction, while the RCoV of solar energy in Sichuan Basin from bias-corrected data is larger than raw data (figure 4; figure S5). Before and after bias correction, spatial patterns and relative changes of future resources are generally similar to each other (figure 5; figure S6). However, projections of renewable resources from raw data are richer than the bias-corrected data, especially for wind energy resource, and bias correction tends to intensify the change signals.
4. Conclusions
Future projections of wind and solar energy resources over China during 2031–2060 under the RCP 8.5 scenario are conducted using the WRF and RegCM4 simulations under CORDEX-EA-II. Since the RCMs exhibit systematic biases, the bias correction method of quantile mapping is used, and shows great capability to correct the simulated 100-m wind speed and surface down-welling shortwave radiation from individual RCM simulations and multi-model ensemble mean.
From the bias-corrected ensemble, both of wind and solar energy resources are projected to be richer over northwestern China than over southeastern China, while the two resources have different seasonal variations, with abundant wind energy in winter and plentiful solar energy in summer. The difference between the seasonal variations sets the stage for the wind-solar complementary combined power generation. Generally, wind and solar energy resource will decrease in the future, which coincides with the previous findings (Gao et al 2019, Li et al 2020, Park et al 2022), and exhibit increasing interannual variability over northern China. The abundant resources over northern China forebode great economic benefit from the combined power generation system, while the increase of interannual variability indicates a decrease in the stability of resources.
This study provides projections of wind and solar energy resources over China, while some limitations still exist. First of all, the actual emission scenario in the future has great uncertainty, while the projections are only conducted under the RCP 8.5 emission scenario. Further efforts should be made to investigate the distribution and change of the resources under different emission scenarios, such as RCP 2.6 or RCP 4.5 scenario. Our results found that both the wind and solar energy resources are abundant over northwestern China, while the site selection and exploitation of renewable energy focus on local details, rather than regional scale. From a power system perspective, spatial resolution of 25 km and 3-hour temporal resolution is relatively coarse. Therefore, higher spatio-temporal resolution is needed for better utilization of renewable energy. Last but not least, the mechanisms for the response of wind and solar energy resources to climate change still remain unknown, which need to be further studied.
Acknowledgments
The National Key Research and Development Program of China (2018YFA0606003) and the Special Key Program of Technology Innovation and the Second Tibetan Plateau Scientific Expedition and Research Program (STEP, Grant 2019QZKK0206) jointly fund this work. The authors thank the European Centre for Medium-Range Weather Forecasts (ECMWF) for providing the ERA5 reanalysis data used as a reference dataset.
Data availability statement
All data that support the findings of this study are included within the article (and any supplementary files).
CRediT authorship contribution statement
Tongxin Li: Data curation (lead); formal analysis (lead); writing - original draft (equal). Pinhong Hui: Writing - original draft (equal); Writing - review & editing (equal). Jianping Tang: Conceptualization (lead); resources (lead); Writing - review & editing (equal). Juan Fang: Writing - review & editing (equal).
Supplementary data (5.1 MB DOCX)