


Abstract
A field campaign has been performed in the Madrid region to study the VOC influence in the growth of new particles in ambient air. A number of instruments have been deployed to characterize the main pollutant gases and particle properties and composition. The measurements were performed simultaneously at three sites (rural, urban background and urban traffic influenced) in the period 1–17 July 2019. The sites: Tres Cantos (rural), CIEMAT (urban background) and Leganés (urban traffic) were located within the Madrid airshed. Particle size distributions, mass concentrations at fractions PM10, PM2.5 and PM1, black carbon, VOCs species and gaseous pollutants (NOx and O3) were obtained in the sites. Some supplementary measurements were obtained in at least one of the sites: meteorological parameters, non-refractory submicron aerosol species and vertical profiles of aerosol optical properties. It has been observed that the new particle formation (NPF) events, nucleation and subsequent growth, happened at a regional scale, although differently among the sites. In the rural site, fewer events than expected were observed because of the high temperatures that affected the BVOC emissions. In the urban background site, the highest number of events was reached. In this station, it is common to receive air masses from the nearby forest and from the urban area, producing a mix of conditions with high BVOC and AVOC concentrations. In the urban traffic site, several NPF cases appeared, being a site dominated by AVOCs. Among the BVOCs measured in the three stations, the most common were α-Pinene and Limonene. Among the AVOCs measured, aromatics and linear hydrocarbon compounds for C10 and above were found. The linear group was found to be predominant during the NPF event days in the urban background site. This work provides new insights about the aerosol-forming precursors and growth of new particles in the Madrid region.
Export citation and abstract BibTeX RIS

Original content from this work may be used under the terms of the Creative Commons Attribution 4.0 licence. Any further distribution of this work must maintain attribution to the author(s) and the title of the work, journal citation and DOI.
1. Introduction
Aerosols influence climate in several ways: directly through scattering and absorbing radiation, called radiative forcing due to aerosol-radiation interactions (RFari), and indirectly, by acting as cloud condensation nuclei or ice nuclei, modifying the optical properties and lifetime of clouds, called radiative forcing due to aerosol-cloud interactions (RFaci). This effect is due to the change in the number or size distribution of cloud droplets (Twomey 1977). In the last ten years, a new framework is used where forcing and rapid adjustments (modifying the radiative budget indirectly) are separated from feedbacks (operating through changes in climate variables) (IPCC 2013). Therefore atmospheric aerosol formation has an important role and influence on climate change (Makkonen et al 2012, Kazil et al 2010, Wang, and Penner 2009). New particle formation (NPF) in the atmosphere has been observed in different locations: urban, rural, suburban, high altitude,...A review of these measurement can be found in Kerminen et al (2018). Although there are many observations, this new particle formation is one of the least understood processes related to the presence and distribution of aerosols. Kulmala et al (2004) determined that NPF (new particle formation) via gas-to-particle conversion is the largest source of atmospheric particles (in number) and it is thought to contribute up to a half of the global Cloud Condensation Nuclei (CCN) inventory (Yu et al 2009). NPF can be understood as the process of nucleation and the subsequently growth to larger sizes. The complexity of the atmospheric behavior and processes involved has made very difficult to understand the fundamental mechanism of NPF from gaseous precursors.
Up to recently, it was considered that sulfuric acid was essential to initiate most particle formation in the atmosphere (Kulmala et al 2013) and that ions could have a secondary role. Additional vapors are needed to stabilize the clusters, mainly amines, some bases and other organic species. The effect of ammonia in the sulfuric acid-water nucleation process has been studied extensively. Experimental results (Ball et al 1999) suggested that ammonia enhances H2SO4 nucleation by 1–2 orders of magnitude. Later, Kulmala et al (2004) reached the conclusion that neutral binary sulfuric acid-water nucleation alone cannot explain most of the new-particle formation events observed in the atmosphere. When computing formation energies for sulfuric acid-water and sulfuric acid-water ammonia clusters, it was found that the HSO− 4 ion is very weakly bound to ammonia (Kurten et al 2008, Ortega et al 2008). It was suggested that some other compounds are required to stabilize the initial clusters (Laakso et al 2007). Amines are able to form sulfate salts in atmospheric conditions and can enhance neutral and ion-induced sulfuric acid-water nucleation in the atmosphere more effectively than ammonia (Kurten et al 2008). The study by Chen et al (2012) showed a good agreement of the predicted nucleation rates with those measured in Atlanta when including stabilization by bases such as amines (amine concentrations exceeded 100 pptv).
Some measurements taken in Beijing have confirmed this idea, sulfuric acid and base molecules were responsible for the initial formation of new particles and later oxidized organic molecules were crucial for particle growth above 2–3 nm (Yan et al 2021). This study has demonstrated that H2SO4, various base species and low-volatility organic vapors synergistically contributed to the intense NPF in wintertime Beijing. Liu et al (2021) studied the participation of HNO3 in this cluster (H2SO4-Amines) in Shanghai finding a clear enhancement.
However, additional relevant studies at laboratory scale have shown the possibility of organic particle formation without sulfuric acid (Gao et al 2004, Zhao et al 2013). These results have been confirmed in some experiments carried out at the CERN CLOUD chamber where the formation of particles from highly oxidized biogenic vapors in absence of sulfuric acid under atmospheric conditions has been observed (Kirkby et al 2016, Tröstl et al 2016). Later, these results were confirmed in some atmospheric measurements, for instance at the high-altitude research station Jungfraujoch, Switzerland (Bianchi et al 2016). This same mechanism could be observed with other organic compounds like low-volatility anthropogenic ones.
In the last years, iodic acid (HIO3) has been shown to drive coastal marine new particle formation but it has not been connected with predicted formation and growth rates. Some measurements (He et al 2021) have shown that the nucleation rate of iodine oxoacids exceeds H2SO4·NH3 at the same acid concentration. For regions where HIO3 concentrations can be above 106 cm−3, it could be the dominant source of new particles.
It has been established (Yli-Juuti et al 2020) that organic compounds in gas phase are responsible for most of the particle growth. However, their complexity has made their identification very difficult, as well as the way they contribute to that growth. The role of most organics, except some monoterpenes, is still unknown. It is known that isoprene reduces NPF, so its lack can generate a high particle number concentration. Temperature also regulates the condensation of the organic compounds onto the nanoparticles.
All of this may have significant implications, suggesting the need to include in models the role of the biosphere in climate regulation through aerosol radiative forcing. The high dependence of the nucleation rate and particle growth rate on biogenic emissions may lead to a coupling of CCN to these emissions. This natural gaseous contribution has been predicted to increase after changing climate estimations over this century. Nevertheless, further experimental data, especially from ambient condition experiments, are required to support this subject. An interesting summary of the current situation in the new particle formation (NPF) understanding can be found in Lee et al (2019).
Over the last 15 years, NPF events have been studied and documented at an urban background monitoring site in the city of Madrid (CIEMAT site, (Gómez-Moreno et al 2011, Alonso-Blanco et al 2017)). NPF were observed almost only during the end of the spring and the beginning of summer with the maximum formation at noon or earlier, with high insolation and winds coming from forest areas like the Casa de Campo (see figure 1). Unfortunately, the number of days with NPF events was variable over the years and it is not clear yet when and where they can appear, or they cannot. In previous studies it has been determined that NPF events are a regional phenomenon, at least they can happen in the North side of the region as it was already established (Carnerero et al 2018). These studies support the idea that NPF may represent a significant source of ultrafine particles also in Madrid during the warm period, controlling the atmospheric aerosol number concentration. However, the role of the aerosol-forming precursors taking part in the NPF, as well as their limiting factors in the Madrid basin, are still an open question.

Figure 1. Site locations during the CRISOL campaign: (A) Tres Cantos-Rural (R), (B) CIEMAT-Urban Background (UB) and (C) Leganés-Urban Traffic (UT).
Download figure:
Standard image High-resolution imageIn order to study the influence of biogenic and anthropogenic volatile organic compounds (BVOC and AVOC) in the formation and growth of new particles in the Madrid region and to see whether it also affects other parts of the region and the associated circumstances, a field campaign has been designed. Several instruments have been deployed to characterize the most relevant gaseous pollutants and a number of particle microphysical properties including chemical composition. The measurements were carried out in the period 1–17 July 2019 simultaneously at three different sites in the region with different emission characteristics. This period was selected because the high probability of NPF observed in Madrid in previous years (Gómez-Moreno et al 2011, Alonso-Blanco et al 2017, Alonso-Blanco et al 2018).
2. Methodology
2.1. Site description
Three different sites with different kinds of emissions to the atmosphere and also different pollution properties have been selected. The objective was to have three stations in three different places with different volatile organic compounds (BVOC, AVOC) emissions. These sites were aligned along the North-South axis and their location in the Madrid basin is shown in figure 1.
The Madrid region has a population of around 6.5 million people, and the main pollutant emission source is road traffic along with heating combustion devices in the cold months. The vehicular fleet has increased and changed in the last years, with more diesel than gasoline-powered vehicles in the fleet (a total of 5 million vehicles in 2020, 54.5% of which are diesel-powered and 43.6% gasoline, DGT (2021)). Emissions from light industry contribute in a lesser proportion and there is no heavy industry in the region.
According to the inventory of Madrid city air pollutant emissions (Ayuntamiento de Madrid, 2018), total VOC emissions are having a decreasing trend since 1999 to 2015, from 45 720 to 19 852 tons. In 2015, the main contributor group was 'Solvent and other product use' followed by 'Other sources and sinks (nature)' and 'Road transport', these two groups with similar emission volumes. Along the years (1999-2015), the natural sources have kept more or less constant while the other two groups have had strong reductions, 50 and 85% respectively. These reductions are expected to continue in the next years, so the VOC natural sources are going to increase their importance in the future.
The highest BVOC emissions were expected in the North of the Madrid region. The station site selected (40° 34' 1.07' N and 3° 44' 7.89' W, ∼725 m a.s.l.) was in Tres Cantos municipality, in an environmental education area located approximately 20 km north far from the Madrid city center. This municipality is in the north-eastern border of the preserved Mediterranean oak forest of El Pardo, which extends over an area of 170 km2 very close to Madrid. The vegetation at the Tres Cantos site is a natural forest of typical Mediterranean species, Quercus ilex including some introduced stands of Pinus pinea. The BVOC emissions of this site have been previously characterized and documented in experimental studies (Núnez et al 2002, Plaza et al 2005). Because of these characteristics, it can be classified for this study as a rural site (R), with expected high BVOC and low AVOC emissions.
CIEMAT site (40° 27' 23.49' N and 3° 43' 31.77' W, ∼650 m a.s.l.) is located approximately 9 km north-northwest of the Madrid city center (figure 1). The experimental site is surrounded by two green areas (Casa de Campo Park to the southwest of the CIEMAT, the greatest peri-urban Park of Madrid, and Dehesa de la Villa Park, an urban park located to the northeast). Tree and shrub vegetation species at these areas are diverse including mostly Mediterranean species (Quercus ilex and Pinus pinea) and other common gardening species (Platanus hispanica, Retama sphaerocarpa, Populus alba, Quercus suber and others). This is the main difference between this urban park and the others, specifically with the Tres Cantos site. This site can be considered a priori a representative urban background site (UB), as it is not directly affected by any local pollution source. It receives BVOC and AVOC emissions under variable conditions. The driving meteorological conditions have been previously characterized in the region. In summer, the development of strong thermal convective activity and the influence of the mountains produce characteristic circulations and mixing layer development (Crespí et al 1995), producing mountain breezes that can transport airmasses from the city early in the morning and from green areas in the afternoon and evening.
The third site was located in Leganés, a town (ca.190 000 inhabitants) in the metropolitan crown at 11 km south-west from the Madrid city center. The selected site (40° 20' 23.2' N and 3° 45' 16.3' W, ∼660 m a.s.l.) was in the north of the town and located in an educational institute for adults, close to the railway, having several avenues with high traffic density and an urban park (Parque de la Chopera). Its characteristics and historical air pollution records (provided by the co-located station belonging to the Madrid regional monitoring network) make it be considered a priori representative of an urban traffic site (UT), typical of the Madrid metropolitan area, with expected low BVOC and high AVOC emissions.
2.2. Instrumentation and data
A comprehensive description of the instruments used during the campaign can be found in table 1. Besides the instruments to identify the NPF and the possible VOC associated, some other pollutants were measured, for instance eBC or PM concentrations, to help to identify the airmass origin and, consequently, the aerosol nature.
Table 1. Details of the measurements and instrumentation used during the CRISOL campaign carried out at the 3 different sites, Tres Cantos Rural (R), CIEMAT urban background (UB) and Leganés urban (U) sites, on July 1–17, 2019.
| Parameter | Instrument | Flow | Measurement size range | Time resolution | Location |
|---|---|---|---|---|---|
| Particle Number Size Distribution (PNSDs) | TSI nano-SMPS Model 3936 with CPC 3775 | 1.5 l min−1 | 4–63.8 nm | 5-min | Tres Cantos-R |
| TSI long-SMPS Model 3081 with CPC 3775 | 0.3 l min−1 | 14.6–661.2 nm | 4.5- min | CIEMAT-UB | |
| TSI nano-SMPS Model 3086 with Nano Enhancer Model 3757 + CPC Model 3750 | 2.5 l min−1 | 1–50 nm | 2.25-min | ||
| TSI long-SMPS Model 3081 with CPC 3772 | 1 l min−1 | 11.3–478.3 nm | 4.5-min | Leganés-U | |
| Equivalent Black Carbon (eBC) | Aethalometer® model AE33 | 5 l min−1 | Particles <2.5 μm | 1-min | At the 3 sites |
| PM10, PM2.5 | TEOM 1405-DF | 16.67 l min−1 | Particles <10 and 2.5 μm | 6-min | Tres Cantos-R |
| TEOM 1405-DF | 16.67 l min−1 | Particles <10 and 2.5 μm | 6-min | CIEMAT-UB | |
| Legánes Air Quality Network | Particles <10 and 2.5 μm | 1-hour | Leganés-U | ||
| NO, NO2, NOx | Thermo Scientific Model 17i | 0.6 l min−1 | — | 1-min | Tres Cantos-R |
| DOAS AR500 | — | — | Between 7 and 9 min | CIEMAT-UB | |
| Legánes Air Quality Network | — | — | 1-hour | Leganés-U | |
| O3 | Ozone Analyzer, Thermo Environmental Instruments model 49i | 1 l min−1 | — | 1-min | Tres Cantos-R |
| DOAS AR500 | — | — | Between 7 and 9 min | CIEMAT-UB | |
| Legánes Air Quality Network | — | — | 1-hour | Leganés-U | |
| VOCs | TenaxTM tubes | — | More than 50 VOCs both biogenic (BVOCs) and anthropogenic (AVOCs) | 2–4 samples/day of 4 or 12 h | Tres Cantos-R |
| 6–8 samples/day of ∼60 min | CIEMAT-UB | ||||
| 1–3 samples/day of 4 or 6 h | Leganés-U | ||||
| Supplementary Data | |||||
| T, RH, WS, WD, P, SI, AP a | Colmenar urban traffic air quality station | — | — | 1-hour | Tres Cantos-R |
| Non-refractory chemical composition aerosol species (Organics and particulate NO3, SO4, NH4 and Cl ions) | ACSM | 3 l min−1 | PM1 | ∼30-min | CIEMAT-UB |
| Characteristics of the aerosol vertical profiles | Raman LIDAR | — | Range Corrected Signal at 1064 nm | 1 min (1800 laser pulses) | |
| T at two heights, RH, WS, WD, P, SI, AP a | CIEMAT Meteorological Tower | — | — | 10-min | |
| T, RH, WS, WD, P, SI, AP a | Leganés urban air quality station | — | — | 1-hour | Leganés-U |
a T = temperature, RH = Relative Humidity, WS = Wind Speed, WD = Wind Direction, P = Precipitation, SI = Solar Irradiance, AP = Atmospheric Pressure.
In the three sites there was an SMPS to measure the particle number size distribution (PNSD) that, depending on its configuration, varied between 1 and 661.2 nm. In the Tres Cantos station (A), it was a nano SMPS-TSI (TSI DMA 3085 + CPC 3775). In CIEMAT (B) two different systems were installed: a TSI DMA 3081 + CPC 3775 and a TSI Nano Enhancer Model 3757 and a Differential Mobility Analyzer Model 3086. In Leganés site (C), it was a TSI DMA 3081 + CPC 3772. The SMPS at CIEMAT site belongs to the ACTRIS European Network (www.actris.eu), and so to SARGAN (Rose et al 2021), and followed its standard procedures for SMPS maintenance and data quality (Wiedensohler et al 2012). This SMPS has participated and been approved in intercomparisons in the TROPOS laboratory (World Calibration Center for Aerosol Physics). Three of the instruments are included in REDMAAS, the Spanish Network on Environmental DMAs (Gómez-Moreno et al 2015), and participated in its intercomparison campaigns, where the CPC and SMPS were checked and the DMA calibrated. The complete SMPS were also intercompared and were approved when the measurements were in the +/− 10% of the all SMPS average. The Nano Enhancer Model 3757 and Differential Mobility Analyzer Model 3086 belong to the TSI manufacturer and fulfilled quality test previously to the campaign, as well as an intercomparison with other instruments at CIEMAT before the start of the campaign.
In the three sites a Tapered Element Oscillating Microbalances (TEOM) was installed to measure particulate matter (PM10 and PM2.5) levels. In addition, at the CIEMAT site a GRIMM 1107 optical instrument measured the three fractions PM10, PM 2.5 and PM1. These instruments were verified against reference gravimetric methods. The TEOM showed a difference smaller than 15% for PM10 and 35% for PM2.5. The GRIMM 1107 had similar results for PM10 and PM2.5 (30 and 15%) and 25% for PM1. These uncertainties are not very large to identify traffic or Saharan dust periods, which was the objective of them.
About the aerosol chemical composition, to determine the equivalent black carbon (eBC) mass concentration, a Magee AE 33 aethalometer equipped with a PM2.5 cut off inlet was installed at every site. Complementing these data, at the CIEMAT site an Aerodyne Aerosol Chemical Speciation Monitor (ACSM) measured continuously the composition of the non-refractory submicron aerosol (NR-PM1) species (Organics, NO3, SO4, NH4 and Cl). All these instruments, but an aethalometer, belong to the ACTRIS Network and followed its standard procedures (Cuesta-Mosquera et al 2021, Freney et al 2019). The CIEMAT aethalometer has given a maximum deviation of 10.3% from the reference instrument. The aethalometer not belonging to ACTRIS Network was previously compared with the other two with good results, showing similar uncertainties to the CIEMAT instrument. The ACSM participation in the intercomparison campaigns has shown that this instrument is well below the uncertainty accepted (30%), being 9% for ammonium.
At the three sites, VOCs were measured by offline techniques. The volatile organic compounds were sampled by using TenaxTM tubes and later analyzed in the laboratory by Gas Chromatography-Mass Spectrometry (GC-MS). The identification of the majority of the compounds has been made using certified calibration gas mixtures of 5 ppmV (Abelló-Linde, Spain). The Tenax cartridges were dopped at the same sampling flow (0.3 l min−1) for a known time at 10, 15, 20 and 25 sec and analyzed using the same methodology as the field samples. The species that were not in the gas mixtures calibration cylinder had been identified by using direct injections to the EUPHORE smog chambers (Borrás et al 2017) by means of commercial compounds. Once the reference standard compounds have been introduced into the chamber, heating it and air pass through into the chamber, Tenax cartridges were sampled following the same procedure used in the field campaigns. Just in case the comparison with the NIST library is conclusive, the identification has been done to the corresponding isomer directly.
The sampling method in Tres Cantos and Leganés sites was automatic while in CIEMAT it was operated manually. The automatic method allowed sampling during nocturnal periods obtaining longer data coverage. Samples were taken using commercial cartridges supplied by Markes International Ltd (UK). The tubes were packed with approximately 200 mg of TENAX TA (2,6-diphenylene oxide). During the field campaign a 0.3 l min−1 air flow passed through the cartridge for 8 or 12 h. After sampling, the cartridges were capped and stored at 4 °C in a portable fridge during the transport to the laboratory where a standard refrigerator was used until sample treatment. Analysis was performed before 4 weeks.
Desorption of compounds was carried out by thermal desorption (Markes) for 15 min at 250 °C in a GC port of an Agilent GC-MS (Santa Clara, USA) equipped with a HP-5MS column of 30 m × 0.25 mm I.D × 0.25 mm film. The chromatograph was programmed at 40 °C for 3 min, then ramped at a rate of 5 °C min−1 to 100 °C, 5 °C min−1 to 160 °C, finally, was held for 1 min The injection port was held at 250 °C and the transfer line from GC to MS was held at 300 °C. Samples were injected in splitless mode, using helium as carrier at flow of 1 ml min−1. The EI-voltage was 70 eV, the ion source temperature at 200 °C and the quadrupole temperature at 100 °C. Full scan mode was used (m/z 45–350) to identify the most abundant ions of hydrocarbon compounds. The analytical method used allowed determining the concentration and identifying more than 50 VOC species, both BVOCs and AVOCs.
For regulated pollutant gases, Thermo Scientific TM 122 i-series gas analyzers were used. The model 17i for NO/NO2/NOx and 49i for O3 in both stations: Tres Cantos and Leganés. In these two stations, the official procedures stablished in the European regulations have been followed in the maintenance, calibration and data treatment. It is known (Villena et al 2012) that possible NOy interferences in the NOx measurements can appear. These interferences could be more important in Tres Cantos station, a rural site with higher O3 concentrations, than in Leganés station, an urban site with lower O3 concentrations. The possible corrections for these interferences have not yet been included in the official data treatment, so they are not considered here. At the CIEMAT station they were measured by a DOAS spectrometer (OPSIS AR-500), which is regularly calibrated. These data, together with the eBC measurements, were useful to support the data analysis, to determine the possible anthropogenic origin of the pollutants. SO2 is only measured in a few Madrid network stations as it is a pollutant with very low concentrations due to its emission inventory characteristics. In Madrid city, the average value was 6 μg m−3 (2.4 ppb) during 2020 (Ayuntamiento de Madrid 2021) and 1 μg m−3 (0.4 ppb) in the Madrid region during 2018 (Comunidad de Madrid 2019). Due to these low concentration values, in the range of the DOAS detection limit, those of the Madrid monitoring network stations measuring SO2 can be used for this study. As it is an official network, it is mandatory to use the official procedures published by the Spanish Official State Gazette, where the maximum uncertainty accepted is 15%, so these measurements used are below that value.
The meteorological variables were obtained at CIEMAT by a permanent instrumented tower (54 m high) not affected by obstacles, such as trees or buildings, being representative of the local and regional meteorology. This tower measured atmospheric pressure (AP) on the ground level, relative humidity (RH) at 4 m above ground level (a.g.l.), solar irradiance (SR) and precipitation (P) at 35 m a.g.l. and wind speed and direction (WS and WD, respectively) at 54 m a.g.l. The temperature (T) is measured at two different heights, on the ground level (low-level temperature (LT)) and at 54 m a.g.l. (high-level temperature (HT)), the ΔT between both levels helped to interpret the atmospheric thermal stability situation. This meteorological station is calibrated twice per year according to standard procedures. Another small tower was installed at the Leganés site for pressure, temperature, wind speed and relative humidity. This station was maintained by the regional air quality network.
Vertical profiles of aerosols were measured at CIEMAT by means of a lidar system. It uses a pulsed Nd:YAG laser emitting at 1064, 532, and 355 nm, configured in a monostatic biaxial alignment pointing vertically to the zenith. The receiving line consists of a Newtonian telescope and wavelength separation unit with dichroic mirrors, interferential filters, and polarization cubes. The collected radiation is split into five channels allowing the detection of elastic signals at 1064, 532, and 355 nm and two Raman channels at 387 and 607 nm (nitrogen Raman-shifted signal from 355 and 532 nm, respectively). The optical set-up of the system yields a full overlap at about 300 m above the instrument. The lidar signal was registered in 1 min integrated time, with a vertical resolution of 3.75 m. Continuous measurements were performed during the campaign, providing 'quicklooks' of the atmosphere up to 12 km to assist in the identification of the atmospheric situation and the presence of aerosol-rich elevated layers.
To study the synoptic meteorological conditions during the campaign, sea level pressure maps at 00:00 and 12:00 UTC provided by AEMET (Spanish State Meteorological Agency, http://www.aemet.es/) have been analyzed.
Airmass back-trajectories arriving at Madrid (40.42°N, 3.68°W) were computed using the HYSPLIT (Hybrid Single Particle Lagrangian Integrated Trajectory) model (Rolph et al 2017, Stein et al 2015). 5 days (120 h) back-trajectories were calculated starting from heights of 500, 1500 and 3000 m a.g.l., at 12:00 UTC for every day of the campaign period.
The occurrence of Saharan dust outbreaks during the field campaign was studied using the NAAPS (Navy Aerosol Analysis and Prediction System) model (https://www.nrlmry.navy.mil/aerosol/). It combines data obtained by satellites, aerosol simulations and predictions at a global scale.
2.3 New particle formation: identification and analysis tools
NPFs were identified visually from the surface plots of PNSDs and classified using the criteria defined by Dal Maso et al (2005). The Condensation Sink (CS), which determines how rapidly molecules can condense onto the already existing aerosol instead of generating new particles, was calculated for the three sites using the TSI-SMPS data (Lehtinen et al 2003, Kulmala et al 2001). This CS parameter has been calculated according to Lehtinen et al (2003) using the following equation:

where D is the diffusion coefficient of the condensing vapor in the gas phase (in this study assumed that D is the H2SO4 diffusion coefficient, 0.104 cm2 s−1 (Lyman et al 1990)), βM,i is the transitional correction factor (Fuchs and Sutugin 1971), dp is the particle diameter and Ni (cm−3) is the particle number concentration for each particle size discrete interval i. Tuovinen et al (2021) evaluated the uncertainty arising from the assumptions taken. The main uncertainty sources are: the mass accommodation coefficient (which is included in the transitional correction factor) is usually assumed to be unity, the condensing vapor is assumed to be sulfuric acid, and evaporation is assumed to be negligible. They conclude that if the condensing vapor is VOC, the CS is smaller. If the mass accommodation coefficient is smaller than unity, the CS can be significantly overestimated. CS at Tres Cantos site was not calculated due to the different measurement size ranges compared with CIEMAT and Leganés sites, as the values obtained would not be comparable.
Shrinkages were identified and classified following Alonso-Blanco et al (2017).
At CIEMAT, an estimation of the H2SO4 concentration was also calculated using the SO2 concentration measured in the Casa de Campo station. This station belongs to the city of Madrid's air quality monitoring network and is very close to the CIEMAT site (at 4 km). It was not possible to estimate this concentration in the other two sites because of the lack of SO2 measurements. This estimation was done following the semi-empirical proxy for sulfuric acid concentration (Mikkonen et al 2011, Petäjä et al 2009).

where:  is the reaction rate constant, which is calculated according to equation (3) in Mikkonen et al (2011) and is scaled by multiplying it with 1012 (m2W−1s−1); Radiation is global radiation (W
 m−2), [SO2
] is the measured SO2 concentrations·(molec·cm−3); CS is the condensation sink (s−1) computed following equation 1; and RH is the relative humidity (%). Mikkonen et al (2011) gave some values for the uncertainty associated with the proxy, founding that the relative errors are 42%. The main source of this uncertainty seems to be the role of SO2 and the uncertainties associated to its concentration measurements (Herrmann et al
2014). This H2SO4 can be neutralized by ammonia, amines and/or other bases. Lehtipalo et al (2018) showed that when NH3, H2SO4 and HOMs (highly oxygenated molecules) were present simultaneously, high nucleation rates were obtained. Experiments at higher NH3 concentrations than 200 pptv showed higher nucleation rates than similar experiments without added NH3. This confirmed some CLOUD experiments (Bianchi et al (2012) that showed that when increasing the ammonia concentration, the nucleation rates increased until about 200 pptv, when the nucleation rates reached saturation. In previous campaigns (Reche et al
2015, Artíñano et al
2018), the ammonia concentration has been characterized in the Madrid region, finding for urban and urban background sites ammonia concentration well above that saturation value, one order of magnitude higher. Although not published, data obtained in the rural background show similar concentrations to the urban and urban background sites. In the three sites, the ammonia concentration will be in the range where the response to different concentrations is saturated.
m−2), [SO2
] is the measured SO2 concentrations·(molec·cm−3); CS is the condensation sink (s−1) computed following equation 1; and RH is the relative humidity (%). Mikkonen et al (2011) gave some values for the uncertainty associated with the proxy, founding that the relative errors are 42%. The main source of this uncertainty seems to be the role of SO2 and the uncertainties associated to its concentration measurements (Herrmann et al
2014). This H2SO4 can be neutralized by ammonia, amines and/or other bases. Lehtipalo et al (2018) showed that when NH3, H2SO4 and HOMs (highly oxygenated molecules) were present simultaneously, high nucleation rates were obtained. Experiments at higher NH3 concentrations than 200 pptv showed higher nucleation rates than similar experiments without added NH3. This confirmed some CLOUD experiments (Bianchi et al (2012) that showed that when increasing the ammonia concentration, the nucleation rates increased until about 200 pptv, when the nucleation rates reached saturation. In previous campaigns (Reche et al
2015, Artíñano et al
2018), the ammonia concentration has been characterized in the Madrid region, finding for urban and urban background sites ammonia concentration well above that saturation value, one order of magnitude higher. Although not published, data obtained in the rural background show similar concentrations to the urban and urban background sites. In the three sites, the ammonia concentration will be in the range where the response to different concentrations is saturated.
3. Results
3.1. Meteorological conditions
Distinct atmospheric conditions occurred during the study period being the most important issues shown in figure 2 and S2-S4.
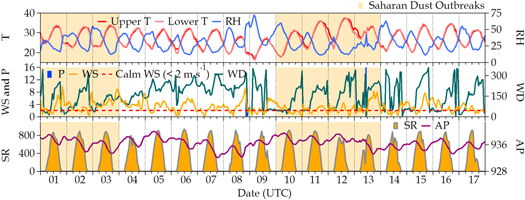
Figure 2. Evolution of the meteorology at CIEMAT site. Parameters (units) are denoted in the graph as follows: T = Temperature (°C), RH = Relative Humidity (%), WS = Wind Speed (m·s−1), WD = Wind Direction (degrees), P = Precipitation (mm), SR = Solar irradiance (W·m−2) and AP = Atmospheric Pressure (mbar). The shaded periods correspond with the identified Saharan dust outbreaks.
Download figure:
Standard image High-resolution imageThe period of study was characterized at the synoptic scale by a low pressure gradient at the surface level and by the advection of southern air masses at upper levels. The presence of a low pressure system at the SW-W sector of the Iberian Peninsula (IP) in the periods 1–5 and 10–13 July triggered such atmospheric circulation. For this reason, Saharan dust contributions were produced over the central region of the IP during the periods 1–4 and 12–13 July (see figure S3 and shaded periods in figure 2). The lidar profiles (figure S1) show a mixed layer up to 1.5 km, and a second layer, between 2.5 and 4 km, probably due to the Saharan dust contribution during the period 1–5. Tenuous elevated layers appeared on the 10 July (figure S1A) and a stronger layer, between 3 and 4 km, on the morning of the 11 July, leading to very high mixed layer, up to 6 km, in the following days, according to the lidar instrument (figure S1B). In the transition period between both dust outbreaks, especially from 8 to 9 July, a rather unstable atmospheric situation was established due to the development of N-NE air mass flows. Slow and moderate air flows prevailed during the last days of the campaign due to the influence of the Azores high pressure system over the IP. Between the 15 and 18 July, the mixed layer detected by lidar (figure S1C) shows a daily evolution during these days, with another residual layer up to 3 km that produced a rapid development during the morning. The atmospheric conditions clearly affected the course of the meteorological surface measurements during the campaign.
The meteorology was measured at the CIEMAT tower along the campaign (figure 2). Temperatures oscillated between 20 and 40 °C, corresponding the less warm days to the periods 8–10 and 17 July. The highest ΔT was recorded during the 7 and 11 to 13 July nights (4.3 °C the 12 July night) indicating a high atmospheric stability and surface inversion. Rain events (figure 2) appeared only on 8 and 13 July and were associated with local summer storms. The relative humidity was low, mostly lower than 50%. The daily solar irradiance maximum was always above 800 W m−2. Wind speed remained below 10 m s−1 during all the campaign with very few exceptions (1 and 8 July). The days with the lowest wind speed were 7, 11, 12 and 17 July (figure 2). The wind rose for the period of the campaign shows that the air circulation pattern is the usual one in Madrid, with two dominant directions along the NE and SW axis aligned with the nearby Guadarrama mountain range (Plaza et al 1997). The NE wind usually occurs during mornings and the SW wind during afternoons and with lower wind speeds. In the other two sites the local meteorology was similar, taking into account they are more affected by local conditions like obstacles and near buildings. So, the typical wind rose observed in CIEMAT tower was slightly modified in the Leganes site where the wind speed was always below 4 m s−1.
The complete series of synoptic surface maps, air mass back trajectories and dust forecast maps during the CRISOL field campaign can be found in the figure S2, S3 and S4 respectively in the supplementary information.
3.2. Evolution of the particle size distribution: New particle formation events
The number of detected NPF episodes events was higher in CIEMAT (6) and Leganés (5) than in Tres Cantos (2). At the beginning of the campaign (days 3–7th July), several NPF events were simultaneously observed at the three sites (figure 3), however, unlike Tres Cantos, in Leganés and CIEMAT the growth and formation rate of new particles was well defined. At the end of the campaign, some events appeared again but only at CIEMAT site (16–17th). The events and their classification (Dal Maso et al 2005) can be found in table 2. The different classes of NPF events at CIEMAT site were previously characterized (Gómez-Moreno et al 2011). Class I corresponds with events in which the particle growth rate can be determined or observed. In Class Ia the typical banana shape is clearly visible. It is mostly related with low wind speed, below 4 m s−1, and with stable wind direction. Class II corresponds to a situation in which particle growth determination is not possible. It is related with higher wind speed (5–6 m s−1) or the wind direction was rotating in the typical clockwise sense from northeast to west. Class Ib events had characteristics between those of classes Ia and II. In this case the banana shape is not completely clear, but the particle growth can be observed. All the events occurred around noon, when the solar radiation was maximum.
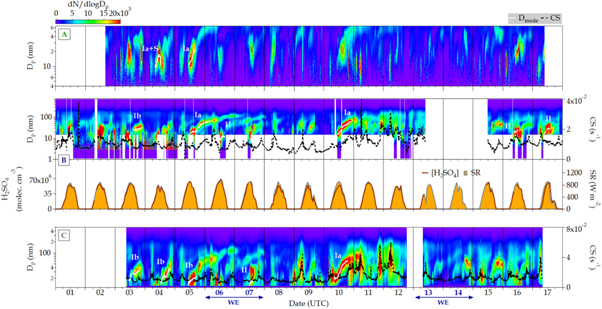
Figure 3. Evolution of the particle number size distributions, condensation sink (CS, dot lines), solar radiation and H2SO4 estimation during the CRISOL field campaign: (A) Tres Cantos-R, (B) CIEMAT-UB and (C) Leganés-UT. WE refers to the weekend days.
Download figure:
Standard image High-resolution imageTable 2. Identification of NPF and NPF + S events during the CRISOL field campaign and their classification (Dal Maso et al (2005) and Alonso-Blanco et al (2017) respectively). The main parameters (GR = Growth Rate for the modal diameters, SR = shrinkage rate for the modal diameters, CS = Condensation Sink for 1 h prior to NPF, H2SO4 = gas-phase H2SO4 proxy (Mikkonen et al 2011) value for the hour when NPF start and VOCs = volatile organic compounds (VOCs), categorizing them into anthropogenic (AVOCs) and biogenic (BVOCs)) have been included for each case of NPF event identified.
| VOCs (μg m−3) | |||||||||
|---|---|---|---|---|---|---|---|---|---|
| Date | Type | Period (UTC) | GR (nm·h−1) | SR (nm·h−1) | CS (s−1) | H2SO4 (molec. cm−3) | Total | AVOCs | BVOCs |
| Tres Cantos site | |||||||||
| 4 July | Ia+S | 08:00–13:00 | 2.0 (08:00–11:20) | −3.6 (11:30–13:00) | — | 13.2 | 6.9 | 0.4 | |
| 5 July | Ia | 11:20–16:40 | 1.7 | — | — | 9.50 | 3.41 | 0.20 | |
| CIEMAT site | |||||||||
| 3 July | Ib | 14:40–21:30 | 0.9 | — | 9.36 × 10⁻³ | 5.6 × 10⁷ | 55.9 | 44.4 | 5.1 |
| 5 July | Ia | 12:40–05:30 (6 July) | 2.3 | — | 7.49 × 10⁻³ | 6.4 × 10⁷ | 23.8 | 16.7 | 0.7 |
| 6 July | II | 12:30–16:10 | 1.0 | — | 5.31 × 10⁻³ | 6.3 × 10⁷ | — | — | — |
| 10 July | Ia | 10:50–21:50 | 3.4 | — | 8.78 × 10⁻³ | 4.5 × 10⁷ | 23.8 | 20.2 | 0.5 |
| 16 July | II | 09:30–12:10 | 2.3 | — | 1.19 × 10⁻² | 4.0 × 10⁷ | 94.7 | 79.1 | 1.2 |
| 17 July | II | 09:30–14:10 | 1.9 | — | 1.24 × 10⁻² | 3.1 × 10⁷ | — | — | — |
| Leganés site | |||||||||
| 3 July | Ib | 11:00–19:20 | 1.4 | — | 1.20 × 10⁻² | — | 17.7 | 10.6 | 0.1 |
| 4 July | Ib | 12:00–20:00 | 2.4 | — | 1.03 × 10⁻² | — | 13.3 | 7.5 | 0.1 |
| 5 July | Ib | 10:30–17:00 | 1.1 | — | 9.08 × 10⁻³ | — | 14.7 | 8.5 | 0.1 |
| 7 July | II | 12:10–14:30 | 1.5 | — | 8.20 × 10⁻³ | — | — | — | — |
| 10 July | Ia | 08:10–19:20 | 3.0 | — | 1.52 × 10⁻² | — | 34.1 | 22.6 | 0.3 |
During the period 3–7th, the weather was mostly stable; the wind speed was below 3 ms−1 during most of the day except after the midday when it reached 5 ms−1. During this period the wind direction followed a pattern varying from SE to SW. The relative humidity was low, always below 50% and reaching values below 20% in the warmest hours. However, on the period 16–17th, the weather conditions were rather different, with similar wind speed and relative humidity but directions followed a well-defined pattern starting NE and clockwise rotating until reaching SW.
The H2SO4 concentration estimated (Mikkonen et al 2011) for CIEMAT shows a clear dependence of the solar irradiance (SR), as can be seen in the figure 3(B). The condensation sink reached similar values all days in CIEMAT and Leganés sites (CIEMAT average CS 1.07 10−2 s−1, maximum 4.17 10−2 s−1 and minimum 2.36 10−4 s−1; Leganés average CS 1.30 10−2 s−1, maximum 5.97 10−2 s−1 and minimum 4.97 10−3 s−1). However, nucleation events only appeared in some cases, indicating that besides the possible H2SO4 participation in these events, the influence of other participants in the nucleation or in the subsequent growth, as it has been previously established for the potentially significant role of VOCs in the particle formation (Lee et al 2019), cannot be rejected.
3.3. Regulated gases and particle levels and composition
In this section, the evolution of the most common pollutants with possible influence in the NPF is analyzed for the three sites. This evolution can be found in figure -S5. Going from north to south, in Tres Cantos, all the pollutants had the lowest concentrations, with PM10 and PM2.5 values increasing during some days (12 and 13 July) because of the Saharan dust outbreaks, which affected the entire region. The anthropogenic pollutant, NOx, had very low levels, NO concentrations were one order of magnitude smaller than those observed at the urban traffic station (in average 3.3 ± 2.8 versus 11.9 ± 13.8 μg m−3 (2.6 ± 2.2 versus 9.5 ± 11.0 ppb); maximum values were 14.5 versus 80 μg m−3 (11.6 versus 63.5 ppb), respectively).
The CIEMAT station presented intermediate values for NO (average 3.5 ± 5.9 μg m−3 (2.8 ± 4.7 ppb) and maximum 86 μg m−3 (68.7 ppb)) but the NO2 level was very high, reaching an average of 44 μg m−3 (23 ppb) and the maximum of 144 μg m−3 (75 ppb). Ozone behavior was clearly opposite to NO2 and reaching values above 150 μg m−3 (75 ppb). High concentrations for both PM10 and PM2.5 were also observed at this site during the Saharan dust outbreaks, and lower concentrations for PM1.
In the case of the urban station, Leganés, the PM10 and PM2.5 levels were similar to those recorded at CIEMAT as well as Ozone levels, but NO2 concentrations were lower. It should be noted that this station is closer to the emission sources and the NO concentrations were high (up to 150 μg m−3 (120 ppb)).
Besides NOx, another pollutant directly related with traffic is the equivalent black carbon (eBC). This parameter was monitored at the three sites. The highest eBC concentrations during the campaign were found in Leganés (1.9 ± 1.9 μg m−3; maximum 11.5 μg m−3) followed by CIEMAT (1.1 ± 0.8 μg m−3; maximum 4.6 μg m−3) and Tres Cantos (0.5 ± 0.3 μg m−3; maximum 1.4 μg m−3), with the same positive South-North gradient as that observed for the pollutant gases. As it has been mentioned before, Leganés and CIEMAT are influenced by road traffic emissions, especially Leganés, as it is an urban site and the station is close to several important avenues and streets. The eBC evolution at the three stations can be found in figure 4.

Figure 4. Evolution of the eBC concentration along the CRISOL field campaign at the three sites. (A) Tres Cantos-R, (B) CIEMAT-UB and (C) Leganés-UT. NR-PM1 species (Organics and particulate NO3, SO4, NH4 and Cl ions) have been incorporated in the figure B for CIEMAT-UB site. The green bars correspond with the identified NPF events. WE refers to the weekend days. (D) Detail of the 5th of July where the particle growth corresponds with an increase in the organics.
Download figure:
Standard image High-resolution image3.4. VOC evolution
AVOC and BVOC average concentrations (Table S2) were higher in CIEMAT-UB followed by Leganés-UT and Tres Cantos-R. Comparing the different measurement areas, the evolution along the campaign of the VOCs at the three sites shows a slightly different behavior, see figure 5. In Tres Cantos, the highest values for total VOCs were around days 8 and 10-11th. However, the BVOCs show a clear maximum around 8–9th related with the lower temperature and higher humidity, which allowed higher emissions from vegetation in this site. In CIEMAT, the maximum values for VOCs were reached 12th, 15th and 16th, with a smaller peak at the beginning of the campaign. In Leganés, the main peak was also the 12th, but no peak appeared later.
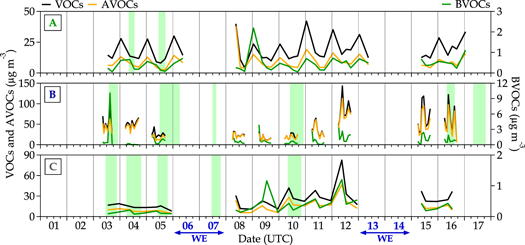
Figure 5. Evolution of the concentration of volatile organic compounds (VOCs), categorizing them into anthropogenic (AVOCs) and biogenic (BVOCs) during the CRISOL field campaign: (A) Tres Cantos-R, (B) CIEMAT-UB and (C) Leganés-UT. VOC concentrations include the not identified species and those which could have both origins, these cases are not included in the AVOC and BVOC concentrations. Note: for a better visualization different scales have been used for AVOCs and BVOCs at the three sites. The green bars correspond with the identified NPF events. WE refers to the weekend days.
Download figure:
Standard image High-resolution imageAVOCs and BVOCs showed a similar daily pattern in each site, being higher in the morning hours in CIEMAT and Leganés coinciding with the morning rush hours and in Tres Cantos during afternoon and evening hours.
Figure 6 shows the time evolution of some specific VOC concentration at each site sampled by the TenaxTM tubes. These VOCs have been selected because of their high concentration at each site. At Tres Cantos site, the main BVOC detected was Benzylalcohol, which presented the highest concentrations during the NPF events. During the days 10 and 11th, besides this compound, m-Cymene and Sabinaketone were also found at significant concentrations. Among the AVOCs, the highest concentrations were found for Benzene and Phenol. Other important compounds with high concentrations were: 1-Heptene, Butylacetate, Propylbenzene, 4-Ethyltoluene, Acetophenone, Decane, Undecane, Dodecane and Tetradecane. There are two groups, those in the aromatic group and those with a linear structure. This last group is for C10 and above.

Figure 6. Evolution of the concentration of the main species of biogenic (BVOCs) and anthropogenic volatile organic compounds (AVOCs) identified in each measurement site during the CRISOL field campaign: (A) Tres Cantos-R, (B) CIEMAT-UB and (C) Leganés-UT. The green bars correspond with the identified NPF events. WE refers to the weekend days.
Download figure:
Standard image High-resolution image
These two groups were also found in the other two stations, CIEMAT and Leganés, although in higher concentrations due to a higher traffic emission influence. In these two stations the daily evolution was similar. At CIEMAT, the most common BVOCs during the NPF events were α-Pinene together with Camphene, β-Pinene and Limonene. About the AVOCs, the most common compounds were similar to those in Tres Cantos station: Benzene, Toluene, Decane, Dodecane and 1,2,3-Triclorobenzene during the NPF events and Tetradecane, 4-Ethyltoluene and Trimethylbenzene during non-event days.
At Leganés, the main BVOCs were: m-Cymene, m-Propiltoluene, Benzilalcohol and Valerolactone, always with very low concentration. The most common AVOCs were the same as in the other stations: Benzene and Toluene during NPF days and Etilbenzene, Butilacetate, Propilbenzene, Decane, Dodecane, Tetradecane and others. This higher concentration for AVOCs can explain several NPF events observed at the site, especially Benzene and Toluene (Ling et al 2019).
4. Discussion
It is very difficult to isolate the influence of each meteorological variable, as many of them are related. The influence of meteorology patterns at the synoptic scale in the atmospheric particle behavior, including particle nucleation and growth, well characterized by the different variables has been recently studied (Salvador et al 2021). It was observed that NPF events appeared during two typical synoptic meteorological patterns (SMP), both of them associated with high atmospheric stability conditions. The first case was the synoptic scenario led by an anticyclone centered on the Azores Islands and a low pressure center situated between the United Kingdom and the Scandinavian countries. Isobars were fairly spaced and the pressure center locations suggested the predominant occurrence of smooth NW air flows entering from the Atlantic Ocean into the IP. This situation is similar to what happened the last campaign days, 15 and 16 July when two NPF appeared at CIEMAT site, however not in the other two sites. The second case is the synoptic scenario with high pressures displaced northwest of the IP preventing Northern air mass flows over the peninsula from occurring. This scenario is similar to that found at the beginning of the campaign, day 3–7 July, when several NPF were observed.
Observing the Condensation Sink (CS) data in table 2, it is clear that the highest values have been obtained in the urban site, Leganés. Both of them, CIEMAT and Leganés, are in the range observed in other different sites. In Kulmala et al (2005), several sites were studied, some urban like New Delhi, Marseille, Athens, with CS similar to those found in Leganés. They observed growth rates of nucleation mode particles surprisingly similar between the different measurement sites, differing on average by less than an order of magnitude. The GR measured were between 0.9 and 4.2 nm h−1, similar values to those observed in Kulmala et al (2005) for most of the sites except New Delhi, where higher values were found.
The site where fewer events were observed (2) was the rural site, Tres Cantos, the opposite of expected because it is a forest rural site and higher BVOC concentrations were supposed to be found here. However, in this site, ambient features could be a limiting factor in explaining the low BVOC concentrations registered, conditioning the NPF formation. In previous studies (Núnez et al 2002; Plaza et al 2005), it was observed that high temperatures and low relative humidity can produce severe water soil deficit conditions, which mainly depends on the recent rain events, and so be responsible for a low BVOC emission. That study, consisting of a campaign performed in the same site of Tres Cantos, showed that when the temperature was above 28°C and the relative humidity decreased below 34%, the biogenic emission was strongly reduced and only limonene was detected. This seems to be a common behavior that corresponds to the local vegetation physiology response to a high water vapor pressure deficit conditions. During the previous month to the current campaign the precipitation in the area was almost zero and temperature and humidity during the campaign were most of the time out of these ranges, clearly they were reached between 8th and 10th and during some other short periods, thus inhibiting the BVOC emissions at this site according to Plaza et al (2005).
The fact that VOC concentrations were higher in CIEMAT-UB could be attributed to the combination of the local sources surrounding each site and the different wind pattern. Regarding the latter, winds arriving from the westerly sector to CIEMAT could bring aerosol-forming precursors and condensable compounds, presumably biogenic ones, while from the easterly sector could bring anthropogenic compounds. In the Tres Cantos site, the station is surrounded by forest, so winds usually bring biogenic compounds. Conversely, the Leganés site is embedded in the urban area, with only some small parks, so winds usually bring an airmass enriched in anthropogenic compounds.
It is interesting to see the main composition of the aerosol during the campaign at the CIEMAT site, which is shown in figure 4(B). During the growth periods when a NPF event was detected (figure 3), the ACSM measured an increase in the organic fraction very remarkable in intensity and duration, very clear for the day 5th July, as it is seen in figure 4(D). Although it is difficult to conclude they are related, it is a possibility to take into account. On average during the campaign, around 72% of the particle composition was organics, 10% was sulfate and ammonium and 5% nitrates. The main atmospheric pollutant origin in Madrid is road traffic (Ayuntamiento de Madrid, 2018). This source produces a large amount of AVOCs available that can later condense on the particles to make them grow. CIEMAT can be influenced by traffic emissions from the urban area, but at the same time, as it is located in a corner of the city and surrounded by several big parks where trees and vegetation emit BVOCs, can be affected by these natural origin emissions. These BVOCs, once they have been oxidized and their molecular weights have increased, can also condense on the particles to increase their size. Alternatively, they can stabilize the initial clusters during a nucleation event. These two sources produce the organics measured by the ACSM.
Bianchi et al (2017, 2019) discussed the highly oxygenated molecules (HOMs) participation in NPF and their possible origin, VOCs. It is thought that one of the main sources of HOM in the atmosphere is the oxidation of terpenes. They mentioned that not only monomer HOMs (C10), but dimer HOMs (C19 or C20) were also observed in both gas and particulate phases. These findings agree with some species found in this campaign being the terpenes the highest concentrations measured, although other C10 compounds have been also observed. α-Pinene has been traditionally considered as a precursor (Ehn et al 2012) of the Highly Oxygenated Organic Molecules (HOM) that can condense on pre-existing particles and be involved in new particle formation (Bianchi et al 2019). The ozonolysis of the α-pinene can depend linearly on the sulfuric acid concentration, β-pinene also formed highly oxidized products, but the reaction is less efficient (Ehn et al 2012). This concentration has been estimated for the CIEMAT site as it has been mentioned previously. The pinene concentration at CIEMAT is one of the highest among the BVOCs and the sites. It reached its daily peak during early hours in the morning during the days 5, 8, 9, 11 and 12. Another important BVOC is limonene, which is also a monoterpene known to be involved in the NPF process (Vartiainen et al 2006). It reached its maxima during the days 5, 9, 11 and 12 and in the early morning.
Brean et al (2019) observed that alkylbenzenes, monoterpenes and isoprene are important VOCs precursors for HOMs in Beijing, with abundant isoprene oxidation products observed and also monoterpene monomers (C10) and some dimer products (C20), similarly to Bianchi et al (2017) and some of the result found in this campaign. Debevec et al (2018) measured VOCs during some NPF events in a site similar to those in this campaign, in a Mediterranean background site, and observed similar BVOCs. The dominant monoterpenes found during the field campaign were β-pinene and α-pinene, followed by limonene and camphene, which correspond with the most important BVOCs measured during NPF days in this campaign. They also observed (Debevec et al 2018) BVOC interactions with anthropogenic compounds (AVOCs) which enhanced nucleation formation and growth of newly formed particles. This is clearly seen at CIEMAT, where the mix of VOCs was higher and so more NPF events appeared.
Comparing the two VOC groups previously mentioned (linear and aromatics), at the CIEMAT site, the linear VOCs concentration was predominant for the anthropogenic fraction during NPF days and no aromatic BVOCs were measured (see table S2), what seems to indicate that linear VOCs had a more important participation in the NPF. However, at the Tres Cantos site the ratios were similar during nucleation and no nucleation days, probably due to the few NPF events observed in the first case and the traffic emissions in the second site. No clear trend has been observed.
5. Conclusions
A field campaign has been performed in the Madrid region during the summer period focused on NPF events and their relation with aerosol-forming precursors and aerosol growth, specifically VOCs. Three sites with different characteristics in terms of aerosol emissions and their precursors have been instrumented with instruments to measure gases and particle properties. The main conclusions obtained in this study are:
- (1)It has been observed that the NPF events happened at a regional scale. This was already established in a previous work (Carnerero et al 2018), for the Northern area of the region with three stations located in the direction west-east. In the current study, this finding has been observed with stations located in the direction north-south covering areas not previously studied.
- (2)In the Tres Cantos site, a rural site located in a natural Mediterranean forest, few events were observed, just the opposite of expected. The reason was attributed to the influence of the high temperatures and very low relative humidity producing severe water soil deficit conditions, which significantly reduced the BVOC emissions by stomata closure under stress conditions (Núnez et al 2002, Plaza et al 2005).
- (3)In the CIEMAT site, an urban background site, the highest number of events was reached. It is a site where airmasses from different origins and types of areas arrived. It is common to receive airmasses from forest areas, like the Casa de Campo Park, that combine with urban airmass from the city center under a feedback daily wind cycle that reproduces every day. This produces a mix of conditions with high BVOC and AVOC concentrations, which enhanced the nucleation events (Debevec et al 2018, Brean et al 2019). This enhancement could be observed in any other site where this mix can happen. In addition, organics were an important contributor to the NPF at this site, reinforcing the importance of VOCs in its formation and growth.
- (4)In the Leganés station, an urban site, several NPF cases appeared, being a site with mainly AVOCs. This confirms that their influence on NPF development in the Madrid basin is not negligible, as it has been observed previously in other locations (Ling et al 2019).
- (5)Among the BVOCs measured in the three sites, the most common was α-Pinene together with Camphene, β-Pinene and Limonene. Among the AVOCs measured, two groups were found, those in the benzene structure group and those with a linear structure (Decane, Dodecane,...). The linear VOCs seem to participate in the NPF process in a higher degree than aromatic VOCs in the urban background site. This could happen in any other site with similar characteristics. This fact must be confirmed with the analysis of more NPF events.
A greater understanding of the aerosol-forming precursors, aerosol growth and their interactions during the NPF process in the atmosphere is crucial. This dynamic process controls the aerosol number and size distributions, and consequently their lifetimes and atmospheric effects. Thus, the observations and results obtained during the CRISOL field campaign can partially contribute to reduce the uncertainties related to the role of some aerosol precursors, especially VOCs, during the summer period.
Acknowledgments
This research has been partially funded by the CRISOL Project (CGL2017-85344-R MINECO/AEI/FEDER, UE), OASIS project (PID2021-127885OB-I00 fund by MCIN/ AEI/10.13039/501100011033 and by 'ERDF A way of making Europe') and by the TIGAS-CM project (Madrid Regional Government Y2018/EMT-5177).
Data availability statement
The data generated and/or analysed during the current study are not publicly available for legal/ethical reasons but are available from the corresponding author on reasonable request.
Supplementary data (2.8 MB JPG)
Supplementary data (0.5 MB JPG)
Supplementary data (0.9 MB JPG)
Supplementary data (3 MB DOCX)