
Abstract
Carbon fibres (CFs), originally made for use in structural composites, have also been demonstrated as high capacity Li-ion battery negative electrodes. Consequently, CFs can be used as structural electrodes; simultaneously carrying mechanical load and storing electrical energy in multifunctional structural batteries. To date, all CF microstructural designs have been generated to realise a targeted mechanical property, e.g. high strength or stiffness, based on a profound understanding of the relationship between the graphitic microstructure and the mechanical performance. Here we further advance this understanding by linking CF microstructure to the lithium insertion mechanism and the resulting electrochemical capacity. Different PAN-based CFs ranging from intermediate- to high-modulus types with distinct differences in microstructure are characterised in detail by SEM and HR-TEM and electrochemical methods. Furthermore, the mechanism of Li-ion intercalation during charge/discharge is studied by in situ confocal Raman spectroscopy on individual CFs. Raman G band analysis reveals a Li-ion intercalation mechanism in the high-modulus fibre reminiscent of that in crystalline graphite. Also, the combination of a relatively low capacity of the high-modulus CFs (ca. 150 mAh g−1) is shown to be due to that the formation of a staged structure is frustrated by an obstructive turbostratic disorder. In contrast, intermediate-modulus CFs, which have significantly higher capacities (ca. 300 mAh g−1), have Raman spectra indicating a Li-ion insertion mechanism closer to that of partly disordered carbons. Based on these findings, CFs with improved multifunctional performance can be realised by tailoring the graphitic order and crystallite sizes.
Export citation and abstract BibTeX RIS
1. Introduction
Materials that simultaneously can store electrical energy and carry mechanical load have potential to have a strong impact on electrification of transport. When combined this forms the basis for enabling structural batteries [1, 2]. Structural batteries can facilitate a multitude of future electrical vehicles, be it road-, sea- or aircraft, by their potential to provide 'mass-less' energy storage as electrical energy can be stored intrinsically in a structural component, e.g. in the aircraft fuselage or in the car body [1, 3]. Carbon fibre (CF) composites are known to provide the most lightweight structural solutions by their unrivalled specific stiffness and strengths [4] and more recently high electrochemical capacities were reported for polyacrylonitrile (PAN) based CFs [5–8]. Combined this forms the basis for CFs as structural battery electrodes [9–11].
As yet, however, there is no rationale for the high electrochemical capacity shown for PAN-based CFs, ca. 200–300 mAh g−1 [5–7], as compared to pitch-based CFs at a mere ca. 50–100 mAh g−1 [5]. CFs have complex microstructures, in general they are semi-crystalline and formed by turbostratically arranged graphite-like crystals, more or less oriented along the fibre axis [12]. Commercially available PAN-based CFs are produced by a controlled pyrolysis of wet spun PAN precursor fibres whereby non-carbon atoms are removed and the graphite-like structure is formed. By choice of precursor and process parameters, the microstructure can be varied considerably, especially with respect to crystallite size and orientation, offering a wide range of mechanical and physical properties [13] with a profound understanding of the relationship between microstructure and mechanical properties being well established [12, 14].
Moving to the electrochemical properties of CFs, some of us [8] recently performed high precision coulometry on PAN-based CF electrodes where intermediate-modulus (IM) CFs, i.e. IMS65, T300, T800, and T1000, were found to have high capacities, ca. 250–350 mAh g−1 and very high coulombic efficiencies—for some >99.9% after 10 cycles, while the high-modulus (HM) fibre M60J had a mere 140 mAh g−1 and ca. 99.5% after 10 cycles. The overall high coulombic efficiencies can be explained by the very low surface areas of CFs, resulting in a thin and stable solid electrolyte interphase (SEI) [8]. XRD and Raman spectroscopy studies demonstrated M60J to have a higher degree of crystallisation, preferentially located at the fibre surface with an amorphous core [8].
Here both virgin and electrochemically cycled T800, IMS65 and M60J CF electrodes are analysed by high-resolution (HR) TEM and in situ Raman spectroscopy in order to connect the observed electrochemical properties and the underlying Li-ion intercalation mechanisms with the CF graphitic microstructure.
2. Experimental
2.1. Materials
Three types of PAN-based CFs were used; the IM fibres T800 and IMS65 and the HM fibre M60J (table 1). The choice to study IM and HM fibres is motivated by the substantial difference in their turbostratic graphitic structures. The HM fibre shows higher lattice-dependent properties, i.e. tensile modulus and electrical and thermal conductivity, but lower strength and strain to failure than the IM fibres. IMS65 and T800 IM fibres were studied as they have the highest electrochemical capacity of the CFs studied to date [6–8]. The carbon content in the fibre is controlled by the final heat treatment temperature (HTT) [15]. As the same final HTT interval is reported for the two IM fibres, the carbon content of IMS65 is assumed to be the same as for T800, i.e. 96%.
Table 1. Structural properties of the CFs from their respective data sheets.
| CF | T800 | IMS65 | M60J |
|---|---|---|---|
| Manufacturer | Toraya | Toho Tenaxb | Toray |
| Type | IM | IM | HM |
| Sizing | 40B | Unsized | 50B |
| Tensile modulus (GPa) | 294 | 290 | 588 |
| Tensile strength (MPa) | 5490 | 6000 | 3920 |
| Strain to failure (%) | 1.9 | 2.1 | 0.7 |
| Electric resistivity (Ω · cm) | 1.4 · 10−3 | 1.45 · 10−3 | 0.7 · 10−3 |
| Thermal conductivity (Cal/cm · s · °C) | 0.0839 | — | 0.363 |
| Carbon content (%) | 96 | (96) | >99 |
| Final HTT range (°C) | 1100–1600 | 1100–1600 | 1800–3000 |
| Diameter (μm) | 5 | 5 | 5 |
| Density (g cm−3) | 1.81 | 1.78 | 1.93 |
The basic electrochemical properties of these CFs, average delithiation capacities and coulombic efficiencies, were reported by Hagberg et al [8] (table 2). The low capacity M60J HM fibre was chosen in order to elucidate how its structure differs from a high capacity fibre.
Table 2. 1st and 10th cycle average delithiation capacity and 10th cycle coulombic efficiency (CE) for CFs cycled at 0.1 C rate (based on C = 372 mAh g−1) [8].
| CF | 1st cycle capacity [mAh g−1] | 10th cycle capacity [mAh g−1] | 10th cycle CE [%] |
|---|---|---|---|
| T800 | 265 | 243 | 99.9 |
| IMS65 | 358 | 317 | 99.5 |
| M60J | 159 | 154 | 99.5 |
2.2. Mechanical tests
Previously, Jacques et al [16] measured the maximal free expansion in the axial fibre direction due to lithiation for T800 and IMS65 cycled at 0.11 C and 0.08 C, respectively. Electrochemical cycling at 1 C refers to full charge in one hour. The results showed that the fibres underwent longitudinal free expansion of 1.05% and 1.03%, respectively, while no data have so far been reported for M60J.
Here we therefore report on M60J using the same method as in [16]; measuring the change in reaction force on a CF tow at constant strain during electrochemical cycling, in the knowledge that the tensile stiffness remains unchanged during electrochemical cycling [17]. Tensile specimens were manufactured from dry M60J 6 K fibre tows used as supplied, according to the method detailed in [16] (figure 1(a)). Three pristine specimens of M60J were used for reference tests, which were repeated after electrochemical cycling. Each test was carried out at a displacement rate of 0.1 mm min−1, with a sampling rate of 10 Hz, up to a maximum load of 250 N. The stiffness was extracted from the linear section of the measured force-displacement curves using a least-squares fit.

Figure 1. (a) M60J specimen; (b) Schematic illustration of the pouch cell mounted in the microtester, from [16].
Download figure:
Standard image High-resolution imageThe M60J specimens were also used as electrodes in Li-ion battery pouch cells, made according to [16] but with 250 μl rather than 150 μl of LP40 electrolyte (figure 1(b)). Electrochemical cycling of these pouch cells was monitored using a BioLogic VSP potentiostat controlled with BioLogic EC-Lab software. Each cell was subjected to 5 galvanostatic cycles, 0.002–1.5 V versus Li+/Li° at an applied current of 0.1686 mA, corresponding to a 0.1 C charge rate based on the theoretical maximum capacity for graphite of 372 mAh g−1, and mCF = 4.53 mg. The HM M60J fibres are significantly stiffer than the IM fibres used in [16], and this combined with the load restriction of 250 N on the microtester meant that the pouch cell bag had to be repeatedly re-strained in order to relax sufficiently to allow the entire amplitude of intercalation strain to be captured. A reference cell was made in order to quantify the force relaxation of the pouch cell bag, with the CFs cut prior to sealing the pouch. This cell was then subjected to a constant strain equivalent to that experienced by the CFs in a typical expansion test, while the force relaxation was measured.
To measure if the CFs were under tension at maximum intercalation strain the piezo-electrochemical transducer (PECT) effect described in [18] was utilised. When fully intercalated a cyclic force of amplitude ΔF = 20 N was applied and the open circuit potential (OCP) measured. The CFs were confirmed to be in tension if the OCP responded linearly to the cyclic force. In order to calculate the intercalation strains the force/time relaxation curves of the pouch cells were corrected for the reference cell, and the force changes ΔF of the lithiation expansion (positive) and delithiation contraction (negative) were obtained. The intercalation strains ε were calculated using equation (1), where k is the stiffness of the fibre tow.

After each expansion test the specimens were removed from the pouch cells and subjected to a tensile test using the methodology described above in order to verify the stiffness measurement.
2.3. Electron Microscopy—SEM and HR-TEM
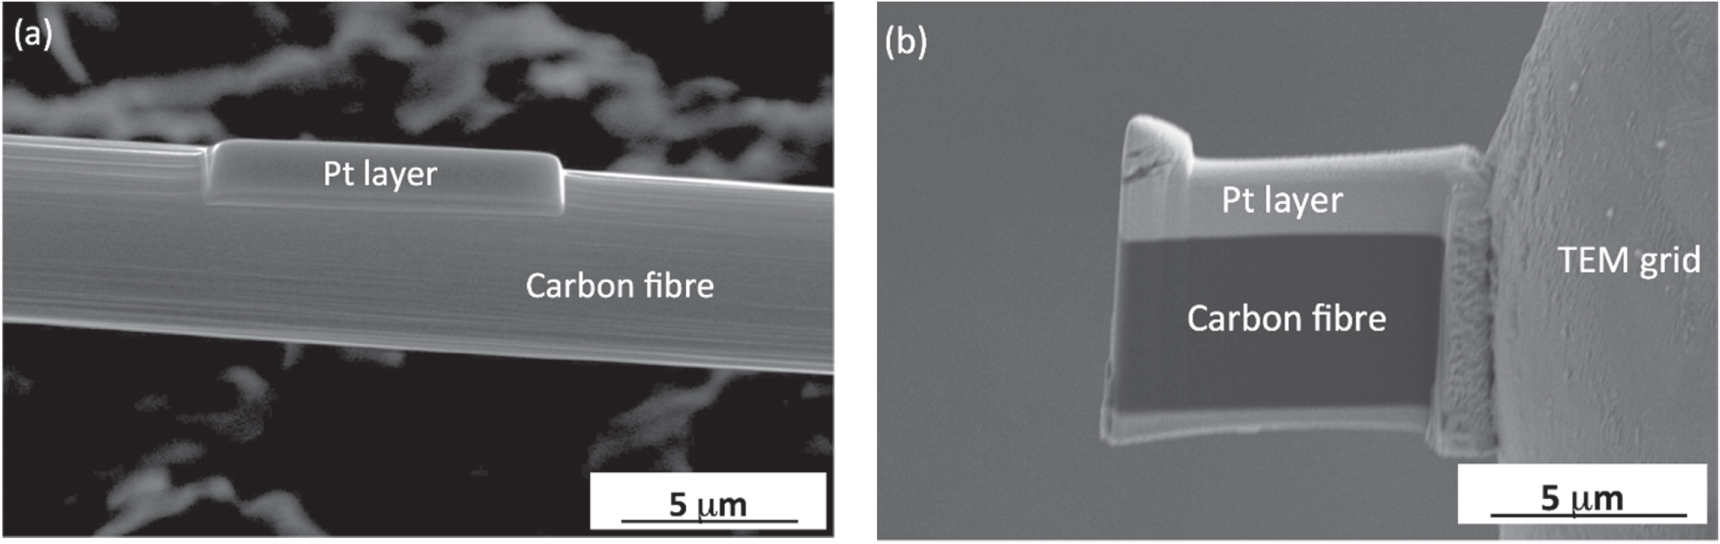
A Titan 80–300 TEM, operated at 300 kV, was used to analyse the carbonaceous structure in the cross-sections of the CFs. In order to prepare TEM specimens with a thickness of less than 100 nm, the in situ lift-out technique [19] was employed using an FEI Versa 3D workstation, a combined focused ion beam microscope and SEM (FIB/SEM), equipped with an Omniprobe micromanipulator. To protect the very surface of the CF from ion damaging during the specimen preparation procedure, a layer of Pt was deposited with the aid of the gas injection system in the workstation (figure 2(a)). Subsequently, a small piece was cut out using the FIB, transferred to a 3 mm TEM grid using the micromanipulator, and finally ion polished down to less than 100 nm thickness with the FIB (figure 2(b)).

Figure 2. SEM micrographs showing the TEM specimen preparation procedure. (a) A CF with a Pt layer on top to protect the surface. (b) A TEM specimen with axial cross-section of the CF.
Download figure:
Standard image High-resolution image2.4. Raman spectroscopy—ex situ and in situ
2.4.1. Ex situ Raman spectroscopy
All ex situ Raman spectra were obtained using a Dilor Labram micro-Raman spectrometer equipped with a confocal microscope (Olympus BX40) and an objective (Olympus LMPlan FI) with a 50× magnification and a 0.5 numerical aperture. All the measurements were performed at 23 °C by employing a HeNe laser (632.82 nm) as excitation source. The ca. 5 μm diameter laser focus allows for analysis of lateral surfaces and cross-sections of single CFs.
Data were collected using a 100 μm slit, 1800 lines/mm grating and no filter was applied. Spectra were acquired in back scattering mode with a charge-coupled device (CCD) collector for both first- and second-order regions: 900–1760 cm−1 and 2320–3000 cm−1, respectively. To increase the signal-to-noise ratio (S/N), all spectra contained 40 acquisitions with an exposition time of 30 s each.
All spectra were analysed using the commercial software PeakFit v.4, by Systat Software Inc. The spectra were corrected through the subtraction of a linear baseline to eliminate the fluorescence of the background and a Savitzky-Golay smoothing was applied to further improve the S/N. Peaks were fitted for Raman shift, intensity, area and width using a Voigt function. For comparison purposes, the intensity of each spectrum was normalised to the band of highest intensity and the spectra were shifted arbitrarily along the vertical axis to give a clearer representation. Since the maximum experimental window for a spectrum is 900 cm−1, four windows were partially overlapped to obtain the full spectrum of the same spot on the surface.
The ex situ Raman spectroscopy of single virgin CFs monitored the shifts of the D, G and G' bands for IMS65 and M60J as a result of macroscopic axial tensile strain—to allow us to exclude shifts caused by free expansion of the CF in the in situ tests. The single CFs were fixated on an aluminium foil frame with a cyanoacrylate adhesive (Loctite Superglue) and the frame mounted in a tensile rig operated manually by screws (figure 3)—all put in the translational stage of the Raman spectrometer. A Raman spectrum was first acquired on the unloaded fibre and subsequently in intervals on the strained fibre whereby the positions of the Raman bands could be analysed versus the applied strain and the strain sensitivity of the Raman shift determined by a linear fit. To avoid any interference from the clamping forces all spectra were acquired from areas centrally on the CFs, away from the mounting points.

Figure 3. Photos and schematic of the single CF specimen for ex situ Raman spectroscopy under tensile load and the test rig applied.
Download figure:
Standard image High-resolution image2.4.2. In situ Raman microscopy
In situ Raman microscopy was performed in order to follow the changes in the Raman spectra as a function of the lithium insertion and extraction in IM T800 and IMS65 as well as HM M60J, ultimately providing information on both the insertion mechanism and the electrode state during the charge/discharge process.
A small CF bundle (ca. 5 mg) was dried overnight in a vacuum oven at 80 °C. Subsequently a spectro-electrochemical cell, described in detail in a previous work [20], and derived from a previous cell used for x-ray diffraction [21] and x-ray absorption spectroscopy [22] was assembled inside an Ar-filled glovebox. During this procedure the dry CFs were spread on a copper (Cu) foil current collector, putting the foil at the top of the cell in contact with the Raman-transparent quartz window (figure 4). Small holes were made in the Cu foil to allow the laser beam to reach the CF electrode. A glass fibre fabric was used as separator (Whatman GF/A glass fibre filter) and Li-metal as the counter electrode. An LP30 liquid electrolyte, 1 M LiPF6 in ethylene carbonate and dimethyl carbonate (EC:DMC, 1:1) was allowed to soak the electrodes and the separator. Due to problems of luminescence at low potentials, 1 M LiPF6 in propylene carbonate (PC) was used for a few M60J tests, but as no appreciable improvements were observed, the majority of the tests used LP30 (table 3).

Figure 4. Photo (left) and cross-section schematic (right) of the spectro-electrochemical cell used for the in situ Raman microscopy.
Download figure:
Standard image High-resolution imageTable 3. Selected in situ Raman spectroscopy sample and test data.
| CF | mCF (mg) | Electrolyte | Electrolyte volume (μl) | Applied current (μA) |
|---|---|---|---|---|
| T800 | 6.2 | LP30 | 60 | 115 |
| IMS65 | 4.0 | LP30 | 75 | 50 |
| M60J | 7.4 | LiPF6 in PC | 60 | 138 |
| M60J | 7.7 | LP30 | 60 | 143 |
The voltage between the two electrodes was measured under OCP until it stabilised and an equilibrium potential was reached. Electrochemical cycling was performed under galvanostatic conditions using a potentiostat/galvanostat (Gamry Instruments) between 0.002–1.5 V vs Li+/Li° at a rate of C/20 with respect to the theoretical capacity of graphite (i.e. 372 mAh g−1). The Raman spectra were acquired at different voltages using an Ar laser with a wavelength of 514 nm and an initial power of 50 mW as excitation source (the power measured on the sample was less than 10 mW). Each spectrum was acquired in the range 1000–3300 cm−1 for 20 min, which is a short time compared to the total duration of the charge/discharge process. The red- and blue-shifts discussed are all with respect to the Raman shifts. The Raman confocal microscopy set-up was a laser system (BeamLok 2060, Spectra-Physics) and a spectrometer (XY 800, Dilor), equipped with an optical microscope (BH2, Olympus) and a CCD camera (Symphony, Horiba Jobin Yvon).
3. Results
First we assess the axial expansion of M60J CF due to lithiation. With this data we can exclude influence of free expansion strains on in situ Raman spectra. We then characterise the carbonaceous microstructure of IM and HM CFs to enable us to understand and link differences in the Raman responses to the prevailing lithium ion insertion mechanisms for IM and HM CF identified by in situ confocal Raman spectroscopy. Armed with this we can explain how the multifunctional performance of CF is related to microstructure and crystal size.
3.1. Stiffness and axial expansion as a function of charge/discharge
The results from the virgin M60J CF specimens are used as a baseline for evaluation of the influence of electrochemical cycling as it is known that the stiffness remains unchanged during electrochemical cycling. This was confirmed with the post-cycling tensile tests that showed no measureable stiffness changes after electrochemical cycling.
Moving to the role of electrochemical cycling for M60J CF expansion, the combination of measurements of potential as a function of capacity, i.e. lithiation/delithiation, (figure 5(a)), and force response upon cycling (figure 5(b)) shows the highest intercalation strain,  to occur for the first charge/discharge cycle
  A lower capacity (<80 mAh g−1, figure 5(a)) than previously reported for M60J (154 mAh g−1, [8]) was obtained for all cells tensioned prior to cycling. It is suspected that this is due to the altered cell format which includes end tabbing of the CF tow, as well as possible transport issues caused by a large number of CF filaments in the tow [7]. Previous work has however shown that the intercalation strain is linear with capacity [16], and so a likely maximum strain can be extrapolated from these results.

Figure 5. (a) Lithiation/delithiation capacity-potential curves for the M60J pouch cell. (b) Force variation as a function of electrochemical cycling. A piezo-electrochemical transducer (PECT) test was initially performed to ensure that the fibre was loaded in tension.
Download figure:
Standard image High-resolution image3.2. Graphitic microstructure
By using high-resolution transmission electron microscopy (HR-TEM) micrographs of the longitudinal cross-sections of the M60J, IMS65, and T800 CFs (figures 6(a)–(c)) including their convergent beam electron diffraction patterns (insets) the graphitic microstructural ordering can be analysed in detail. For M60J the size of the graphite crystals is relatively large, >300 Å along the longitudinal direction and stacking to >100 Å in thickness, with an average interlayer spacing of the (002) layers of 3.47 Å. The size of the electron beam focus is only a few nanometres, which means that the convergent diffraction patterns reflect the local crystallographic information from a volume of a few nanometres in width and approximately 100 nm in depth—and for M60J the patterns are sharp, small, and round disks, hence matching well with the HR-TEM data. In contrast both IMS65 and T800 show highly disordered structures, with a large number of very small crystals—for IMS65 with average length, La = 19 Å, and thickness, Lc = 28 Å, while for T800 the crystals are 18 Å both in length and thickness. The average (002) interlayer spacing is 3.49 Å for IMS65, close to the value for M60J, while a much larger spacing of 3.70 Å is found for T800. Here the (002) diffraction patterns appear as more diffuse arcs, which implies that within the small information collecting volume the orientation of the graphene layers varies significantly. All these data will serve as a basis for the discussions below of structure-property relationships, especially with respect to the role of microstructure for electrochemical capacity and Li-ion intercalation mechanisms.

Figure 6. HR-TEM micrographs showing the microstructure of the CFs along the longitudinal direction for (a) M60J, (b) IMS65, amd (c) T800. The insets are the convergent beam (002) diffraction patterns.
Download figure:
Standard image High-resolution image3.3. Correlations between tensile strain, electrochemical properties and Li-ion intercalation mechanism
The basis for CF stress and strain analysis at the molecular level by the resulting Raman shifts is the anharmonicity of the carbon—carbon sp2 bond and that any macroscopic deformation also involves stretching or compression of these bonds [23, 24]. For CFs a tensile stress applied in the direction of the fibre axis has been shown to result in a Raman bands shift to lower wavenumbers, while the opposite occurs under compression, and the stress/strain sensitivity to be proportional to the fibre modulus—a combined effect with layer slippage and crystal rotation, which does not affect the position of the sp2-induced Raman bands. The contribution of bond deformation to the total strain increases with crystal orientation along the fibre axis [25], which also leads to higher tensile modulus [12].
The Raman spectra analysis of the virgin T800, IMS65, and M60J CFs focus on the two main bands typical of carbonaceous materials with sp2 hybridised carbon atoms: the D band (due to the ring breathing mode of A1g symmetry) at ca. 1330 cm−1 and the G band (due to in-plane bond-stretching) at ca. 1580 cm−1. Very similar spectra are obtained for the IM CFs T800 and IMS65, while the spectrum from the HM CF M60J is distinctly different (figure 7). The Raman spectra are all in line with the literature [8], but for M60J all bands are sharper, indicative of a higher degree of order [26], and especially it renders the D' band clearly detectable at ca. 1620 cm−1 as a feature together with the G band. Furthermore, the second-order region (>2000 cm−1) is for M60J dominated by the presence of the G' peak at ca. 2659 cm−1, both for the cross section (not shown) and the lateral surface, while there is no clear peak in this region for T800 or IMS65.

Figure 7. Raman spectra in the region 500–2950 cm−1 for the lateral surfaces of T800, IMS65 and M60J CFs.
Download figure:
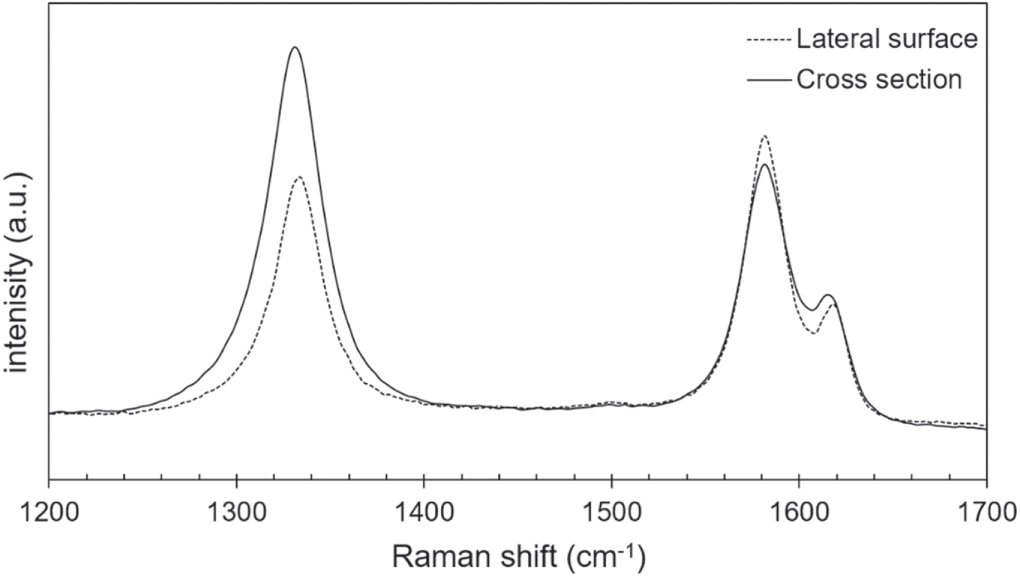
Standard image High-resolution imageThe first-order Raman spectra acquired from the cross section and the lateral surface of the HM M60J show them to be remarkably different; the ratio between the D and the G bands (R = ID/IG) increases from 0.8 for the lateral fibre surface spectrum to 1.56 for the cross section (figure 8, table 4). No such changes are found for the IM fibres, for which R is practically constant.

Figure 8. Raman spectra in the region 1000–1800 cm−1 from the cross section and the lateral fibre surface of M60J, respectively.
Download figure:
Standard image High-resolution imageTable 4. Selected data derived from the Raman spectra and fits.
| CF measurement | λD (cm−1) | fwhmD (cm−1) | λG (cm−1) | fwhmG (cm−1) | R (ID/IG) | La (ID/IG) (Å) | La (fwhmG) (Å) |
|---|---|---|---|---|---|---|---|
| T800 cross section | 1332 | 161 | 1585 | 86 | 1.43 | 58 | 48 |
| T800 lateral surface | 1338 | 172 | 1590 | 92 | 1.46 | 57 | 54 |
| IMS65 cross section | 1336 | 156 | 1587 | 91 | 1.33 | 62 | 51 |
| IMS65 lateral surface | 1339 | 168 | 1592 | 89 | 1.46 | 57 | 49 |
| M60J cross section | 1330 | 37.6 | 1582 | 31 | 1.56 | 54 | 107 |
| M60J lateral surface | 1332 | 29.7 | 1581 | 26 | 0.80 | 103 | 112 |
By using two different approaches, the Tunistra and Koenig relationship [27] and the measure suggested by Mallet-Ladeira et al [28], the average crystal length (La) can be estimated in two ways. The former approach uses the ratio R, while the latter uses the full width at half maximum for the G band (fwhmG). For the cross section of M60J the two obtained La differ significantly, almost by 100%, while for all other spectra the average difference in La is less than 8 Å, <25% (table 4). In addition, for the IM T800 and IMS65 the fibre cross sections and the lateral fibre surface have more or less the same La, while for the HM M60J there is an ambiguity created by the two measures.
Having established a baseline for the Raman spectroscopy analysis by the measurements on virgin fibres above, the first-order region spectra for IMS65 and M60J CFs under tension show all bands to shift towards lower wavenumbers with applied strain (figure 9, table 5). While only the spectra at zero and maximum strains are reported for clarity the shifts are approximately linear versus applied strain, and in line with the literature for other CFs [24, 25], while no strain effects were observed for the bandwidths or the ratio R.

Figure 9. First-order Raman spectra in the region 1200–1700 cm−1 from unstrained and strained IMS65 and M60J CFs.
Download figure:
Standard image High-resolution imageTable 5. Raman spectra data for IMS65 and M60J CFs upon applied strain.
| CF | Band | λ0 (cm−1) | λat failure (cm−1) | Strain to failure (%) | Strain dependence (cm−1 per %) |
|---|---|---|---|---|---|
| IMS65 | D | 1336 | 1325 | 1.54 | −8.3 ± 0.9 |
| G | 1587 | 1578 | −7.0 ± 0.9 | ||
| M60J | D | 1330 | 1324 | 0.72 | −7.9 ± 0.9 |
| G | 1581 | 1573 | −12.6 ± 0.9 | ||
| G' | 2659 | 2642 | −28.0 ± 1.0 |
Armed with these two sets of Raman data, for virgin and strained fibres, especially the strain sensitivity can now be compared to shifts resulting from electrochemical cycling—analysing molecular changes due to lithiation and how this affects the Raman spectra—and if/how it differs from the macroscopic tensile strain effects.
Prior to the in situ spectro-electrochemical Raman studies we need to establish the capacities for the different CFs—using the pouch cells created and noting that for the half-cells versus Li-metal charge and discharge refers to Li-ion (de-)insertion/lithiation into/of the CF and is associated with a change in the electrode voltage (or potential). The capacities for the first charge, i.e. the first delithiation: 231 mAh g−1 for T800, 252 mAh g−1 for IMS65, and 146 mAh g−1 for M60J, all compare reasonably well to the literature (table 2, [8]).
The corresponding series of Raman spectra for the first discharge of the IMS65, T800 and M60J CFs initially show all the features found for the virgin CFs. For IMS65 (figure 10(a)) the D and G bands are found at ca. 1365 and 1591 cm−1, respectively, broad and partially overlapping. For T800 the D and G bands are found at ca. 1366 and 1591 cm−1, respectively, broad and partially overlapping, while the second-order region is almost featureless, and for M60J more distinct bands are present at 1352 cm−1 (D), 1586 cm−1 (G), and 2709 cm−1 (G') (figures 10(b) and 11). Data from the discharge cycles of are provided in Tables as supporting information. The IM CFs T800 and IMS65 Raman spectra changed very similarly; upon initial discharge/lithium insertion the G bands red-shift by ca. 30 cm−1 and 17 cm−1 for T800 and IMS65, respectively, while the D bands do not follow any particular trend, and R increases at lower potentials.

Figure 10. Raman spectra acquired for (a) IMS65 and (b) T800 during the first discharge. Vertical lines indicate the initial positions of the two main Raman bands (D and G).
Download figure:
Standard image High-resolution image
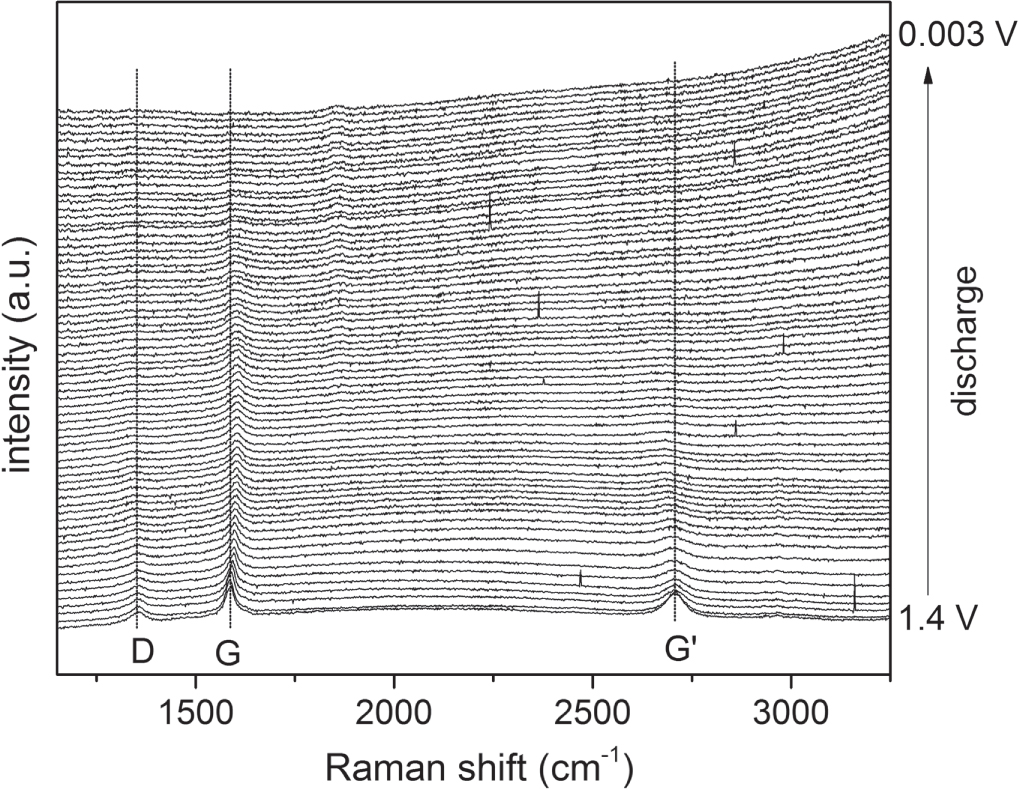
Figure 11. Raman spectra acquired for M60J during the first discharge. Vertical lines indicate the initial positions of the three main Raman bands (D, G and G').
Download figure:
Standard image High-resolution imageIn contrast, the HM M60J G band is initially observed to blue-shift from 1586 cm−1 at OCP to 1605 cm−1 at 145 mV and to broaden and have its intensity reduced. As the potential is further decreased the band continues to broaden and moves slightly back towards lower wavenumbers.
The D band is weak already in the OCP spectrum and upon discharge it broadens as its intensity is further decreased, while its position is constant. The ratio R has no clear trend with potential; from 450 to 150 mV it decreases, but this is merely a consequence of the strong reduction in intensity of the D band.
Finally, the G' band continuously broadens and red-shifts, from 2709 cm−1 to 2665 cm−1 upon discharge—hence in the opposite direction to the G band. Similar to the D band the G' band disappears at ca. 150 mV.
All the band shifts observed during the first lithiation (discharge) were almost completely recovered during the first delithiation (charge), and reappearing again during a second discharge cycle, which indicates a nicely reversible process.
4. Discussion
Overall the obtained results confirm the previous observed general differences in microstructure between IM and HM CFs by Hagberg et al [8]. However, the previously reported difference in crystallinity for the HM fibre surface and core regions is not confirmed. In contrast, the HR-TEM data reveal a homogenous, highly ordered, microstructure for the entire HM M60J fibre. Using the procedure by Hagberg et al [8] to calculate the in-plane crystal size La from the ratio R, we obtain 100–110 Å for the surface and 54 Å for the core for the HM fibre (compared to approximately 60 Å for both the surface and the core of the IM fibres). This must not, however, be interpreted as any skin-core effect for the HM fibre; it is rather due to that R also depends on the crystal orientation and not only crystal size. This suggests that the crystals in the HM fibre are larger and more oriented along the fibre axis than in the IM fibres. This is consistent with both HTT and mechanical properties differences as well as with the HR-TEM observations. Indeed, when we use the Mallet-Ladeira [28] approach of only assessing the G band (fwhmG) we obtain 110 Å for both surface and core of the HM M60J fibre.
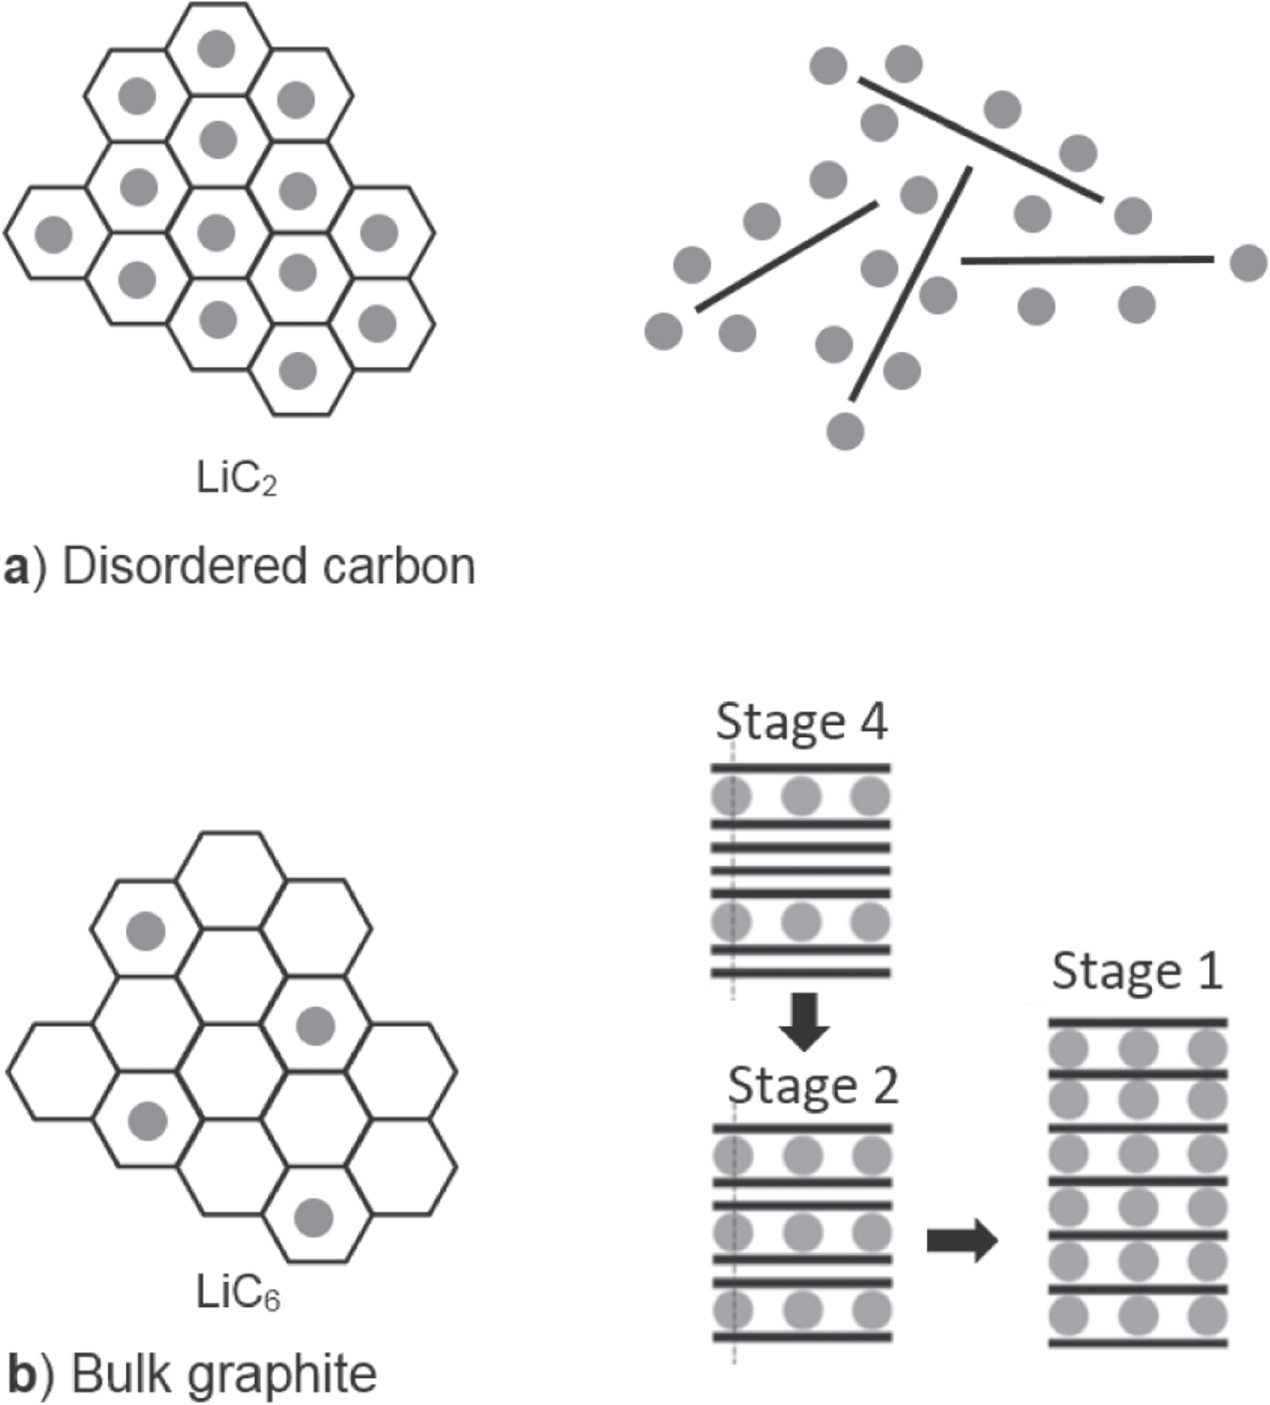
The results from the in situ Raman analysis of the IM CFs are in very good agreement with the results obtained by Inaba et al for MCMB treated at low temperatures [29], by Endo et al for PPP-based disordered carbon [30], and by Pérez-Villar et al for glassy carbon [31]. Particularly, the observed continuous red-shift of the G band as the potential decreases is common to all these partly disordered carbon materials and much too large to be explained by the free expansion. A plausible explanation suggested by Inaba et al [29] is that the lithium predominantly is stored as cations, while the carbon host, here the CF, becomes negatively charged as it accepts electrons. In detail, the charges are suggested to be found in an antibonding π band of the small graphite-like crystallites, which then reduces the force constants of the C–C bonds, reducing the vibration frequency, and hence the Raman G band appears at lower wavenumbers. This implies that the lithium ions are inserted between the graphite-like layers in the IM CFs and thus the mechanism to resemble that of disordered carbons. Due to their disordered and open microstructure, these materials feature additional sites to graphite on the carbon lattice surfaces and edges to coordinate lithium ions (figure 12(a)).

Figure 12. Schematic showing the Li-ions (grey circles) inserted in disordered carbon (a) and intercalated in graphite (b). On the left the Li-ions at sites in the hexagonal carbon lattice are illustrated. On the right surface and edge Li-ion coordination in disordered carbon and the staging mechanism in bulk graphite are depicted, respectively.
Download figure:
Standard image High-resolution imageFor the HM M60J fibre the behaviour of the Raman bands upon cycling has striking similarities with both microcrystalline graphite [32], graphite [33] and high treatment temperature mesocarbon microbeads (MCMBs) [29], and hence likely also a staging similar to that of graphite (figure 12(b)). Particularly, the blue-shift of the G band is associated to the increase in the force constants of the in-plane C–C bond accompanying lithium insertion. This has been linked to the diluted stage, n = 1, with lithium ions inserted randomly between the graphite-like layers. Furthermore, the G band of highly crystalline graphite splits in two upon lithium ion insertion and formation of staged structures n ≥ 3. Yet, for the HM M60J fibre no such split is observed implying that no distinct staged structures are formed. Similar observations were made by Inaba et al [29] for MCMB treated at 2800 °C. However, the here observed broadening of the G band anyhow suggests a minor amount of staged structure to be present. We suggest the turbostratic graphitic structure of M60J to obstruct the staging as the crosslinks between the misaligned graphite layers can frustrate the reorganisation of the stacking sequence from AB to AA. The link between turbostratic disorder and electrochemical behaviour of disordered carbons was investigated on MCMBs by Zheng and Dahn [34], and indeed they noted the disappearance of stages 3 and 4.
As a further support the red-shift upon lithium insertion behaviour of the G' band for the HM CF is in very good agreement with that reported for graphite by Sole et al [32]. The red-shift is attributed to in-plane biaxial strain in the carbon layers and here our tensile tests demonstrate the G' band to be the band most sensitive to the lattice strain. However, the red-shift observed (max. 43 cm−1) is much too large to be explained only by the strain from free expansion during lithiation; with a strain sensitivity of 12.6 cm−1/% strain this correlates to a free expansion of more than 3%. The observed capacity of 146 mAh g−1 can only explain a strain of approximately 0.25% and consequently only a 3.2 cm−1 shift, why other factors, e.g. electronic doping, must contribute to the red-shift.
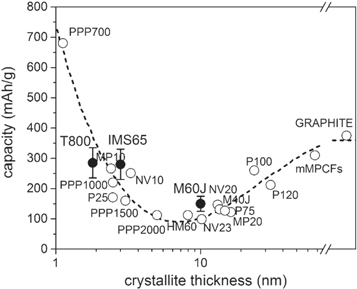
Combined the above explains the significant role of the microstructure for the electrochemical performance of our IM and HM CFs, highlighting the importance of microstructural disorder, turbostratic misalignment, and crystallite size. Using a layout first proposed by Endo et al [30, 35], the average electrochemical capacities of the IM and HM CFs from the current study and references [8, 16] as function of the crystal thickness, measured by HR-TEM, are provided together with data for different carbon electrodes incl. perfectly crystalline graphite with a maximum theoretical capacity of 372 mAh g−1 (figure 13). Starting from graphite, the capacity decreases as a function of crystallite thickness until approximately 8 nm, connected with increased frustration of lithium insertion in the graphitic parts of the material by increased microstructural disorder and turbostratic misalignment. This is exactly what happens in the M60J HM fibre and why it is close to the minimum of the curve. In contrast, as the disorder increases even further, moving to even smaller crystallite thicknesses and glassy carbons and other partially disordered carbons, the capacity increases again. Here the lithium insertion and storage is predominantly in the amorphous parts of the materials and indeed the two IM fibres both have significantly higher capacities than the HM fibre. Similarly, fibre strength is controlled by crystal size (length) as it controls defect size [12]. The tensile strength of the IM fibres is around 6000 MPa, whereas that of the HM fibre is close to 4000 MPa. This difference in tensile strength corresponds well to the difference in crystallite length, reported here to be close to 20 Å and 110 Å for the IM and HM fibres, respectively.
Download figure:
Standard image High-resolution image
Fibre stiffness is controlled by crystallite size and orientation. Highly oriented large crystallites will result in high stiffness [12]. Previous work by some of the authors demonstrated tensile stiffness of the IM fibres to be constant during electrochemical cycling [36]. Furthermore, the same study showed the capacity of the IM fibres studied here (IMS65 and T800) to be unaffected by mechanical tensile loading.
5. Conclusions
From the relationships found between the carbonaceous microstructure and the electrochemical performance we have confirmed the significant feature of having small crystals, with limited directional orientation, to reach high storage capacity for CF based electrodes. This is why the IM CFs with a lithiation mechanism reminiscent of disordered carbons outperform the HM CF with its larger crystallites highly oriented along the fibre direction. In contrast, the HM CF has a lithium intercalation mechanism close to that of graphite, but with impeded formation of staged structures due to the persisting presence of turbostratic disorder and crosslinking between crystallites. Armed with the here derived understanding of the two competing lithiation mechanisms for HM and IM CFs, future structural and flexible electrodes/batteries can be designed—where stiffness is traded for electrochemical capacity and mechanical strength, and vice versa.
Acknowledgements
LA, FL and DZ acknowledge financial support from VINNOVA, via LIGHTer Strategic Research Area 1 Modelling. GL, JH, SJ, AB, JW and PJ acknowledge the financial support from the Swedish Energy Agency project 'Structural batteries for efficient vehicles' (#37712-1). PJ also acknowledges the continuous support from several of Chalmers Areas of Advance: Materials Science, Energy, and Transport, especially the Researcher-in-Residence grant to LS and financial support to AB from the joint Energy and Materials Science profile Materials for Energy Applications through Chalmers Battery Initiative. RH, DZ and GL also acknowledge financial support from the Swedish Research Council, projects 621-2012-3764 and 621-2014-4577. Alistore European Research Institute is gratefully acknowledged for its financial support through the post-doc grant of AB.