

Abstract
In this paper, we present an investigation of the solid-liquid phase-transition process of ice based on terahertz time-domain spectroscopy (THz-TDS), which can precisely demonstrate the low-frequency vibrational and rotational modes in gaseous or condensed state materials. The intensity of the transmitted signal is used to characterize the interaction between the terahertz wave and the melting ice. The structure transition lead to the change of physical properties such as dielectric constant with the melting of the ice. When the temperature gradually rises, the H2O molecules on ice surface overcome the hydrogenbond interaction and start to rotate under the driving of THz field which enhancing the interaction between water molecules and incident terahertz radiation. As H2O is a polar molecule, a dipolar moment will be induced, which contributes to the dielectric polarization. An analysis of the intensities and dielectric constant of THz-TDS signal peaks reveals the dynamic and continuous melting process on the surface of ice at room temperature.
Export citation and abstract BibTeX RIS

Original content from this work may be used under the terms of the Creative Commons Attribution 3.0 licence. Any further distribution of this work must maintain attribution to the author(s) and the title of the work, journal citation and DOI.
1. Introduction
Surface melting greatly affects material properties, and is an important factor in many phenomena such as friction and adhesion. Considerable attention has been focused on the surface melting of ice in particular since Faraday first proposed in 1859 that the extreme slipperiness of ice is caused by a thin film of liquid water formed between an incident force and the ice surface by regelation. Recently, this attention has been motivated by the significant role played by the surface melting of ice in many natural phenomena such as snow and ice disaster and melting glaciers. As a result, the solid-liquid phase transition of water has been the subject of numerous experimental and theoretical investigations [1–6].
Over the past few decades, Raman spectroscopy (RS) and infrared (IR) spectroscopy have been widely employed to characterize hydrogen bond stretching in liquid water and ice. Spectroscopic explorations of the hydrogen bond have been conducted extensively for various applications, but as yet the structural and dynamical properties of liquid water have long been are not fully understood [7–10]. However, with the recent development of generation and detection technologies for terahertz (THz) radiation [11–13]. THz spectroscopy has been well exploited and applied in many fields such as pharmaceuticals exploitation [14], security inspection [15], and material characterization [16, 17]. By processing and analyzing the terahertz time-domain waveforms, the refractive index, extinction coefficient and real and imaginary parts of the dielectric function can be easily obtained. Therefore, terahertz radiation can extract valuable information, such as low-frequency vibrational motion and vibration of small gas molecules as well as rotation and twisting motion of small molecules [18–22]. It also has the potential to explore the dynamics of hydrogen bonding systems [18]. In particular, since the introduction of the terahertz spectrum, many researchers have studied water as an important liquid in biological and chemical systems to study the kinetics of water molecules through intermolecular hydrogen bonds. In addition, Takeya et al [23–25] reveal the molecular information of ice, tetrahydrofuran (THF) hydrate, propane hydrate, and sulfur hexafluoride (SF6) hydrate in terahertz region. The solute-induced change in the dynamics of water was probed directly by terahertz spectroscopy. THz-TDS was proven to be a very sensitive tool for hydrogen-bonded networks [26]. THz-time-domain spectroscopy (THz-TDS) technology enhances clathrate hydrates in the THz region for several years.
Therefore, THz spectroscopy can be more favorably applied than other techniques, such as Raman spectroscopy and infrared spectroscopy, for probing the dynamics of water molecules. However, to the best of our knowledge, THz spectroscopy has not yet been applied for the analysis of the solid-liquid phase transitions of water. The spectral region ranging from 0.1 THz to 3 THz can provide valuable information regarding collective vibrational or torsional modes of hydrogen bonds [26]. The relaxation-like dielectric dispersion in the low-frequency portion can be attributed to the rotational motions of the coordinated water molecules in the hydrate crystal, which leads to dielectric polarization. The dielectric spectrum of liquid water in the subterahertz frequency region also shows the relaxation characteristic, which is related to the reorientation of water molecules through rotational motion under the driving of electric field [27–29]. Similar with theelectric-field-induced reorientation of H2O molecules in liquid water [30]. In hydrate crystals, the rotation motion will be more difficult due to the interaction between H2O molecules. In this article, THz time-domain spectroscopy (THz-TDS) is experimentally applied to characterize the solid-liquid phase transition process of water by analyzing the transmission signal strength and dielectric constant under different melting conditions. We mainly explore the dynamic and continuous melting process on the surface of ice at room temperature.
2. Experimental methods
Ice samples were prepared by packing deionized water in 10 cm × 15 cm × 2.5 cm transparent polypropylene containers, which have a strong permeability to THz radiation. The filled containers were then placed in on a rack of a conventional freezer at −20 °C for at least 12 h. The ice samples were then taken from the freezer and immediately subjected to THz-TDS analysis, during which the ice was allowed to melt at room-temperature (22 °C) and 43% humidity.
The experiments employed a conventional transmission-type THz-TDS system. In this system, a Ti:sapphire femtosecond (fs) laser beam with a central wavelength of 800 nm, a pulse width of 100 fs, and a repetition rate of 80 MHz is split into a pump beam and a detection beam. The THz radiation employed in testing were in the range of 0.1 THz–3 THz which equivalent to 3.33 cm−1–99.9 cm−1 (wavenumbers), or 0.004 eV–0.012 eV photon energy. The spot size of the pump beam is 5 mm. The detector is composed of ZnTe, and the detection apparatus uses standard lock-in technology. All trials were performed under the discussed ambient conditions. We obtained THz-TDS spectra of both samples and references, and the time-domain data were transferred to a computer for further analysis.
3. Results and discussion
In order to investigate the interaction between the ice and the terahertz wave during melting, we measured the ice cube at room temperature 22 °C and collect the time-domain spectra. Figure 1 shows the intensity of the THz-TDS transmission signals of an ice sample obtained at time intervals over a period of several minutes. We note that the amplitude of the transmitted pulse (EP) reduces, and the time delay (τ) increases as the melting process progresses, which indicates both the dielectric loss and dielectric constant change with the ice melting [31].
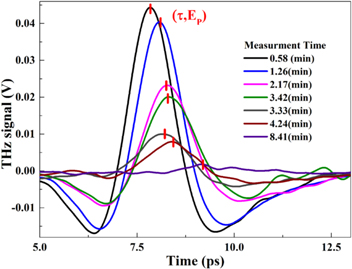
Figure 1. THz-TDS signals of an ice sample obtained at time intervals during the solid-to-liquid phase transition process of water. The time delay (τ) and peak signal amplitude (EP) of each signal are marked.
Download figure:
Standard image High-resolution imageFigure 2 shows the values of EP and τ for THz-TDS signals as a function of the measurement time. The peak intensity of the THz signal obtained at 0.58 min exhibited a time delay (τ) of about 7.8 ps and had an amplitude (EP) of 44.3 mV, whereas the peak signal intensity obtained at 8.41 min exhibited a τ of about 9.1 ps and an EP of 1.8 mV. The spectral changes are associated with the phase-transition process on the ice surface, and provide information regarding changes in the local environments of the water molecules. The structure transition lead to the change of physical properties such as dielectric constant. However, in this work, the driving force is the temperature and the THz electric field. Pauling pointed in a previous paper that the molecules in crystal may change from the oscillatory state to the rotation state if they have enough kinetic energy to overcome the lattice field potential. At low temperature, the molecules in crystal oscillate around the equilibrium position; as the temperature increases, the kinetic energy increases and binding force weakens; finally, a transition from oscillation to rotation occurs once the temperature reaches the critical value. The critical temperature of a diatomic molecular crystal can be estimated by the following expression:

where  is the transition temperature,
  is a constant obtained from the heat data, which is related to the potential energy of crystal field, and k is the Boltzmann's constant.
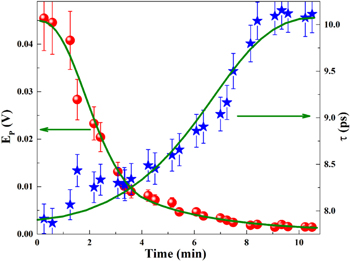
Figure 2. The values of EP and τ for THz-TDS signals as a function of the measurement time, representing the dynamics of the solid-liquid phase transition process of water.
Download figure:
Standard image High-resolution imageRectangular ice has six heat-absorbing surfaces with dimensions of length, width and thickness. Generally, it is assumed that the thickness of the cuboid is much smaller than the length and width, thus the total surface areas are replaced by the sum of the front and rear surface areas; The melting heat absorption rate of ice is the ratio of heat absorption to time, namely:

The amount of convective heat transfer between the outer surface and the environment per unit time is:

Where h is the convective heat transfer coefficient of the ice surface, the unit is (W/m2 · K), which is related to the cause of fluid flow, phase change, flow state, geometrical factors of heat transfer surface and physical properties of fluid. ΔT is the average temperature difference between the ambient temperature and the solid surface on the heat exchange surface. The convective heat transferring on the ice surface is completely absorbed by the ice and there is no heat loss. Consequently, the melting heat absorption rate of ice equals the ratio of heat absorption to time. Based on that, the relation between melting thickness and time can be described as:
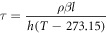
Where τ is the melting time, l is the melting thickness, ρ represents the density of ice, β is the thermal parameter of melting, and T represents the ambient temperature in units of Kelvin.
Here, we note that the absorption of THz radiation by liquid water at low THz wavenumbers is much greater than that of ice which is related to the reorientation of water molecules through rotational motion under the driving of electric field. In hydrate crystals, the rotation motion will be more difficult due to the interaction between H2O molecules.
As the temperature increases, the outermost water molecules overcome the lattice constraints, and the vibrational states of the water molecules transform from oscillation around equilibrium positions to rotations. And then under the driving of electric field, liquid water molecules on the surface of ice reoriented which leads to dielectric polarization. As a result, the absorption of the terahertz wave by the sample increases and the transmission decreases over time. Even though the liquid water layer at the surface is very thin (∼30–100 μm), the thickness is sufficient to cause visible changes in the transmitted THz signal peak intensity. Thus, we can observe an obvious decrease in the THz signal peak intensity from figure 2 with the appearance of the liquid water layer, which further decreases significantly as the thickness of the liquid water layer increases. Finally, once the water layer thickness reaches a critical value, the THz signals are nearly completely absorbed by the liquid water layer, and the transmitted signal gradually approaches zero. As such, the roughly sigmoidal shape of the plot of EP versus measurement time in figure 2 may be interpreted as a fairly abrupt weakening of the intermolecular hydrogen bonds in the top layers of the ice sample.
To understand the changes in the low frequency vibration mode of hydrogen bonds during the melting process better, we also obtained Raman spectra over the course of the melting process, and the results are presented in figure 3. The temperature range of sample measurements was from −30 °C to 10 °C, and the wavenumber range was from 50 cm−1 to 4000 cm−1. We obtained two obvious hydrogen bond stretching modes in the wavenumber (ω) range of 3100 cm−1 < ω < 3400 cm−1 and ω < 300 cm−1, which is in agreement with the results of previous studies [32–35]. According to some previous works, the observable two groups of Raman bands between 90 and 4000 cm−1 can be assigned to lattice vibration as well as intramolecular vibrations of water molecules. Specifically, the lattice vibration bands are below 200 cm−1. The Raman band below 300 cm−1 can be assigned to lattice vibration of ice. The inset of the figure presents the shift in the ω position indicative of the O:H bond (Rs1) with respect to temperature in the range from 263.15 K to 282.15 K. Surprisingly, the shift in Rs1 is not gradual with increasing temperature, but rather exhibits a rapid decrease from ∼211.5 cm−1 to ∼68 cm−1 at around 270.15 K, indicating that the ice melted into liquid water. This change represents a weakening in the hydrogen bonds in the ice, while the interaction between the THz radiation and the water molecules is increased.
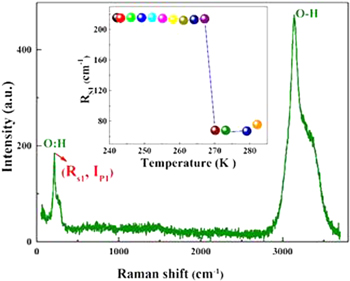
Figure 3. Raman spectrum indicative of the intermolecular van der Waals bond (O:H) and the intramolecular polar-covalent bond (O–H). The inset shows the temperature-dependent shifts in the wavenumber position (Rs1) of O:H bonds.
Download figure:
Standard image High-resolution imageFigure 4 shows real and imaginary part of the dielectric spectra of the ice during the melting process. The thickness at room temperature is used when calculating the dielectric functions, so it will introduce some errors, especially for the real part, due to the expansion or contraction during melting. However, the temperature dependence of dielectric response can be generally observed. As can be seen, both the real part and imaginary part of the dielectric functions increase with the increasing temperature, which is consistent with the observation of the time-domain spectra. Besides, the relaxation like dielectric dispersion in the first two minutes is very weak. Thus, we may conclude that the rotation of H2O molecules becomes difficult at low temperatures. As the ice begins to melt, the H2O molecules in crystal overcome the hydrogenbond interaction and start to rotate under the driving of THz field. With the increase of THz frequency, the rotation motion of H2O cannot catch up with the change of electric field, and therefore, a relaxation-like dielectric dispersion may appear. This molecular rotation mechanism well explains the low-frequency dielectric response shown in the last four minutes.

Figure 4. Real and imaginary part of the complex dielectric constants.
Download figure:
Standard image High-resolution image
4. Conclusions
In summary, we conducted an investigation of surface melting in the solid-liquid phase transformation process of water based on an analysis of THz-TDS signals and investigated the dynamic and continuous melting process on the surface of ice at room temperature. A remarkable attenuation in the THz time-domain spectra was observed. This feature was shown to indicate that the transformation of intermolecular hydrogen bonds on the ice surface marks. By analyzing the real and imaginary parts of the complex permittivity, we associate the signal change with the ice surface melting process. This melting takes place at a thickness of 30–100 microns from the ice surface and the melting rate is not positively correlated with time.
Acknowledgments
This work was supported by the National Nature Science Foundation of China (Grant No. 11574401), the Science Foundation of China University of Petroleum, Beijing (Nos. 2462017YJRC029, 2462018BJC005 and yjs2017019) and the Beijing Natural Science Foundation (No. 1184016). We would like to thank LetPub (www.letpub.com) for providing linguistic assistance during the preparation of this manuscript. We would like to thank LetPub (www.letpub.com) for providing linguistic assistance during the preparation of this manuscript. Honglei Zhan and Yan Wang contributed equally to this work.