

Abstract
Brain-machine interfaces directly communicate between the brain and external devices. An effective trade-off between signal quality and safety required for successful clinical translation has yet to be achieved, and represents a great challenge for engineers, neuroscientists, and clinicians. The StentrodeTM, an endovascular neural interface that allows neural signals to be recorded from within a cortical vessel, has demonstrated feasibility with safety for up to six months in a large animal model. Easily-obtained electrophysiological signals to evaluate the effect of implant duration on recording performance are essential for ongoing evaluation of the device. In this work, we demonstrate that a non-invasive and quick visual stimulation technique can be used to assess chronic signal quality of an endovascular neural interface in awake freely moving animals. Visual stimulation requires little or no training to elicit a large, consistent, and well-characterized response. We report the stability of recording quality with the Stentrode over 30 days using voltage measures of signal-to-noise ratio (18.78 ± 1.92 dB, mean ± std) and peak-to-peak voltages (56.07 ± 9.56 μV) computed on visual evoked responses. Signal amplitude and electrochemical impedance spectroscopy suggest that stabilization of the electrode-tissue interface occurred over the first 20 days. However, during this stabilization period, recording quality was minimally impacted.
Export citation and abstract BibTeX RIS

Original content from this work may be used under the terms of the Creative Commons Attribution 3.0 licence. Any further distribution of this work must maintain attribution to the author(s) and the title of the work, journal citation and DOI.
1. Introduction
Enabling long-term, bi-directional communication between the brain and external devices has potential applications ranging from brain-machine interfaces (BMIs) and disease monitoring to treatment of traumatic, genetic, and degenerative conditions, and also provides a powerful tool to study nervous system organization and function (Chen et al 2017). The design of an effective and clinically viable neural interface relies on a trade-off between invasiveness and signal quality; i.e. the ability to implant electrode arrays with minimal damage and disruption while providing an informative signal over a long period of time with high spatial and temporal resolution (Lebedev & Nicolelis 2006, Slutzky & Flint 2017). Surface electrodes placed above (epidural) and below (subdural) the dura mater provide access to electrocorticography (ECoG) signals, with promising performance in motor BMIs (Chao et al 2010, Yanagisawa et al 2012, Wang et al 2013) and stability for years after implantation (Ryapolova-Webb et al 2014, Nurse et al 2017). Penetrating microelectrodes have achieved the highest spatial resolution to date, allowing chronic access to the activity of localized populations of neurons (Nicolelis et al 2003, Chestek et al 2011, Schwarz et al 2014) and enabling the control of dexterous robotic arm movement in humans (Collinger et al 2012, Hochberg et al 2012, Bouton et al 2016, Flesher et al 2016, Ajiboye et al 2017). However, these approaches require open-skull surgery to access the brain for electrode implantation, enhancing the risks of subdural hematoma and compromising the stability of the blood-brain barrier if placed in or below the subdural space (Hamer et al 2002, Van Gompel et al 2008, Normann & Fernandez 2016). While implanting electrodes holds great promise, factors limiting clinical translation of invasive neural interfacing systems include biocompatibility, safety, and chronic signal stability. To achieve these outcomes, several groups are working to reduce the tissue response by enhancing biocompatibility (Jorfi et al 2015), matching the stiffness of the implant with the biological medium (Lacour et al 2016, Wang et al 2017), using drug-eluting coatings to prevent the fibrotic tissue reaction (Boehler et al 2017, Sanchez-Rexach et al 2017), and exploring and refining non-invasive optical methods (Maharbiz et al 2017).
Endovascular (within blood vessel) neural interfacing systems provide an alternative approach to access neural recordings inside the skull. Building on findings and technical refinements of diagnostic and therapeutic intracranial stenting (Fiorella et al 2011, Puffer et al 2013), an endovascular approach does not require burr-holes or larger craniotomies, potentially reducing complication rates and surgical durations. The first attempt to target an intracranial vessel for recording epileptic activity in humans used wire electrodes placed in the middle cerebral artery (Penn et al 1973). A series of clinical and research studies further explored the use of wire electrodes to access brain signals (Sefcik et al 2016) in the arterial (Boniface & Antoun 1997, He et al 2016) and venous systems (Mikuni et al 1997, Kunieda et al 2000), comparing the performance with scalp EEG recordings. Micro- and nano-wire probes were also developed, showing feasibility for recording neural signals intracranially (Ishida et al 1998) and from the spinal cord through the capillary system (Llinás et al 2005, Watanabe et al 2009). A significant advancement was the deployment of a catheter-based, multi-site recording system in the superior sagittal sinus (SSS) to record epileptic activity, showing similar performance to same-size subdural electrodes in pigs (Bower et al 2013). Recently, an endovascular neural interface with platinum-disk electrodes mounted on a super-elastic Nitinol stent, the StentrodeTM, was developed and successfully deployed in the SSS to record cortical signals (Oxley et al 2016). Vessel patency and safety were reported up to 190 days after implantation in a sheep model. The sheep did not demonstrate any neurological damage or sign of distress throughout the experiment. However, to determine the range of applicability of this endovascular interfacing modality, an investigation on the recorded signal properties is critical. Recently, John et al (2018) compared neural recordings acquired with the Stentrode and adjacent subdural and epidural grids 4 weeks after implantation. Importantly, results showed similarities across devices in signal quality measures that are relevant for BMI applications, e.g. bandwidth, signal-to-noise ratio (SNR), decoding accuracy, and spatial resolution. MicroCT and histology reported endothelialization of endovascular electrode 2–4 weeks after device deployment (Opie et al 2017). Impedance spectra, recorded every two days for the first 2 weeks and weekly up to 91 days, suggested an effect of endothelialization on impendance occurring 8–14 days after implantation (Opie et al 2016). However, neural activity was not recorded during these two studies. Oxley et al (2016) is so far the only report on long-term monitoring of signal quality accessible with an endovascular neural interface. In their study, somatosensory evoked potentials and impendance spectra were recorded every 2 days for the first 2 weeks and weekly up to 28 days. No significant effect of time on peak amplitudes was observed. However, stabilization and improvement in recording quality was suggested by an increase in the number of channels yielding an evoked response, over the first few days after implantation. Despite some promising results suggesting a limited effect of immune response on recording quality and impendace spectra, there is a paucity of data on chronic endovascular interfacing systems and how its recording quality might change over time.
Visual stimulation provides a simple, non-invasive tool that requires little training to elicit a neural response. Short-latency flash stimulation elicits a widespread, transient visual evoked potential (VEP) that is time-locked to the stimulus with a well-described morphology and latency (J Vernon Halliday et al 1972, Halliday et al 1973, Kraut et al 1985, Wright & Richardson 1986, Vialatte et al 2010, Odom et al 2016). This knowledge has been extensively applied to assess functionality of visual systems in patients (Halliday et al 1972, Halliday et al 1973, Tobimatsu & Celesia 2006), to diagnose conditions that impact visual functions such as Parkinson's disease (Nightingale et al 1986, Onofrj et al 1986), multiple sclerosis (Halliday et al 1973), Alzheimer's disease (Wright & Richardson 1986), and epilepsy (Broughton & Ebe 1969) and to control BMIs (Kwak et al 2015, Won et al 2016). In our studies, we have recorded chronic cortical activation with a stent-based endovascular neural interface in response to visual stimuli in awake, freely moving animals. We computed signal-to-noise ratios and peak-to-peak (PP) voltages of the recorded neural responses for up to 30 days, showing how these measures may be used to quickly and reliably assess the chronic performance of an endovascular device. We also recorded impedance spectra over time to directly evaluate changes in the electrode-tissue interface that might impact recording quality.
2. Methods
2.1. Fabrication of the Stentrode
The Stentrode comprises of an endovascular device that extends from a jugular puncture site to the cortical vasculature and a percutaneous connector that exits the skin at the animal's back. The fabrication process of the Stentrode, previously described by Oxley et al (2016), was slightly modified. Super-elastic, Nitinol (NiTi) stents (4 mm expanded diameter, 32 mm nominal length, TrevoProvue, Stryker, USA) were used to build the endovascular stage of the Stentrode. Platinum (Pt) disk electrodes (diameters: 750 μm, N = 14; 500 μm, N = 7; thickness 50 μm; Goodfellow, UK) were resistance-welded to a 33 μm diameter wire (92% Platinum-8% Tungsten, polyamide insulation, Sandvik, USA) and adhered to the crossing sections of stent struts using UV-adhesive (Dymax, UV Pacific, AU) to preserve its collapsible properties. A shaft (NiTi, diameter 0.37 mm, length 10 mm) was secured to the stent tip with a soldering joint covered with biocompatible UV-adhesive and then passed inside the stent to facilitate deployment through the catheter system (figure 1(a)).
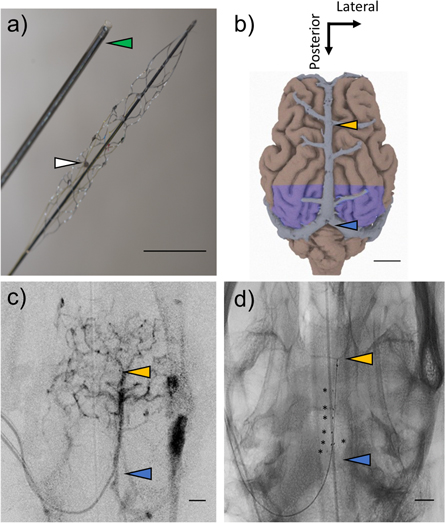
Figure 1. Endovascular electrode array and deployment site. (a) Picture of an endovascular, stent-based electrode array (StentrodeTM) with mounted platinum-disk electrodes (white arrowhead) and 4F delivery catheter (green arrowhead). (b) Dorsal view of sheep brain reconstruction with co-registered superior sagittal sinus (image adapted from Oxley et al 2016) and visual cortices (purple) (Clarke & Whitteridge 1976). (c) Pre-implant superior projection contrast image and (d) post-implant superior-projection planar x-ray showing the endovascular neural interface deployment site, in the portion of the superior sagittal sinus running from the cruciate sulcal vein (yellow arrowhead) to the confluence of sinuses (blue arrowhead). Scale bars 1 cm.
Download figure:
Standard image High-resolution imageInsulated wires, wrapped around a shaft, were slid through a flexible stainless steel coil (316LVM, OD 0.88 mm, ID 0.4 mm, length 30 cm) for support against fatigue and wire fracture, as part of the stent was deployed in proximity to the jaw and thus subject to potential fracture due to chewing movements (for deployment location, see the red dashed line in figure 2(a)). The shaft was inserted a few millimeters inside the coil and secured in place with UV-adhesive. Similarly, another shaft (diameter 0.37 mm, length 10–15 cm) was inserted at the other end of the coil, as support to build the connector-end of the Stentrode, as described by Oxley et al 2016.
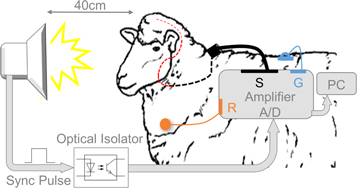
Figure 2. Full-field flash stimuli were delivered binocularly to the awake animal via a strobe placed in front of the animal's eyes in a light-controlled environment. Neural activity was recorded using the Stentrode placed inside the cortical vasculature through a puncture in the left jugular vein (red dashed line) and then tunneled subcutaneously to reach the back of the animal (black dashed line). The circular plug on the back of the animal (black) was connected to the acquisition system, referenced to a skin contact electrode (orange) on the left shoulder. The ground was an implanted stainless steel plate (blue). Recordings and visual stimuli were synchronized with a TTL pulse passing through an optical isolator and processed online on a computer.
Download figure:
Standard image High-resolution imageFor the external connector, polyimide insulated, stainless-steel wires (0.15 mm diameter) were soldered to a circular Omnetics plug (MCP-12-WD-18.0-C, Omnetics Connector Corporation, USA). To allow the structure to stretch and to compensate for abrupt movements, 3 cm of the wires adjacent to the connector were coiled and encased in a silicone tube then filled with medical grade silicone (Kwik Cast, World Precision Instruments, USA).
2.2. Stentrode deployment with venous angiography
Three adult sheep ([S1, S2, S3], ages 4–6 years, weights 65–75 kg) were used in this study. Corridale ewes were chosen due to their similar cortical vessel size to humans in proximity to cortical structures of interest (Oxley et al 2016). Surgeries and experiments were conducted at the Florey Institute of Neuroscience and Mental Health. All surgical and animal care procedures were approved by the Florey Institute of Neuroscience and Mental Health Animal Ethics Committee, and were performed in accordance with the Australian Code of Practice for the Care and Use of Animals for Scientific Purposes (8th Edition 2013).
Animals were housed in individual metabolism cages at least one week before surgery. Antiplatelet medication (Aspirin, 150 mg, per os (p.o.)) was given to the animals daily from three days prior to the Stentrode implantation until termination. On the day of the surgery, prophylactic antibiotics (Penicillin, 3 ml, intramuscular (i.m.)) and analgesia (Flunixin, 1 ml, i.m.) were administered. Anesthesia was induced with sodium thiopental (15 ml, intravenous (i.v.)) followed by intubation and maintenance with inhaled isoflurane (2%–2.5%) in air/O2. The animal was ventilated and vitals were continuously monitored throughout the surgery.
The jugular vein was accessed through a cut-down on the left side of the neck and a needle puncture of the vein, and navigated using an angiography-guided, coaxial catheters technique previously described in detail (Oxley et al 2017). The Stentrode was deployed in the segment of the SSS running through the parietal and the occipital lobes (figures 1(b)–(d)). The vessel puncture site was closed immediately adjacent to the connector-end using a purse-string suture. A custom wire-wrapping technique was used to connect each wire of the external connector to one of the platinum tubes on the connector-end of the stent. This ensured electrical connectivity of each electrode on the stent to each pin of the micro circular plug exiting the animal skin. The external connector was then tunneled percutaneously to exit the back of each animal. Antibiotics (Penicillin, 3 ml, i.m.) were administered for a minimum of two days after surgery.
2.3. Stimulation protocol and data acquisition
The recording setup is illustrated in figure 2. To avoid excessive stress for the animals, preconditioning experiments were started two weeks prior to device implantation, when flash stimulation was delivered maintaining a similar setup and experimental times as during signal acquisition. A binocular, full-field flash stimulus (duration = 10 μs; f = 1.2–1.4 Hz, PS22 Photic Stimulator, Grass Products, Natus Neurology, USA) was delivered to awake, unrestrained animals in a darkened chamber, from day 1 after Stentrode deployment. Flash VEPs were recorded with endovascular stent-mounted electrodes, with the strobe held 40 cm in front of the animal, equidistant from both eyes. Signals were acquired using a 16-channel g.USB amplifier (g.Tec, GmbH, Germany, 24 bits/sample, 4800 samples/s), which applied a hardware bandpass filter (0.5–2400 Hz) before sampling. Recordings were referenced to an Ag/AgCl skin-contact electrode (2.3 mm diameter, H124SG, Medtronic, USA) applied on the shaved left shoulder of the animal with clear adhesive conductive hydrogel (Tensive®, Parker Laboratories, USA). The ground was a percutaneous 316 stainless steel plate (3–5 cm diameter) implanted in the back of the animal. To synchronize visual stimulation and recording, a TTL pulse was sent from the strobe to the amplifier when each flash stimulation occurred, passing through an optical isolator to prevent interference of the acquired signals. Each recording with the Stentrode typically lasted for 2 min. Control sessions were run with the strobe covered using a non-transparent black bag to measure if non-neural interference signals affected the recordings. Recordings were collected daily for two weeks and then on alternate days up to 30 days.
2.4. Electrode-tissue impedance measurements
Prior to implantation, electrodes on the Stentrode (S1 = 7, S2 = 7, S3 = 7 electrodes) were cleaned by cyclic voltammetry (CV), characterized using electrochemical impedance spectroscopy (EIS), and sterilized in 80% ethanol. Complex impedance spectra (1–100 kHz, 10 points per decade) were measured through a potentiostat (Interface 1000, Gamry Instruments, USA) in physiological saline (0.9% NaCl, Baxter International, USA). A 5 mV sinusoidal waveform was delivered through each electrode, referenced to a distant, low impedance, custom-made Pt return electrode (area = 55.2 mm2). The two-electrode method was considered suitable to measure impedance due to the large difference in impedance relative to the reference electrode and the small currents passing through the circuit (Williams et al 2007). After implantation, impedance spectra were measured after each neural recording session (in two animals, S1 and S2), using a similar setup to the in vitro analysis (1–100 kHz, 5 points per decade).
2.5. Neural signal analysis
Data were high-pass filtered at 1 Hz (Butterworth, 4th order), low-pass filtered at 400 Hz (multitaper projection filter settings, time duration = 25 ms, frequency bandwidth = 400 Hz, center frequency = 0 Hz), and 50 Hz and its harmonics were notched using a multitaper-spectral technique (Thomson 1982, Mitra & Pesaran 1999). Artefact rejection was first performed using thresholding, where trials that had absolute signal amplitudes greater than ±300 μV were removed. Additionally, all epochs were visually inspected for artefacts.
Electrocardiographic (ECG) artefact was present in recordings due to the position of the reference electrode. If this artefact was identified, it was replaced with a section of trial-averaged signal for that channel if it occurred prior to visual stimulation delivery (200 ms window pre-stimulus); the trial was excluded if the ECG artefact appeared in the time window where a visual response was expected (400 ms window post-stimulus). The noise level was computed as the variance of the amplitude of the trial averaged response in the baseline period (100 ms time window before the flash stimulation). This was minimized during recordings by shielding cables and grounding all electrical equipment and its consistency was verified across daily recording sessions. For each recording day, the trial-averaged signal was computed on 120–250 trials. Electrodes were excluded from further analysis according to previous characterization approaches (Opie et al 2016) if 1 kHz impedance magnitude was below 1 kΩ, which occurred when the electrode was shorted to the stent, and if 1 kHz impedance magnitude was above 30 kΩ with a corresponding phase value greater that 30º, which occurred when wires were disconnected from electrodes. Faulty electrodes were identified on trial-averaged signals by comparing the variance of the amplitude in a time window prior to the visual stimulation delivery (window length = 180 ms, center = –100 ms). As the same number of trials was recorded for each electrode daily, the baseline variability of functional electrodes was expected to be comparable across the Stentrode. A recording channel was considered faulty and removed from the analysis if the variance of the electrode was more than three times the variance of the daily signal averaged across electrodes.
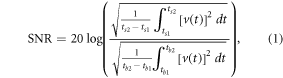
Chronic signal quality was quantified using signal-to-noise ratios and peak-to-peak voltages of the filtered trial-averaged signals. All analyses were performed using MATLAB (R2016b, The MathWorks, Inc., USA). SNR was computed as the ratio of the root-mean-square (RMS) value of the signal amplitude in a 130 ms time window after the visual stimulation delivery to the RMS value of the signal amplitude in the baseline period (155 ms to 25 ms before a flash),
where ts2 = t0 + tpeak + 100 ms, ts1 = t0 + tpeak −30 ms, tb1 = t0 − 155 ms, tb2 = t0 − 25 ms. tpeak is the latency of the maximum peak of the visual-evoked response for each recording electrode, animal, and day;  represents the time at which the flash stimulation occurred. We also measured the maximum peak-to-peak voltages, calculated as the differences between the maxima and the minima of the trial-averaged signals in a 200 ms window post-stimulus.
The time-frequency spectrogram of the VEP signal was estimated on single trials with a temporal resolution of 5 ms and a 50 ms Hamming window. The mean spectrogram was normalised to the average power in each trial 0–100 ms before the stimulus onset. To test for significant changes in VEP power in the spectrograms, the signal was compared with a distribution of the baseline power computed by bootstrapping the signal power 250 ms prior to flash delivery on each trial. To correct for false positives, cluster correction to a significance level of p < 0.01 was applied to the statistical tests (Maris et al 2007).
3. Results
3.1. Visual evoked potentials were consistently recorded from the Stentrode
The Stentrode was successfully deployed in the SSS in proximity to the visual cortex in three sheep. Prior to deployment, a radiopaque contrast agent was injected to help visualize the cerebral vasculature of interest and exclude occurrence of hemorrhages during access (an example is shown in figure 1(c)). Correct positioning was ensured after delivery using lateral and superior x-ray projections (see figure 1(d) for an example).
An evoked visual response was successfully recorded with a single endovascular electrode from day 1 in each animal (figure 3(a); representative example for S2) and shows consistency at a population level (Figure 3(b); 3 animals, 21 electrodes). The response starts with a negative peak around 20 ms (N20) followed by a negative deflection at 40 ms (N40). Across subjects, the maximum peak latencies of the visual evoked potentials were 58.31 ± 3.05 ms (mean ± standard deviation, S1 =53.11 ± 2.02 ms; S2 = 63.72 ± 1.44 ms; S3 = 58.38 ±0.66 ms), consistent with VEPs latency in rats, cats, and monkeys (Creel et al 1973), while later peaks exhibited increased variability in latencies and amplitudes.
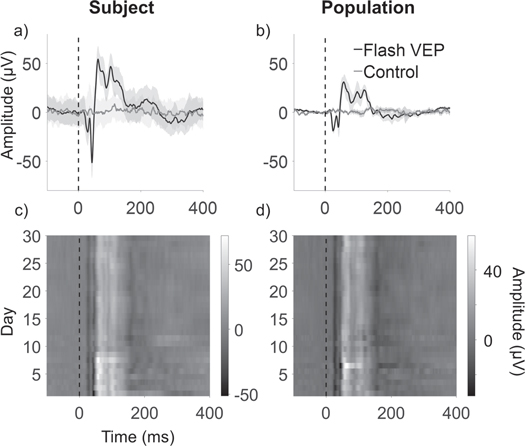
Figure 3. Visual evoked potentials (VEPs) recorded with the Stentrode. (a) Time-trace of the VEP signal (black line) on day 1 versus control signal (grey line), recorded with one electrode. (b) Population averaged VEP signal (black line) on day 1 versus control (grey line) (3 animals, 21 electrodes). Light grey regions indicate standard deviation. Both VEP traces are significantly greater that the corresponding control signals (p < 0.01). (c) VEP signals recorded with single electrode up to day 30, on one animal (S2) and (d) across all animals and all electrodes. Grey scale indicates amplitudes scaled as shown by the color bars. Light and dark vertical lines represent peaks and troughs of the signal, respectively, showing consistency and repeatability across days and animals.
Download figure:
Standard image High-resolution imageEvoked responses were compared to control recordings, shown as grey lines in figures 3(a), (b). Control recordings did not show any significant peak after visual stimulation (Wilcoxon RankSum test, p = 0.94, on controls, signal amplitude in 300 ms time-window comparing before versus after visual stimulation delivery). VEP amplitudes were significantly different from controls (Wilcoxon RankSum test, p < 0.01, VEP versus control, 300 ms time-window after flash delivery; figure 3(a)). Despite an overall decrease in peak amplitudes, similar results for peak latencies and significance of VEP compared to control recordings were consistent at the population level (Wilcoxon RankSum vs control, p < 0.01, VEP versus control, 300 ms time-window after flash delivery; 21 electrodes, 3 animals, 30 days; figure 3(b)).
Figures 3(c) and (d) show the signal amplitude over time recorded with one electrode and at a population level (21 electrodes, 3 animals, 30 days), respectively. The first two negative deflections (N20, N40) are visible as darker vertical shades across the entire recording period and the maximum amplitude peak (N60) is visible as a lighter vertical line, showing stability over the 30-day duration of the experiment. Pearson's correlation coefficients computed on signal amplitude for each electrode across days show little variation (S1 = [0.78 ± 0.12]; S2 = [0.91 ± 0.07]; S3 = [0.86 ± 0.09]; mean ± standard deviation; 7 electrodes, 30 days per animal), confirming the stability of the response.
3.2. Signal quality increases significantly with averaging 20–30 trials
Clear responses were not consistently recorded on single trials with endovascular electrodes. The single trial noise level was 18.81 ± 10.34 μV and SNR was 4.35 ± 3.73 dB (mean ± standard deviation), which was not significantly different from zero dB (21 electrodes, 3 animals, 30 days; Wilcoxon RankSum test, p = 0.20). Quantification of the minimum number of trials needed to obtain a significant neural response and minimize the noise level is useful to test real-time control performance with the Stentrode. Trial averaging is commonly applied in analysis of stimulus-locked evoked potentials. It allows isolation of event-related neural content by decreasing the power of random fluctuations and uncorrelated, ongoing activity (Brazier 1961, Bickford et al 1964). The noise level decreased with the number of trials averaged with a trend shown in figure 4(a) for a single animal (S2) and in figure 4(d) across all animals, with a corresponding increase in SNR (single animal: figure 4(b)); population: figure 4(e)). A similar trend of SNR was observed across time (figures 4(c), (f)), with a consistent rapid change occurring with averaging the first 20–30 trials. We identified the minimum number of trials needed to pass a 6 dB threshold, defined as the SNR value 6 dB below the maximum stationary value. On a population level, the 6 dB threshold value corresponds to SNR of 14.19 ± 3.91 dB, detectable averaging 35 ± 17 trials (mean ± std, 21 electrodes, 3 animals, 30 days). The noise level corresponding to the 6 dB threshold value is 4.17 ± 1.74 μV on a population level. Values of the previous quantities for each animal are listed in table 1. There was no statistical difference between animals on the number of trials needed to achieve the SNR value corresponding to the 6 dB threshold (χ2 = 5.46, DOF = 2, p = 0.07)).
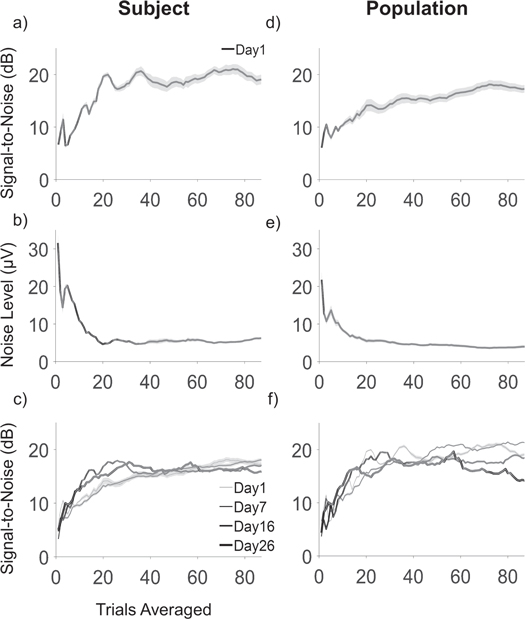
Figure 4. (a) Representative example of decrease in noise level with increasing number of trials averaged and (b) corresponding rapid increase of SNR (mean ± s.e.m; 7 electrodes, 1 animal (S2), day 1). Panel (c) reports similar trend for SNR as (a), across recordings on days 1, 7, 16 and 26. Panel (d)–(f) represent similar results to (a)–(c), on a population level (21 electrodes, 3 animals).
Download figure:
Standard image High-resolution imageTable 1. Value of SNR 6 dB below the maximum stationary value and corresponding number of trials averaged and noise level (i = 7 electrodes, k = 30 days per animal).
| Subject 1 | Subject 2 | Subject 3 | ||||
|---|---|---|---|---|---|---|
| Mean | STD | Mean | STD | Mean | STD | |
| 6dB value (dB) | 13 | 3 | 16 | 4 | 13 | 3 |
| Number of trials | 27 | 21 | 26 | 23 | 33 | 22 |
| Noise level (μV) | 3 | 2 | 5 | 2 | 4 | 3 |
3.3. Visual evoked responses stabilized over the first 2–3 weeks.
Assessment of signal quality over time is essential to quantify the applicability of a neural interfacing system, in particular to ensure reliability in a BMI application. Chronic recording quality of the Stentrode was quantified using PP voltages and SNRs of trial-averaged signals. While the PP measure gives the maximum extension of the signal, which may be affected by noise, SNR gives an evaluation of the informative signal with respect to the noise level. It is fundamental to any BMI system to maximize SNR to enhance performance (Wolpaw et al 2000).
Figure 5(a) shows mean and standard deviation of SNR values computed on VEP for each electrode (n = 7) on each animal (N = 3) for the entire duration of the experiment (30 days). These values were significantly higher than control signals for each animal (Wilcoxon Rank Sum test, SNR of VEP versus control recordings, p < 0.01). Individual symbols represent SNR on single electrodes on day 1, which show a significant difference compared to SNR on control recordings (Wilcoxon Rank Sum, p < 0.01). Similar results are shown in figure 5(c) for PP amplitude. SNR values on a population level are 18.78 ±1.92 dB and PP 56.07 ± 9.56 μV (mean ± std). A linear fit of the SNR and PP data showed a slight but significant decreasing trend over time (SNR slope =−0.078 [−0.120, −0.028] dB/day ([95% CI]), intercept = 19.73 [18.97, 20.49] dB, RMSE = 3.7615, PP: slope = −0.84 [−1.07, −0.61] μV/day, intercept =66.77 [63.23, 70.31], RMSE = 13.22) from day 1 to 30 (figures 5(b), (d)). Variance of the SNR and PP across electrodes was computed daily. Significant decreases in variance of SNR values and PP voltages across electrodes were observed after 2 weeks (Wilcoxon RankSum test, variance day 1–15 vs day 16–30; SNR: p = 0.0038; PP: p < 0.01), suggesting a stabilization of recording over time. This increased stability was supported by computing the linear fitting over the last 10 days, which showed slopes close to zero for both the SNR (slope = −0.007 [−0.20, +0.18] dB/day, intercept = 17.90 [12.88, 22.91] dB, RMSE = 2.86) and PP values (slope = −0.13 [−1.04, 0.77] μV/day, intercept = 48.75 [25.59, 71.92] μV, RMSE = 13.30) (figures 5(b) and (d), insets).
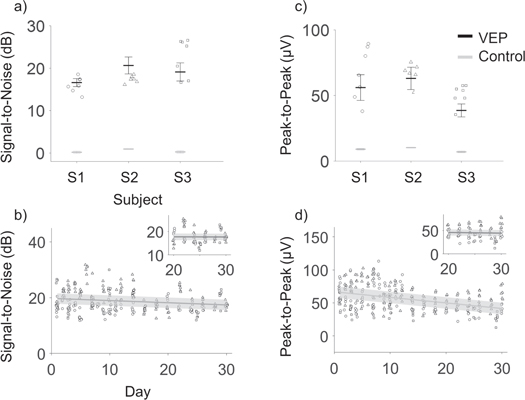
Figure 5. Signal quality measures of visual evoked responses recorded with the Stentrode. (a) SNR mean (bold lines) and standard deviation (error bars) computed on VEP (black) and control (gray) signals for each electrode show significant difference over the 30 day period (7 electrodes, 30 days per animal). Symbols represent SNR on day 1 after implantation, computed on the trial-averaged signal on single electrodes, on different animals (S1 = circles, S2 = triangles, S3 = squares). Panel (c) show similar results as (a), for PP values. (b) Trend of signal-to-noise ratios and (d) peak-to-peak value across electrodes and animals, up to 30 days after implantation, with linear fits shown as dark grey lines. Insets show linear fitting over days 20–30 for both measures, showing increasing stability, with slope of the fit approximating zero. Error bars in (b)–(d) show the root mean square error for the fit.
Download figure:
Standard image High-resolution image3.4. Electrode impedance showed significant change over the first two weeks
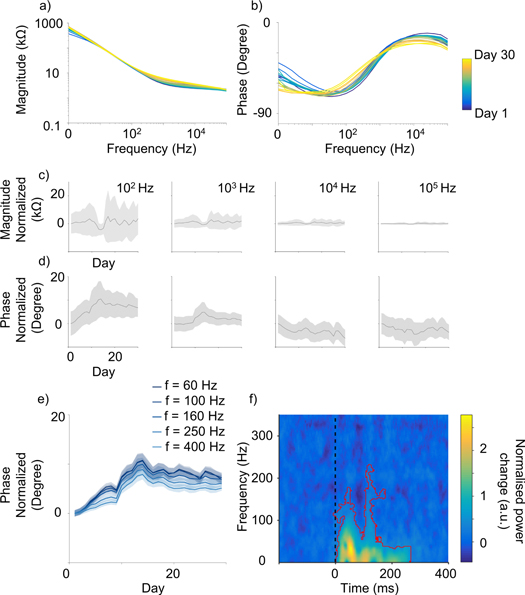
Impedance magnitude and phase spectra of endovascular electrodes were plotted over time to identify changes after implantation (figures 6). The change of the magnitude over time, computed by subtracting the average values of the first day of recordings, showed very little variation across frequencies (figures 6(a), (c)). The phase varied substantially (figures 6(b), (d)), displaying the greatest variation and a consistent trend in the range 100–1000 Hz (figure 6(e)). To further analyze the trend of variation in time, we computed the derivative of the phase curves in the frequency range 100–1000 Hz. The point in which the derivative of the phase curves changed sign, to then approach zero, was 15 ± 0.41 days after implantation (14 electrodes, 6 frequencies between 60–1000Hz). This corresponded to the knee of the phase curves (figure 6(e)), suggesting stabilization of electrode impedance occurring about two weeks after implantation. Figure 6(f) shows a time-frequency spectrogram of the VEP on a population level (3 animals, 21 electrodes, day 26). Significant power changes compared to the baseline were observed in a 300 ms window after visual stimulation delivery (highlighted in red), with the majority of power of the VEP signal distributed below 200 Hz.
Figure 6. Impedance of the Stentrode over time. (a) Impedance magnitude and (b) phase spectra of a representative endovascular electrode, with observable more pronounce changes for the phase over time. Mean (c) magnitude and (d) phase changes with respect to day 1, obtained by subtracting the average value of the first day of recordings, for 100, 1000, 10,000, and 100,000 Hz. Daily data was averaged on a time window of 5 days for each point to smooth the results and show a clearer trend over time. Little change is observable for the magnitude, while more pronounce stabilisation occurs for the phase in the range 100–1000 Hz. (e) Similar analysis as (d) showing a robust trend across single frequency for the phase, across time, with knee of the curve occurring at 15 ± 0.41 days after implantation (n = 14 electrodes, n = 6 frequencies). (f) Time-frequency spectrogram of the VEP signal (3 animals, 21 electrodes, day 26 post implant). Significant power changes are visible within 300 ms from visual stimulation delivery (black dashed lines, t = 0) highlighted by a red line (p < 0.01 cluster corrected).
Download figure:
Standard image High-resolution image
4. Discussion
This study reports on the stability of neural activity recorded with the Stentrode over the first critical 30 days post-implantation. Utilizing a simple technique that is well described in clinical and research studies, this work applies visual stimulation to quantify recording quality of an endovascular neural interface. For the first time, cortical responses to visual stimuli were recorded in awake animals, with electrodes placed within the vasculature. By analyzing daily recordings of visual evoked potentials and impedance spectra up to 2 weeks and on alternate days till day 30, we quantified chronic signal quality of an endovascular neural interface with the finest resolution and for the longest period of time. We observed stabilization of the signal over time, with a decrease in inter-electrode variance over two weeks, suggesting increasing stability with duration of implantation.
4.1. Applicability of a simple visual stimulation technique to assess recording performance
We used full-field flash visual stimuli to evoke neural responses, a simple technique that has been extensively characterized in healthy and pathological subjects (Halliday et al 1972, Klinstornern & Graham 1999, Tobimatsu & Celesia 2006), across animal species, and paired with different recording modalities (Vialatte et al 2010). Previous results showed the feasibility of recording endovascular VEPs with wire electrodes (He et al 2016). We demonstrate that the Stentrode can record evoked potentials with high repeatability across cortical structures and over time with typical narrowband peaks and electrophysiological features. The morphology of the VEP on single electrodes showed characteristic peaks at 20, 40, and 65 ms post-stimulus, comparable with signals observed in other animal species (Creel et al 1973, Kraut et al 1985) and prominent peak components observed in the first 150 ms post-stimulus in human scalp recordings (Cigánek 1961, J Vernon Odom et al 2016). Later oscillations in the response showed increasing variability as they are affected by the interplay of reticulo-geniculate input, behavioral states, level of consciousness, and intracortical connections, as observed in experimental (Torres & Warner 1962, Creel et al 1974) and computational (Jansen et al 1993) studies.
VEP-based techniques can be a powerful tool for signal calibration in BMI applications. In humans, studies shows that the organisation of perception and movement originates from primary visual areas, to then spread ventrally and dorsally across multiple brain areas (Goodale & Milner 1992, Ungerleider & Haxby 1994, Goodale & Westwood 2004, Himmelbach & Karnath 2005). Thus, the design of effective BMIs require access and communication across areas of the brain for movement restoration and even more so for higher cognitive functions such as memory, planning, and reasoning (Lebedev & Nicolelis 2006, Pesaran et al 2006). Moreover, the strenght of the flash stimulation in a light-controlled environment causes neurons to fire indipendently from motor behavior or active attention (Itti & Koch 2001). The large evoked response can thus be used to indicate electrode viability and to quickly assess signal changes over time.
However, our approach might be generalised to other event-related potentials (ERPs) in response to cognitive, sensory, or motor stimuli, which might be used to evoke time-locked brain activity in the area of interest to assess BMI functionaty, such as P300 (McCane et al 2015, Ryan et al 2017) or somatosensory evoked potentials (Kany & Treede 1997, Cruccu et al 2008). Steady-state visual evoked potentials (SSVEPs) can also been used as a control signal for BMI applications. In brief, each command is associated with a flickering visual stimulus at a specific frequency, evoking an oscillatory SSVEP in the visual cortices that matches the frequency of the stimulation. SSVEP-based BMI systems present relatively high SNR and transfer rates, easy system configuration, and little user training. They have been shown to successfully control spellers (Bin et al 2011, Won et al 2016), hand orthoses (Ortner et al 2011), and a lower limb exoskeleton using surface electrodes place on the occipital lobe, with major limitations related to the suboptimal EEG recording modality (Kwak et al 2015). However, SSVEP systems might cause fatigue to the subject with long-term use and entail a low risk of seizure, that may be bypassed by hybrid BMI paradigms providing softer stimuli, such as combining P300 and SSVEPs (Wang et al 2015) or motor imagery and motion-onset VEPs (Ma et al 2017).
4.2. Chronic signal quality measures of an endovascular neural interface
Visual stimulation elicited a highly repeatable and widespread response across cortical structures, as reported by high correlation measures between VEP recordings across electrodes and recording sessions. The capability of accessing this robust neural pattern might be an advantage for calibration and study of chronic signal quality compared to other event-related potentials (e.g. somatosensory evoked potentials) that originate at cortical level and present greater variability across cortical structures (Allison et al 1989). To estimate how the signal quality varied over time, we evaluated the trend of SNR and PP voltages over 30 days, computed on single electrodes across animals. Despite peak amplitudes possibly being impacted by measurement noise, SNR is a more robust measure to quantify signal quality that has been directly related to BMI performance (Wilson et al 2006) and has been used effectively to compare invasive brain interfacing modalities (John et al 2018). While the linear fit showed a negative slope over 30 days, which was more pronounced for the PP values, we observed a significant decrease in inter-electrode variance over two weeks, suggesting increasing stability with duration of implantation. When examining only the last 10 days of recordings, the slope of the linear fit approximated zero for both SNR and PP voltages. This demonstrates that the device properties stabilize over time and this can take around two weeks to occur.
Similar characterizations of chronic signal quality of invasive neural interfacing systems have been reported by other groups (Nicolelis et al 2003, Suner et al 2005, Chestek et al 2011). For example, Suner et al (2005) measured SNR on averaged signal amplitude recorded while monkeys were performing a motor task. They concluded that there was no significant degradation of signal quality for penetrating electrode arrays or trend in the SNR for a minimum of 3 months and up to 1.5 years. Chestek et al (2011) reported a similar investigation in animals performing a 2D motor task for more than 30 consecutive days over 9–31 months; this study described a negative trend in the peak values of the largest action potential on the arrays during each recording session. A preclinical study on ECoG arrays has also shown a decrease in the root-mean-square amplitude of the signal over 24 months (Ryapolova-Webb et al 2014). Indeed, ECoG signals show compelling features for use as BMIs and provide access to high resolution signals describing the activity of large populations of neurons (Buzsáki et al 2012) that can be used to successfully decode movement intention (Leuthardt et al 2004) for months after implantation (Chao et al 2010, Shimoda et al 2012). ECoG also presents long-term, high gamma signal stability over years in humans (Nurse et al 2017). However, despite promising results, the implantation procedure requires a craniotomy and might include a durotomy with related risks of cerebral edema and surgical complications. Histopathological analysis indicates that there is often fibrous encapsulation of the device (Schendel et al 2013, Schendel et al 2015, Degenhart et al 2016) that might impact signal quality (Ryapolova-Webb et al 2014). Previous characterization of the Stentrode indicated spectral content similar to ECoG arrays (Oxley et al 2016), suggesting that it may be able to access similar information content, but evoke little or no adverse tissue response thus improving stability of the electrode-tissue interface and signal after deployment.
4.3. Single trial information content
A clear visual response wasn't consistently recorded on single trials. However, the noise level decreased rapidly with averaging and a clearly detectable response, with SNR 6 dB lower than the maximum steady-state value, was obtained using 35 ± 17 trials on a population level. This reduces experimental times significantly and might prevent fatigue for the subject. Importantly, the recording setup did not minimize acoustic and electrical interference. Due to the social nature of sheep, an additional, companion sheep was required in the room, together with all the equipment for neural recording and visual stimulation. The use of a skin-contact electrode as reference for neural recordings, chosen to minimize invasiveness and improve the animal's recovery, might have increased susceptibility to movement artefact in awake, unrestrained sheep. Enhanced electrical and acoustic noise control using grounded Faraday cages, sound-proof rooms, LED lights, and a fully implantable, wireless system may further improve signal quality and allow robust visualization of the VEP on single trials. This may further reduce the time needed to evaluate signal quality of the implanted neural interface, especially during surgical procedures to check electrode viability and possibly modify array position. Importantly, improvements in single trial detection will allow a direct evaluation of online decoder performance in BMI applications and direct comparison with penetrating (Chestek et al 2011, Flint et al 2013) and surface electrode arrays (Leuthardt et al 2004, Chao et al 2010) over time.
4.4. Stabilization of the electrode-tissue interface
Electrode impedance spectra were collected prior to deployment for each animal to ensure viability and after each recording session in two animals, to directly correlate signal amplitude measures to electrode-tissue interface changes over time. Typically, 1 kHz impedance is monitored as a measure of functionality of the implant and tissue reaction, which is of interest because of the action potential duration of 1 ms (Mercanzini et al 2009). However, a wider frequency range of tissue impedance allows a more detailed characterization of biological changes of the electrode-tissue interface post-implant, including influences of both capacitive and resistive components (Williams et al 2007, Mercanzini et al 2009).
In the literature, higher frequency (>10 kHz) modification of phase spectra are related to cellular growth on invasive neural implants (Williams et al 2007). Similarly, impedance analysis of gold electrodes shows a characteristic increase in the frequency range 100–10,000 Hz when covered with a confluent monolayer of epithelial cells (Wegener & Sieber 1996).
In this study, the 1 kHz impedance magnitude value didn't significantly change over time and, in general, across frequencies, the magnitude remained stable throughout the experiment. Interestingly, impedance phase values showed an increasing trend, with stabilization occurring about two weeks after implantation, which was most evident at frequencies around 100 Hz and present up to 1000 Hz. Visualization of the time-frequency spectrogram of the VEP signal showed a distribution of power post-stimulus below 200 Hz, thus contained within the frequency range in which phase showed the greatest variability. This change may be due to the hydrophobic behavior of metals that, in aqueous environment, become more susceptible to surface fouling and protein adsorption (Berggren et al 2001, Cui 2015). Phase values increasing at 100 Hz have been observed in previous studies using the endovascular neural interface at 4 days (Oxley et al 2016) or 8–14 days (Opie et al 2016) after implantation. The present study investigated the impedance trend in parallel with changes in neural recordings. While histological analysis is needed to confirm our findings, our results suggest that a combination of protein absorption and cell growth may have occurred at the electrode-tissue interface. This effect was reflected in an attenuation of the recorded signal, and stabilized 2 weeks after Stentrode deployment.
4.5. Limitations
One of the limitations of this study is the use of flash-VEP for the analysis of spatial resolution achievable with the Stentrode. This is due both to the cortical position of the array and the nature of the flash visual stimulus, which evokes a broad neural response across occipital and parietal lobes. To further investigate this aspect, which is required to determine the range of applicability of the Stentrode, the delivery of a more structured visual stimulation appears more suitable.
The architecture of the primary visual cortices in mammalian brains shows well defined spatial organization based on receptive fields (Sereno & Allman 1991). Receptive fields are responsive to selective attributes of the visual scene, such as position, orientation, direction of movement, spatial frequency (Hubel & Wiesel 1962). Moreover, human studies have shown that receptive fields form a retinotopic map; thus, the location of information at a cortical level is as a projection with some level of distortion of the visual field (Wandell et al 2007, Harvey & Dumoulin 2011, Wandell & Winawer 2011). These findings have largely contributed to determine the origin and cortical spread of local field potentials (Katzner et al 2008, Xing et al 2009). With a similar approach, checkerboard or sinusoidal gratings might be more suitable to allow a more selective activation of the primary visual cortices and therefore evaluate inter-electrode differences in recording quality.
5. Conclusion
We showed the feasibility of recording visual evoked responses with the Stentrode in awake animals from the day after implantation out to 30 days. Amplitude measures of the recorded neural signal and electrochemical impedance spectroscopy results suggest that electrode-tissue interface stabilization occurred in the first two weeks after implantation. However, the neural signal remained significantly larger than background activity throughout the duration of the experiment. We propose that methods and procedures described in this study could contribute to a simple and effective calibration and signal quality assessment for interfacing systems in human applications of BMIs.
Funding source
This research was funded by NHMRC grants APP1062532 and APP1075117 and by the Defence Health Foundation. NLO is supported by a Westpac Bicentennial Research Fellowship.
Acknowledgments
The authors would like to acknowledge the contributions of Tom Vale and Tony Dornom from the Florey Institute of Neuroscience and Mental Health and Alan McDonald from VascuLab for their outstanding technical assistance with animal experiments and monitoring.
Declaration
NLO, TJO, SEJ, SMR, GSR have financial interests in SmartStent Pty Ltd and Synchron Inc.