


Abstract
Purpose; To develop a CBCT-based method for selection of head and neck cancer (HNC) patients that may require adaptive replanning. Materials and Methods; We retrospectively analyzed 11 HNC patients with different degree of weight loss during the 7 weeks of IMRT treatment. Weight loss related dosimetric parameters were determined using CBCT and verified against new CT scans acquired during adaptive replanning process. The planning CT body surface in the head and neck region was modified using the CBCT body surface. The target volumes (PTV) and organs at risks (OAR) were modified where necessary following the body shrinkage. Anatomical and dosimetric changes were studied using the resulting modified CT. Dose calculation was performed using the parameters of the original treatment plan with the modified CT structure set using Eclipse treatment planning system. Action levels for adaptive replanning were developed evaluating dosimetric changes in all structures. Results; The largest volume loss occurred in the lateral neck, the cheeks and chin regions. The correlation % dose versus % volume changes is quasi-linear and patient/structure-specific. A 10 mm loss in the neck average radius corresponded to an increment in the dose to the PTVs/OARs of up to 4%. Deep PTV's maintain good coverage (V100 > 95%) during the treatment but PTV coverage is reduced in shallow regions. Conclusion; The estimated dosimetric changes obtained for CBCT and replanning CT are consistent. The anatomical and dosimetric changes in HNC patients derived from CBCT can be used to guide decision-making as to when during RT treatment replanning is necessary or optional.
Export citation and abstract BibTeX RIS
1. Introduction
The National Cancer Institute [1] estimates that head and neck cancer (HNC) accounts for about 3 percent of all new cases of cancer diagnosed each year in the United States. In 2016, this is predicted to translate to about 50 000 new cases of HNC. Treatment of HNC patients often includes chemotherapy and radiotherapy. Intensity-modulated radiation therapy (IMRT) is a commonly used radiation delivery technique for HNC treatment, which has the capability to generate steep dose gradients and increase OAR sparing, leading to an improved therapeutic index [2–4]. IMRT plans are based on a pretreatment planning computed tomography (CT), however, inter-fractional anatomical variations may occur because of setup errors and systematic anatomical modifications such as body weight (mass) loss and changes due to radiation therapy treatment. The reasons for such changes are multifactorial and may be related to the decrease of tumor and nodal volumes, weight loss, alteration in muscle mass and fat distribution, and fluid shifts within the body [5]. Therefore, the accuracy of IMRT delivery for HNC may be compromised during the treatment course, potentially affecting the therapeutic index. In this framework, adaptive radiotherapy (ART) is a potential solution, which consists of the explicit inclusion of the temporal changes in anatomy during the imaging, planning, and delivery of radiotherapy.
Adaptive radiotherapy has brought an additional dimension to the management of HNC patients and has the potential to counteract the effects of positioning errors and anatomical changes [6] but can be very labor-intensive [6, 7] Yet the decision when to replan and which patients are most appropriate for replanning is not well-defined. In this manuscript, we investigate benefits and drawbacks of a technique, which exploits weekly routine CBCT images to estimate the patient-specific geometric and dosimetric changes with respect to the planning CT. This technique aims to provide approximate dosimetric parameters to support making a decision whether acquisition of a new CT and replanning are urgently needed. At the present stage, due to the suboptimal quality of CBCT compared to the diagnostic CT reconstruction (patient scatter, hardening), the following CBCT based technique is not aimed at replacing proper replanning based on a new CT. However, with the advancement of CBCT reconstruction techniques in the commercial CBCT software it is conceivable that replanning could be completely based on CBCT in the nearest future. In either case, in this paper we address various factors impacting analysis of dosimetric changes in HNC patients due to weight loss and radiotherapy treatment.
Several adaptive replanning studies for HNC patients treated with IMRT based on serial CT scans have been reported [8–14]. Nevertheless, Brouwer et al [8] after reviewing fifty-one HNC adaptive studies concluded that heterogeneity between them prevented unambiguous conclusion on how to identify patients who may benefit from ART in HNC. There is a need for methods to utilize existing clinical data such as CBCT to explore the relationship between anatomical and dosimetric changes [15–21]. Deformable image registration (DIR) of CT to CBCT have been proposed by several authors [16–20] to evaluate the daily dose to the deformed structures. Nevertheless, the dosimetric results have been found greatly dependent upon the DIR algorithm chosen and careful examination of the auto-propagated contour is necessary [17, 19, 22].
In cost-effective clinical practice it is often important to provide an efficient estimation of dosimetric changes during the treatment course. For this reason, we investigated a more conservative approach based on rigid registration, which would avoid the more labor-intensive examination and verification of DIR contours. Nonetheless, we compared the results for rigid registration to those obtained by DIR.
Dosimetric calculation based on kV-CBCT images of HNC patients has been attempted by accounting for HU correction [23–25]. Due to the present suboptimal quality of CBCT images we sought to develop a technique that avoids the complication of such correction by relying on the HU values of the planning CT.
Ultimately, we aim to develop a practical clinical process in which simple metrics such as target volume coverage or dose to organs at risk, are used to alert the physician when a patient should be considered for replanning. Accurate replanning at this stage must rely on acquisition of a new CT scan due to the poor quality of CBCT from the present commercial Linac based systems.
2. Materials and methods
In our clinic patient setup is based on orthogonal kV-radiograph and weekly cone beam computed tomography (CBCT) are acquired immediately before the treatment for setup verification and can be used for monitoring of anatomical changes in HNC patients. With the present technique, we assessed dosimetric changes to planning target volumes (PTV) and organ at risks (OAR) due to patient external anatomical changes based on weekly CBCT images. We focused on changes in the head and neck tissue volume and the dosimetric consequences due to the variation of the tumor and OAR distance from the skin, discriminating between the shallow and deep regions (within and beyond the buildup).
We retrospectively analyzed radiation therapy (RT) data for 11 patients that received IMRT for HNC at our institution between 2013 and 2016. Criteria for patient selection was the relative large weight loss. IMRT was delivered with 9 (3/11 patients) or 10 fields (8/11 patients). We summarized in table 1 the list of cases along with the tumor type, patient weight and variation, and characteristics of the PTV70. The depth of the PTV70 center was measured as the shortest distance between the skin and the reference point of the PTV70 primary as defined by the planner. The volume of the PTV70 is reported along with the percentage of its volume falling within 1.5 cm from the skin (buildup of a 6 MV photon beam). The coverage of the PTV70 at the last CBCT is reported considering the value of V100, which is the percentage of the volume receiving at least 100% of the planned dose (70 Gy).
Table 1. Summary of the patients considered for this analysis. The initial weight was acquired on the day of the planning CT. The maximum weight variation corresponds to the maximum weight-change during the treatment course. PTV70 depth was measured as the shortest distance between the skin and the reference point of the PTV70 primary as defined by the planner. The % within 1.5 cm from skin is the percentage volume within the buildup region of a 6 MV beam. V100 is the percentage of the volume receiving 100% of the planned dose (70 Gy).
| Pt# | Tumor (Stage) | Initial weight (max change) | PTV70 depth (cm) | PTV70 volume (% within 1.5 cm from skin) | Bolus | V100 PTV70 last CBCT | Re-plan (fx) |
|---|---|---|---|---|---|---|---|
| 1 | Tonsil (T2N2b) | 106 kg | 4.2 | 107.6 cm3 | No | 99% | No |
| (+2.5%/−7%) | (4%) | ||||||
| 2 | Hypopharynx (T1N2b) | 89.9 kg | 3.7 | 296.0 cm3 | No | 98% | Yes |
| (+3.5%/−3.5%) | (15% ) | (13) | |||||
| 3 | Base of tongue (T2Na) | 111 kg | 3.1 | 127.0 cm3 | No | 96% | Yes |
| (+4.5%/−13%) | (3%) | (23) | |||||
| 4 | Tonsil (T3N2b) | 88.8 kg | 2.3 | 99.7 cm3 | No | 92% | No |
| (+3.5%/−12%) | (16%) | ||||||
| 5 | Thyroid (T4N2b) | 69.5 kg | Multiple nodes | 213.9 cm3 | Yes | 81% | No |
| (+0%/−20%) | (14%) | ||||||
| 6 | Base of tongue (T1N2b) | 71.4 kg | 2.6 | 160.3 cm3 | No | 83% | No |
| (+0.7%/−8%) | (32%) | ||||||
| 7 | Oral cavity (T2N2b) | 70.0 kg | 2.0 | 126.6 cm3 | No | 78% | Yes |
| (+1.7%/−11%) | (40%) | (14) | |||||
| 8 | Base of tongue (T1N1) | 81.2 kg | 2.9 | 82.1 cm3 | No | 91% | No |
| (+1%/−9.7%) | (22%) | ||||||
| 9 | Tonsil (T4N2b) | 73.6 kg | 3.9 | 152.4 cm3 | No | 95% | No |
| (+8.0%/−7.5%) | (23%) | ||||||
| 10 | Base of tongue (T4N2a) | 111.0 kg | 5.4primary | 243.3 cm3 | No | 94% | Yes |
| (−11%) | (9%) | (25) | |||||
| 11 | Oral cavity (recurrent, TxN3) | 68.2 kg | 4.1 | 390.6 cm3 | Yes | 90% | Yes |
| (−2.6%/+7.3%) | (28%) | (25) |
Following the standard for IMRT, each patient received a planning CT during the simulation. Contouring and treatment planning were performed on such CT prior to treatment. Radiation treatment was divided in 35 fractions and CBCT images were acquired weekly after alignment with orthogonal kV-radiograph. On average each patient was imaged with 6 CBCTs during the course of the treatment. Some patients (5/11) received an additional CT for replanning and an additional CBCT in the second part of the treatment. We used these additional CT for verification of our method. The total number of images considered in the analysis was 11 planning CT, 70 CBCT and 5 re-plan CT.
In the analysis reported below we use CBCT images as they are acquired after patient alignment using kV-radiograph. Using such radiograph based rigid registration our dosimetric analysis includes also the residual setup errors in addition to the geometric changes. Setup error can be excluded from the analysis by using CT to CBCT rigid registration. In the 'supporting information' file available on-line additional analysis based on CT to CBCT rigid and deformable registration is reported.
Using the ith CBCT images we defined the contour of the body surface (BodyCBCT(i)) by means of the automatic body contouring (with HU thresholding) in the EclipseTM (Varian Medical System, Palo Alto, CA) treatment planning system (TPS). We manually corrected BodyCBCT(i) slice by slice for CBCT ring artifact and dental artifacts making sure that the thermoplastic mask used for immobilization was not included in the body contour. We defined a new structure (BodyCT inf,sup, ant) to account for the CBCT missing anatomy such as nose, skull, shoulder ends by subtracting the CBCT field of reconstruction to the planning CT body surface (BodyCT). We then defined a modified planning CT (BodymCT) as the union BodymCT = BodyCBCT(i) U BodyCT inf,sup,ant. This was necessary step because CBCT reconstructs a finite volume and some of the inferior, superior or anterior portions of the anatomy may not be reconstructed. These anatomical features in BodyCT inf,sup, ant are either stable or not affecting the changes in dosimetry, but they must be accounted for in the analysis since the IMRT fields were often larger than the CBCT view. A graphic of the process flow to generate the BodymCT is shown in figure 1. The resulting modified planning CT (mCT) was used for dosimetric calculation in the TPS. We filled with water equivalent material (HU = 0) the regions where the BodymCT was larger than the body defined in the planning CT (BodyCT). This redefinition was necessary since the TPS dose calculation relies on the HU of the planning CT. This was affecting the first CBCTs where volume increase was observed in most of the cases. Dose calculations were performed using the parameters of the original treatment plan (MUs, gantry angles, MLC, fields, HU etc) of the CT but it was carried out using the modified external surface BodymCT.

Figure 1. Process flow to generate the modified CT body structure (BodymCT) by merging the BodyCBCT(i) and the planning CT BodyCT (units of the intensity are HU).
Download figure:
Standard image High-resolution imageIn this analysis, the PTV and OAR structures were kept as defined in the initial plan with important exceptions. When some regions of the original tumor/organ volumes were outside of the modified body BodymCT they were cropped to the skin and to 3 mm from the skin to avoid a minimum dose equal to zero and consequent dose volume histogram (DVH) with artificial reduced coverage. Note the 3 mm-from-the-skin technique is typically used in the delineation of PTV in the original plans unless bolus is used to boost the superficial dose. By using CT-to-CBCT deformable registration such cropping of the structures would not be necessary at the cost of additional uncertainties and additional time for the physician to verify the accuracy of the transferred contours. Such contour verification would be also complicated by the poor-quality CBCT images, which limits the possibility of soft tissue differentiation and reliable contour delineation. For these reasons, in this work we opted for the use of radiograph based rigid registration and for maintaining the initial PTV and OAR structures delineation with the cropping exposed above.
We subsequently compared mCT to planning CT for each fraction in terms of geometric and dosimetric changes as detailed below.
Additionally, based on the initial changes in anatomy between CBCT scans (e.g. CBCT(1)-CBCT(3)) we calculated patient-specific trends in the anatomical and dosimetric changes and we predicted the expected dose delivered at the end of the treatment (total plan sum). We verified this strategy based on the experimental data obtained for all fractions.
2.1. Metrics: anatomy
We analyzed the geometric changes in the body anatomy in the HN region by comparing external body surfaces for all fractions for which CBCT was acquired on a weekly basis. We analyzed CBCT data using Mathematica(Wolfram) [26] software. We defined the body contours in cylindrical coordinates (r(θ, z), θ, z) where r is the distance from the center of the body (patient axis) to the body surface for each slice z and θ is the polar angle in the transversal plane with respect to the patient left (see figure 2(a)). For every patient, we mapped the 3D Body contour into the 2D radial map of r(θ, z). The radial map was helpful in identification of the regions of the patient which underwent the largest changes in HN body mass (volume). Similar 2D radial map was recently proposed by Gros et al [15]. We also mapped the variations in the radius Δr(θ, z) of each CBCT body surface with respect to the planning CT and we calculated the average quantities 〈Δr〉(θ) (over all z-slices), 〈Δr〉(z) (over all directions θ), and 〈Δr〉chin (average over all directions θ and over 10 z-slices centered at chin level).
Using these radial metrics we determined locations of gross changes and we also calculated the total volume changes in the relevant HN region defined as: ΔV = δz π Sumi ( ), δz = 2.5 mm is the slice thickness and ri,CT and ri,CBCT are the average radius of each slice i. We also analyzed total patient weight (mass) as a function of fraction and compared it to the geometric metrics.
2.2. Metrics: dose
Dose calculations were performed using EclipseTM TPS and modified mCT as described above. The maximum, minimum and mean doses for all the structures of interest were calculated and the DVH (cumulative and differential) as well. A meeting was held amongst the head and neck clinicians to determine preliminary metrics that would prompt an 'alert' for consideration of adaptive replanning. The following candidate metrics were proposed for this study:
For organs at risk (OAR):
- To be alerted when the cumulative plan for each fraction is estimated to be at 103% (and at 10difference in the radius5%) of the maximum dose when compared to the initial plan.For planning target volumes (PTV):
- An alert when we expect an absolute 3% decrease in the volume covered by prescription dose with respect to the initial plan. In other words, if for instance V100 = 95% for PTV70 at the initial plan, an alert would be generated when it is expected that 92% of PTV70 will be covered by 70 Gy if not re-planned. Alerts would be prompted when the 3% coverage loss is expected for the original PTV structures and/or for the PTV cropped at the skin surface, and an additional alert would occur if the 3% coverage loss occurs also in the PTV cropped at 3 mm from the surface (more stringent requirement).
3. Results
3.1. Geometrical changes
The volume change in the HN follows the trend of the total weight loss. The average total weight loss at the end of the treatment was 7.2 ± 4.2 kg (8.5% ± 5.3%) corresponding to 270 ± 190 cm3 (6.2% ± 4.6%) volume loss in the HN region. It is worth noticing that the volume change extracted directly from the CBCT based analysis of the body volumes in TPS is equivalent to the one we calculated using the radius method (ΔV defined above). PTVs and OARs volumes change with total body surface change only when they are close to the skin surface. The volume of parotids cropped to 3 mm changes on average of about −12% while the volume of PTV70 cropped at skin and at 3mm-to-skin changed of about −3% and −6% relative to about 6% HN volume loss. Figure 2(b) is a radial map r(θ, z) for the CT of patient 1. The horizontal grid lines correspond to the location of shoulders, mouth, chin and eyes while the vertical ones correspond to patient left, right, front and back (270°, 90°, 0°, 180° Linac gantries). In figure 2(c) we show the 2D map of the difference in the radius Δr(θ, z) between BodyCT and the BodyCBCT(6) obtained from CBCT(6) acquired before the 30th fraction. The temperature map of Δr(θ, z) highlights the region with larger weight loss (in this case the left and the right sides of the neck). We show in figures 2(d) and (e) 〈Δr〉(θ) and 〈Δr〉(z) respectively for every BodyCBCT(I = 1,2,3,4,5,6) corresponding to fractions 6, 11, 16, 21, 25, 30. It is evident that the patient neck radius increased at the beginning of the treatment especially in the region of the neck left and right side 30 degree towards the back (see the negative blue curve corresponding to CBCT(1) in figure 2(d)). This increase in neck mass in the first one or two weeks of treatment was seen was seen for 8/11 patients. Subsequently the patient has lost weight and the average increase of 〈Δr〉 is seen both in the angular 〈Δr〉(θ) and the azimuthal 〈Δr〉(z) plots (figures 2(d), (e))). In figure 2(f) we compared the HN volume change ΔV to the patient total weight acquired on the same day of the treatment fraction considered.
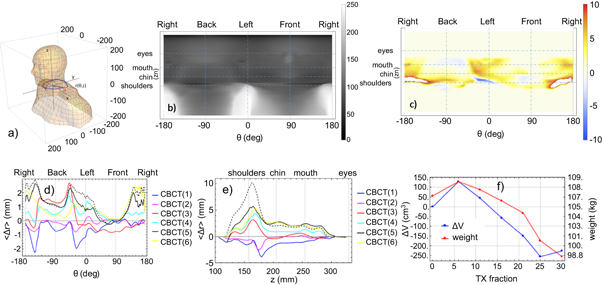
Figure 2. (a) Diagram of the body surface of patient 1. In blue, is one contour to show the cylindrical coordinates (r(θ, z), θ, z) used in the 2D radial maps. (b)–(f) Geometric changes in the body during the course of treatment for patient 1; (b) 2D intensity map of r(θ, z) of the BodyCT (intensity scale units is mm); (c) 2D map of the difference in the radius Δr(θ, z) between BodyCT and the BodyCBCT6 (intensity scale units is mm); (d) 〈Δr〉(θ) for every BodyCBCTn which is the averaged Δr(θ, z) over all the slices z; (e) 〈Δr〉(z) for every BodyCBCTn which is the averaged Δr(θ, z) over all the angle θ; (f) total volume change ΔV in the HN region is compared to the total weight of the patient.
Download figure:
Standard image High-resolution image3.2. Dosimetric changes
Dose to PTV and OAR were calculated using EclipseTM TPS and the modified mCT for each CBCT fraction. The method was verified by means of the re-planning CT available for 5 patients. Good agreement was found between the re-planning CT and the CBCT-based method proposed (see figure S1 in the supporting information file is available online at stacks.iop.org/BPEX/4/055009/mmedia).
The above mentioned geometric changes have an impact on the dose delivered to the PTV and to the OAR. In figures 3(a), (b) we show an axial CT slice of two patients (1 and 4). Patient 1 has a deep PTV70 with a large portion of the PTV that is beyond the buildup region of a 6 MV beam for all CBCTs, while patient 4 has a shallow PTV70, with a portion in the buildup region for the planning CT. This means that a portion of the PTV falling within the buildup region may become under-covered by the target-dose when sufficient weight loss occurs in that region. Notice also the body contours of the planning CT (green) and the noticeable shrinkage of the body contour in one of the CBCT toward the end of the treatment (fraction 30 for patient 1 and 32 for patient 4). In figure 3(c) we show a schematic of dose change to PTV based on the percent depth dose (PDD) of a single beam. As the patient body shrinks the PDD of a single 6 MV beam is shifted towards the new body surface. In addition, for tangential fields there is loss of scatter due to body loss which also decreases the overall dose in the buildup region. Consequently, the shallow/deep portions of the PTV receives lower/higher doses. The simplistic representation of PDD in figure 3(c) is meant to help the reader to appreciate the main reason for the shallow/deep portion of the PTV receiving lower/higher dose. Of course, the situation is far more complex than that due to heterogeneities, to multiple beams at different angles. Our analysis below is based on AAA algorithm in Eclipse TPS. In this analysis, we assume that the PTV margins account for the day-to-day setup errors and we focus only the systematic changes of the body surface.

Figure 3. Comparison of (a) patient 1 and (b) patient 4. BodyCBCT(i) toward the end of the treatment (white) compared to BodyCT (green) and PTV70 (red) contours are highlighted. Patient 1 has a deep PTV70 while patient 4 has a shallow one. In the analysis of dose for CBCT(7) the PTV70 structure was cropped to skin and to 3 mm from skin. (c) Schematic of dose change to PTV: as the body contour shrinks the percent depth dose (PDD) of a single 6 MV beam is shifted. Consequently, the shallow/deep portion of the PTV receives lower/higher dose.
Download figure:
Standard image High-resolution imageIn figure 4 we present the differential DVH (dDVH) and cumulative DVH (cDVH) for the PTV70 of patient 1 and 4. Figure 4(a) shows a dDVH, which shifts towards lower doses for CBCT(1) and (2) according to the increase in the HN volume at the corresponding fractions 6 and 11 (see figure 2(f)) and subsequently shifts towards higher doses for fractions corresponding to volume shrinkage (16, 21, 25, 30). Notice that the shape of the dDVH is roughly unchanged since the PTV70 volume is well within the body contours. Figure 4(b) shows the corresponding cDVH showing good PTV-coverage (V100 > 95%) during the treatment course. In contrast, for patient 4, the PTV70 is gradually cropped by the body surface shrinkage. The shape of the dDVH in figure 4(c) changed gradually with a higher average dose but also with larger volume receiving lower doses. As a consequence, the coverage of the PTV is degrading (see figure 4(d)) because the region of the PTV close to the surface receives lower dose than initially planned (see figure 3(c)).

Figure 4. Differential (a), (c) and cumulative (b), (d) dose volume histogram for PTV70 of patient 1 (a), (b) and patient 4 (c), (d).
Download figure:
Standard image High-resolution imageIn figure 5 we show the relative % change in the maximum and minimum dose to PTV70 along with the variation in the coverage (V100) with respect to the average change in radius 〈Δr〉chin in the chin region for all patients. Data for the other PTVs are reported in the supporting information file. For min dose we considered the PTV structure cropped at 3 mm from skin (labeled PTV_XX00_03 in figure 5) while for coverage V100 we considered the PTV cropped to skin (labeled PTV_XX00_00); this redefinition of the structures was necessary to avoid fake dose values when voxel close to skin or outside of the body are considered. For some patients (1, 2 and 3) a linear increase of max dose as body shrinks is observed, for others a more complex variation is observed. Notice that in some cases the dose variations due to error in patient setup are larger than the anatomical dose variations (for instance the irregular oscillations in pt. 9). This uncertainty is removed when CBCT-based rigid registration is used instead of radiograph-based rigid registration. We kept the latter in our analysis since it is the closest estimation of the dose-of-the-day as radiograph were used to align the patients in the clinical procedures.
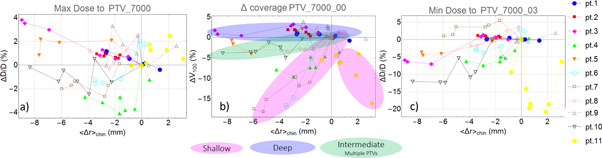
Figure 5. Dosimetric versus geometric changes in PTVs: Relative % change in the maximum (a), ΔV100 (b) and minimum (c) dose to PTV70 with respect to the average change in radius 〈Δr〉chin in the neck region at the level of the chin for all patients. For Min doses we considered the PTV cropped at 3 mm from skin while for ΔV100 we considered the PTV cropped to skin. In figure 5(b) we highlighted three groups based on Shallow, Deep or Intermediate/Multiple PTV70 which they clearly show different behavior. Data for other PTVs are reported in the supporting information file.
Download figure:
Standard image High-resolution imageAs a general trend, we observed that a 9 mm shrinkage in the head and neck radius may correspond to up to 4% maximum dose increase to PTV70, 3% maximum dose increase to PTV63 and about 4% maximum dose increase to PTV56 (PTV63 and PTV56 are shown in the supporting information file). While the maximum dose to PTV70 increased with body shrinkage, the minimum dose depends on the PTV depth. For example, the dose change for patient 1 and 2 that have a deep PTV70 is almost zero while for patients 4, 5, 6, and 10 with shallow PTV70's, the minimum dose is decreased up to 12% for about 9 mm of average radial shrinkage. An increase in the hot spot and loss of homogeneity (larger range) have also been reported by several previous studies based on CT [9–14]. Patient 11 has a 7% weight increase during the treatment while a shrinkage of the tumor was observed. His/her dosimetric changes are in the opposite direction compared to other patients because the radius increased in the posterior region of the neck due to weight gain while the radius decreased in the anterior region of the neck due to tumor shrinkage. The coverage of PTV70 is maintained during the treatment for patients with deep PTVs and with small portions the PTV in the buildup region (see pts 1, 2, 3 and 9 in figure 5(b) highlighted as 'Deep') while a coverage loss of up to 18% is observed in patients with very shallow PTV70 (see pts 4, 6, 7 and 11 in figure 5(b) highlighted as 'Shallow'). Patient 5 and 10 have PTV70 with multiple nodes and they show an intermediate behavior since some nodes are deep and others are shallow (Highlighted as 'Intermediate/Multiple PTVs' in figure 5(b)).
In figure 6 we present selected OARs showing the relative change in the maximum dose (mean dose for parotid glands) with respect to the average radial change 〈Δr〉chin in the neck region at chin level. In general, the OAR's receive equal or higher maximum dose as the body volume shrinks. The maximum dose increases up to about 4%–5% for a 9 mm shrinkage in the radius for cord, brachial plexus and mandible (see figures 6(b), (c) and supporting information file figure S6). Parotid was cropped at 3 mm from skin (figure 6(a)). Mean dose to parotid increased up to 4%–5% for some patients while for others it decreased up to about 4%.

Figure 6. Dosimetric versus geometric changes at some OARs: Relative % change in the mean dose to the parotid (a) and in the maximum dose to (b) cord, (c) right Brachial plexus with respect to the average change in radius 〈Δr〉chin in the chin region for all patients.
Download figure:
Standard image High-resolution image
In table 2 we summarized the dosimetric alerts generated for physician review which are outlined in the materials and methods section. The loss of coverage refers to V100(CT)-V100(CBCT(i))>3% where V100 is the volume receiving 100% of the planned dose. Coverage is evaluated on the PTVs cropped at skin surface. The alerts refer to the dose changes with respect to the initial planning CT. For patients that were replanned, we designed alerts assuming they would not be replanned as this was an a-posteriori study. It is worth noticing that these alerts, though, did confirm the decision to replan as the alerts were no longer valid when the new planning CT was considered for dose calculation. Patient 4 has many alerts for the PTV under-coverage. In this case the patient received an extra fraction at the end of the treatment due to multiple missed treatments. The data in this study confirmed the clinical decision and the patient remains without disease more than 3 years after treatment-completion. These alerts may help the physician to decide which patients may benefit from adaptive replanning and when they should be replanned.
Table 2. Summary of patient-specific dosimetric alerts. Loss of coverage V100(CT)-V100(CBCTn)>3% is the PTV alert (for PTVs cropped at skin) while a dose change ΔD = DCBCT-DCT larger than 3% is the OAR alert. Legend: (fx): treatment fraction, (CT) refers to planning CT. *these patients were replanned (pt. 2 before fraction 13, pt.3 before fraction 23, pt 7 before fraction 14, pt. 10 before fraction 25, pt. 11 before fraction 25). Amongst the replanned patients, alerts were assigned by comparing with the original planning CT, by considering the new planning CT these alerts were not generated.
| OAR: (fx) ΔD Brachial plexus | OAR: (fx) ΔD | OAR: (fx) ΔD | |||||
|---|---|---|---|---|---|---|---|
| Patient | PTV70 (fx) V100 | PTV63 (fx) V100 | PTV56 (fx) V100 | Left | Right | Mandible/Larynx/Parotid | Esophagus/post-cricoid |
| 1 | (CT) 97%, | (CT) 98% | |||||
| (25) 92%, | (25) 92%, | ||||||
| (30) 93% | (30) 94% | ||||||
| 2* | (CT) 98% | (19) 3.1% | (31) 3.4% | Mandible | Esophagus | ||
| (19) 95%, | (25) 3.3% | (13) 5.5%, | (13) 15%, | ||||
| (25) 93%, | (19) 5.7%, | (19) 15%, | |||||
| (31) 93% | (25) 6.3%, | (25) 15%, | |||||
| (31) 6.0% | (31) 15% | ||||||
| 3* | (CT) 97%, | (CT) 98% | (20) 3.7% | (20) 3.9% | |||
| (20) 92%, | (20) 95% | (28) 3.5% | (28) 3.4% | ||||
| (28) 91%, | (32) 3.0% | ||||||
| (32) 90% | |||||||
| 4 | (CT)99.8% | (CT) 99% | (CT) 99% | ||||
| (3) 96%, | (7) 96%, | (21) 95%, | |||||
| (7) 95% | (13) 95%, | (26) 94%, | |||||
| (13) 93%, | (18) 93%, | (32) 94% | |||||
| (18) 93%, | (21) 95%, | ||||||
| (21) 95% | (26) 92%, | ||||||
| (26) 90%, | (32) 92% | ||||||
| (32) 92% | |||||||
| 5 | (CT) 82% | (CT) 86% | (13) 4.7% | (32) 3.3% | Larynx | Post cricoid | |
| (16) 78%, | (16) 76%, | (32) 4.3% | (13) 3.8%, | (13) 3.3% | |||
| (16) 3.7%, | (32) 3.0% | ||||||
| (32) 4.4% | |||||||
| 6 | (CT) 99% | (CT) 99% | |||||
| (5) 94% | (5) 95% | ||||||
| (19) 82% | (19) 91% | ||||||
| (24) 84% | (24) 93% | ||||||
| (29) 83% | (29) 90% | ||||||
| 7* | (CT) 95% | (CT) 96% | (CT) 98% | ||||
| (2) 84% | (2) 93% | (11) 91% | |||||
| (6) 84% | (6) 93% | (16) 90% | |||||
| (11) 80% | (11) 90% | (26) 88% | |||||
| (16) 86% | (16) 90% | (31) 87% | |||||
| (26) 77% | (26) 87% | ||||||
| (31) 78% | (31) 86% | ||||||
| 8 | (CT) 94% | (CT) 96% | |||||
| (16) 91% | (16) 93% | ||||||
| (21) 90% | |||||||
| (26) 91% | |||||||
| (32) 90% | |||||||
| 9 | (CT) 97% | Parotid R | |||||
| (2) 84% | (2) 4.8% | ||||||
| (6) 93% | (6) 8.3% | ||||||
| (11) 92% | (21) 3.5% | ||||||
| (25) 93% | |||||||
| (29) 93% | |||||||
| (34) 94% | |||||||
| 10* | (CT) 98% | (CT) 98% | (CT) 99% | (20) 4.1% | (25) 3.2% | Mandible | Esophagus |
| (20) 94% | (11) 95% | (21) 95% | (21) 4.3% | (20) 3.7% | (21) 3.1% | ||
| (21) 94% | (20) 94% | (25) 92% | (25) 5.4% | (21) 4.1% | (25) 4.7% | ||
| (25) 93% | (21) 94% | (30) 92% | (30) 3.3% | Parotid | (30) 3.2% | ||
| (30) 94% | (25) 95% | (20) 3.2% | |||||
| (30) 95% | (21) 3.6% | ||||||
| 11* | (CT) 96% | (CT) 97% | NA | Mandible | |||
| (1) 80% | (1) 92% | (14) 4.5% | |||||
| (9) 92% | (9) 93% | (19) 3.7% | |||||
| (14) 90% | (14) 92% | (28) 3.4% | |||||
| (19) 87% | (19) 92% | ||||||
| (24) 92% | (28) 93% | ||||||
| (33) 90% | |||||||
4. Discussion
We analyzed 11 patients with significant weight loss (average 7.2 kg (8.5%) with a standard deviation of 4.2 kg (5.3%)) because those are the patients that are more likely to benefit from replanning [13]. This study is limited to only 11 patients (70 CBCT scans and 5 re-plan CT) but, nevertheless, provides some important insights into the trends of both geometrical and dosimetric trends and correlations between various metrics. Even though each patient has different PTV locations and sizes, treatment plan, and anatomical features for many structures, the relative % dose (min and max doses) is quasi-linear with the average radial change. Up to fractions 7–15 the volume increased for most patients (8/11), after which there was a decrease in head and neck mass and the changes may have a significant dosimetric impact and should be cautiously monitored. The cause of the initial increase in body mass is not known, and could be related to several factors including hydration with chemotherapy. In one patient (pt. 11) the weight increased while the tumor volume was greatly reduced during treatment. Such patient shows an opposite behavior because the neck radius increased in the posterior of the neck while it decreased in the anterior (tumor location).
The slope of such quasi-linear relation %dose - radius is patient-specific and can be determined based on the initial 3 or 4 CBCTs. It is unlikely that during the initial 3 weeks of treatments patient body loss rate will be greater based on this limited data. Radial maps (figure 2) used in our study are useful in identification of the regions that experience gross changes. They are also helpful in approximate estimation of dosimetric changes and thus in prognostic computations based on past data (up to the present fraction). Although dose computations are patient specific the relation between the average radius and dose is quasi-linear.
We performed a prognostic calculation of dosimetric changes to PTVs based on the first few CBCT and the result agreed well with the actual cumulative dose obtained at the end of the treatment considering all the CBCT data. In most cases the prognostic calculation based on 3 or 4 CBCTs is within 1% of the actual cumulative dose. This result is promising as we move toward clinical implementation but it requires optimization of CBCT acquisition. It is expected that by acquiring more CBCTs during the treatment course the prognostic calculation would improve. We reported an example of prognostic calculation of the cumulative dose to PTV70 in the supporting information file (figure S7).
Our results agree with previous studies [8–14]. Bhide et al [9] reported the first prospective observational study with 20 patients (average weight loss of 9.7%) in which they observed an average decrease of the minimum dose to PTV70 of 2 Gy and an increase in the dose range of 2.5 Gy. Our values are similar: we observed on average 2.5 Gy minimum dose reduction and 2.6 Gy increase in the dose range. Several other studies [10–13], which were based on additional CT scans during treatment, have reported similar degraded coverage and progressive increase in dose inhomogeneity to the target volumes. A summary review by Brouwer et al [8] reported on fifty-one different studies for HNC patients that focused on anatomic changes and OAR effects. They reported a 2.2 ± 2.6 Gy dose increase to parotid glands averaging the results of twenty-four studies. We found mean dose to parotids to be reduced on average of −0.3 Gy ± 1 Gy (−0.6% ± 2.4%). Our result is in the lower limit of such distribution. A possible explanation is that we did not re-contour the parotid glands at each CBCT due to the lack of quality in the CBCT images and therefore we did not account for the possible shift of the glands toward regions with higher dose (PTVs). Castelli et al [14] have reported a shortening in the distance between PTV and parotid gland which may result in a further dose increase to the parotid. To quantify this effect, we considered the five patients who were replanned (see table 1) and the same physician recontoured the parotid based on the new planning CT. We found that an underestimation of the parotid mean dose due to the lack of recontouring occurred in 7 out of the 10 parotids while in 3 cases the dose was overestimated. On average there was an underestimation of 0.6 Gy ± 3 Gy (ranging from −6 Gy to 5 Gy). The use of deformable image registration for parotids contour propagation may help to improve their dosimetry; DIR leads in some cases to larger noise but it is often closer to the ground truth (structure contoured by the physician on the new CT) with respect to the radiograph- and CBCT-based rigid registration methods (see the supporting information file online for details).
Fifteen studies [8] reported dose changes in the spinal cord (in terms of DMax, D1% or D2%) at different time points (ranging from 15th fraction to end of treatment) with an average max dose increase of 1.3 Gy ± 1.5 Gy (data from table S3 in Brouwer et al [8] not weighted by time point or by number of patients). We obtained an increase of the max dose to cord at the end of the treatment up to 1.7 Gy for the patients with largest neck volume reduction (0.3 Gy ± 0.6 Gy averaged over all patients).
Ahn et al [10] tried to correlate dosimetric and geometric changes and concluded that no single external variable such as weight loss, fraction number, or changes in skin separation can reliably predict for the need to initiate the replanning process, due to the confounding effect of positional variability. In our study, we accounted for such positional variability because in our workflow, patient setup was based on daily radiograph and weekly CBCT acquired for the verification of the setup. While we did observe day-to-day setup error, which resulted in the noise of our data, we nevertheless observed a quasi linear relationship between dose to PTV and OAR's and the neck-radius. We independently verified that such noise can be reduced by using CBCT-to-CT rigid registration. Brouwer et al [8] in their review reported as well that a number of variables correlated significantly with an increase in dose to certain OARs including weight loss and change in neck diameter.
The use of routinely CBCT images instead of additional CT data is the advantage of this study but also its limitation since some parts of patient anatomy can be cropped in CBCT images (shoulders, top of head) and the image quality is lower than CT images. Filling the missing part of the CBCT with planning CT-data creates additional uncertainties at the junction planes. These artifacts are nevertheless at the edges of the radiation field. There may be some level of error due to not modifying the PTV/OAR other than cropping to 3 mm from the skin. This may result in small errors in the dose estimation for structures which shrink or move during the treatment (tumor and parotid glands for instance). CBCT parameters must be optimal to obtain the better image quality as possible and CBCT images must be acquired with the same parameters for each patient and registered with the planning CT. A potential problem in the registration of CBCT to planning CT is highlighted in figures 2(d) and (e). The black dashed line corresponds to the case of misalignment of 2.5 mm (i.e., 1 slice) of the CBCT with respect to the planning CT. Such misalignment causes a large change in 〈Δr〉 especially in the region of the shoulders where a big radial change occurs, this error may arise from shoulder positioning on different days of the treatment. Therefore, it is recommended that CBCT be well registered with planning CT before its use for this workflow. The dose versus volume relation bears uncertainties due to residual errors after registration of bony anatomy. These uncertainties are expected to decrease with fine registration based on CBCT images, although non-linear deformation of head and neck anatomy cannot be excluded (e.g. shoulders versus neck) in this workup. Residual errors are both rotations and translations. Rotations are especially difficult to deal with. But most problematic is orientation of shoulders with respect to neck and bending of the neck/head. These are the day-to-day differences which are also seen in the plots (noise and large oscillations). Similar analysis of doses versus radial changes done for a mathematical phantom revealed almost exactly linear dependence demonstrating that the quasi-linear trends in our experimental data is due to noise in the registration and not due to systematic trends in dosimetry.
The use of Deformable registration (DIR) has the potential to improve the propagation of contours from the CT to the mCT, but it requires good quality images to be effective and moreover it requires verification by an expert clinician. We investigated the use of DIR in our workflow and we concluded that it might be possible to use CT-to-CBCT deformable registration only to improve the evaluation of the parotid dosimetric changes. For other structures, such as cord, brainstem, brain, esophagus and cochlea and often PTV63 and PTV56, which are not entirely in the CBCT field of view, deformable registration cannot be used. For the PTV70 it is recommended to maintain the conservative approach of keeping the original contouring to avoid the possibility of missing the treatment of part of the tumor. Additional information can be found online in the supporting information file.
Finally, from the practical perspective, radial metrics developed in this work are not unique and could be replaced by similar metrics. For instance, one could consider using calibrated lateral radiographs or optical scans of the head and neck surface to assess the body mass loss. A lateral radiograph represents a total separation. One could compute the average separation as a function of slice z.
5. Conclusions
We retrospectively analyzed 11 patients who received IMRT treatment for HNC. We focused on geometrical changes based on weekly CBCT images and calculated the dose for each fraction by modifying the CT body surface based on CBCT images. The method was verified by means of the re-planning CT and good agreement was found between the re-planning CT and the CBCT-based method proposed. We then compared geometrical and dosimetric variation during the treatment with the purpose of providing threshold based alerts. From our analysis, we found that:
- 1.The volume change in the neck region, the lateral neck separation (LNS) and the average radial change at chin level 〈Δr〉chin follows the trend of the total body weight in a quasi-linear manner due to day-to-day noise with a slope and offset that depends on the patient geometry. The maximum anatomic change typically occurs by the third week of treatment which may be the optimal time to determine which patients need to be replanned. Furthermore, change in weight alone may be sufficient for a preliminary screening of patients for re-planning, assuming it is done in a consistent fashion.
- 2.The major anatomical changes (volume loss in the neck region) due to weight loss often occurs asymmetrically in the neck portion between shoulders and chin with the largest variation in the left and right of the neck; the anatomical changes due to tumor shrinkage are dependent on tumor location and its response to the treatment.
- 3.The percentage dose change with respect to the initial plan are patient-specific and varies almost linearly with the average change in the neck radius for deep PTVs. For instance, an average radial change at chin level of 9 mm corresponds to a maximum dose change up to 4% to the PTV. By comparing different patients, the average radial change at chin level after last fraction was found between 3 mm and 9 mm and the corresponding dose increased between 1% and 4%. PTVs with a large portion in the buildup region showing a decrease of the maximal dose.
- 4.A deep PTV maintains good coverage (V100) over all the treatments, while for a shallow PTV coverage may become degraded because the portion close to the skin receives lower dose (shift of the PDD for orthogonal fields and loss of scatter for tangential fields).
- 5.The OARs receive equal or higher doses as the body volume shrinks (maximum dose up to 4%–5% for 9 mm shrinkage in the radius, apart for few exceptions).
Based on our data, if a PTV is deep (PTV center >3 cm) with small portion of it in the buildup region (<15%), the coverage losses are expected to be below 3% and negligible while for shallow PTVs (with center <3 cm and with more than 15% of it in the buildup region) major coverage losses are expected even with few mm of neck radius reduction. Target volumes with multiple nodes require a special attention as well since both shallow and deep nodes contribute in different ways to the total coverage.
The technique that we used in the present study may be implemented in the clinic for quick estimation of these dose changes and help the physician in the decision making in adaptive replanning process. A clinical implementation of these results would benefit from a custom software for automatic calculation of dosimetric and anatomical changes based on CBCT images at a certain fraction.
Based on our results and analysis, we conclude that with the present state of CBCT reconstruction algorithms (FDK—Varian) re-planning must rely on a new CT. However, with the continual improvement of CBCT algorithms (for instance iterative with better handling of scatter and other type of artifacts), an adaptive re-planning based on CBCT might be pursued in the future. This study is an important contribution to the drawbacks and limitations of the present CBCT and can serve as a guideline for future developments in this area.
Acknowledgements
This work was supported by the Kayes family award. The authors are grateful to Lyatskaya Yulia for her suggestions and support.