

Abstract
Bioprinting experiments have emerged as an approach for studying complex cellular interactions in the context of spatial structure, ranging from intracellular networks to interspecies interactions in communities. Despite the progress made in developing and optimizing computational modeling parameters to recapitulate these interactions in silico, experimental verification of model predictions in vitro is often elusive, due to the limits of common laboratory culturing methods, especially at the micro- and nanoscale. In this work, micro-scale bioprinting was used to evaluate the spatiotemporal effects of metabolite sharing between partners in an artificial syntrophic consortium consisting of Salmonella enterica serovar Typhimurium and Escherichia coli. Micro-colonies of these bacteria were patterned at increasing spatial separation distances, in the presence of competitor or cooperator strains. Growth of the consortium members was evaluated and compared to predictions generated by a bacterial growth modeling platform known as Computation of Microbial Ecosystems in Time and Space (COMETS). In close agreement with simulation, experimental metabolite sharing between micro-colonies exhibited strong distance-dependency. When bioprinted micro-colonies were confronted with one-way or two-way diffusion barriers, such as the intervention of cooperative or competitive bacteria, experimental results showed that spatial positioning of the barriers critically influences metabolite sharing between consortium members. These results were generally predicted by simulation in COMETS. Our results demonstrate the utility of micro-scale bioprinting to experimentally test which aspects of predictive microbial growth models hold at this spatial scale, and for a range of synthetic biology applications.
Export citation and abstract BibTeX RIS
1. Introduction
Observation and characterization of bacterial interactions within complex populations is important for understanding fundamental cellular behavior and the impact these interactions have on the surrounding environment at every ecosystem-scale. In addition, the study of microbial interactions within consortia has many potential industrial applications, ranging from drug development, to synthetic biology [1, 2], and to bioremediation [3]. In spite of this, little is understood about these microbial processes, largely due to the challenges of observing microbial community behavior in well controlled, laboratory microenvironments [4]. In particular, traditional cell culturing methods often fall short of maintaining the necessary control over the spatial distribution of cells and diffusible molecules. This can make studying microbial interactions such as diffusion-based metabolite-sharing [5, 6], chemotaxis [7, 8], and quorum sensing [9, 10], a challenge to execute in the laboratory, especially on the micro-scale [11].
In recent years, groups interested in quantifying these interactions have begun developing computational models to predict cell behavior under specific conditions [4, 12, 13]. However, the same culturing limitations which limit the capacity to directly observe the microbial consortia behavior in vitro have so far also limited the possibility of validating computational predictions experimentally. Some modeling approaches have been focused on simulating homogenous, well-mixed environments or environments with populations patterned on the macro-scale, as these types of conditions are more readily replicated using liquid cultures such as chemostats and batch reactors [4, 12, 14] or macro-scale plating techniques [4, 15]. These approaches often use simplifying assumptions, such as a uniform distribution of nutrients or organisms within the system, which may not accurately predict growth rates or cellular behavior when spatiotemporal dynamics are prevalent and often do not reflect the heterogeneity found in most natural ecosystems [16, 17].
In parallel, multiple computational approaches have been developed for modeling the spatio-temporal dynamics of cellular growth and inter-cellular interactions, with the goal of predicting population-level behaviors, such as cooperative growth [18], morphogenesis [2], and communication [19]. The over-arching goal of these tools is to extrapolate from single cell and single organism behaviors, to that of more complex communities. Computation of Microbial Ecosystems in Time and Space (COMETS) is a mathematical modeling platform which strives to predict the spatio-temporal dynamics of microbial growth and interactions at multiple ecosystem levels, ranging from small cell populations to large structured consortia [16]. By simulating metabolite-mediated interactions as emergent properties, which can vary in time and space, COMETS can provide a nuanced picture of cellular interactions within diverse communities and across non-uniform environments [17].
By utilizing the intracellular metabolic stoichiometry generated from a microbe's genome in combination with a dynamic flux balance analysis (dFBA) algorithm [20], COMETS is able to link internal metabolism with dynamics of the external chemical environment to predict time-dependent changes in microbial biomass [21]. These changes can occur in different spatial location, approximated as boxes on a lattice. In addition to biomass growth in each box, COMETS simulates the diffusion of metabolites across different boxes, enabling the emergence of diffusion-based interactions between multiple bacterial species. Importantly, each species is assumed to regulate its own metabolic activity towards the optimally efficient growth capacity. Interactions such as metabolic competition and cross-feeding are thus not assumed a priori in COMETS simulations. Rather, they are observed as a natural outcome of each organism trying to achieve its own optimum, integrating internal resource allocation with sensing and uptake of metabolic byproduct available in the immediate surroundings. Such byproducts could in turn be the outcome of secretion from other organisms and subsequent diffusion. COMETS has been previously shown to accurately predict the effects of inter-species nutrient competition and metabolic cross-feeding within complex environments on the macro-scale (approx. 2 mm diameter colonies, separated by 10 mm distance). A particular configuration, termed 'the eclipse dilemma' [21], was particularly useful to study the effect of additional biotic complexity upon the selective forces underlying mutualism [22], and to determine how ecological and environmental parameters interact to drive differences in colony yields caused by spatial proximity [23].
Here, we used bioprinting to experimentally test COMETS simulations at the micro-scale. We examined colonies which occupied areas over 11 times smaller than the previously studied colonies, and that were separated by a much smaller distance (2 mm). We utilized a pin-based microarrayer to print bacterial microcolonies, an approach that is significantly less complicated than other forms of bioprinting, including inkjet- [24, 25], extrusion- [26], and laser-based [27] technologies. Of these existing approaches, inkjet [28, 29], and laser-based [30–33] are the most commonly used for applied bacterial bioprinting. This is primarily due to the benefit of high spatial resolution of these techniques, with average printed spot sizes typically <100 μm in diameter. This resolution permits the patterning of low cell densities or even single cells [29], [31–33]. However, these approaches require specialized equipment and experimental setups which led us to adapting an automated protein microarrayer to print bacteria, at the expense of lower resolution, for micro-scale consortium population testing. The ultimate goal of our work was to validate COMETS predictions beyond the macro-scale, and to demonstrate a simple, yet effective bioprinting approach for studying bacterial interactions.
To test the predictions of COMETS regarding interspecies cross-feeding, we sought to use a mutualistic consortium composed of well-characterized and sequenced strains. The artificial consortium we selected, consists of S. enterica and an E. coli mutant auxotrophic for the amino acid methionine. Each partner is reliant upon metabolites generated by the other when growing on a medium which lacks methionine and with lactose as the only carbon-source. Growth was tracked through time at the microscopic level allowing far greater resolution of system dynamics. Competition between bacterial micro-colonies was evaluated both within COMETS and via experiment, to determine how the presence of conspecific competitors outside the path of metabolite exchange can interfere with diffusion of nutrients between cooperators. Herein we demonstrate the utility of bioprinting for computational model validation by comparing growth data from micro-patterned colonies to predictions made by the COMETS software platform. We hypothesized that direct cell patterning could be used to establish structured microbial communities confined by geometry and nutrient availability to evaluate the interaction effects across species within controlled environments. In turn, this would result in an experimentation platform for extending experimental recapitulation of complex bacterial growth models with spatiotemporal capabilities to the micrometer scale.
2. Methods
2.1. Materials
The Arrayit Spotbot® 3 (Telechem, Sunnyvale, CA) microarray printer was used for all micro-scale bacterial printing experiments. All cell culturing materials were purchased from Sigma-Aldrich (St. Louis, MO), apart from lysogeny broth Lennox (LB) agar used for the initial plating which was purchased from BD Difco (Sparks, MD). Agarose for surface fabrication and printing solution formulation was purchased from Bioline (London, UK). Phosphate buffered saline (PBS) was purchased from National Diagnostics (Atlanta, GA). Ethanol for print pin decontamination was purchased from Decon Laboratories (King of Prussia, PA).
2.2. Printer modification
Modifications to the Spotbot® 3 included replacing the standard rinsing buffer in the pin wash station with 70% ethanol to facilitate decontamination of the printing pin between samples and heating the humidification flask to enhance water vapor delivery to the printing enclosure to rapid increase in humidity. To pattern cellular arrays with unique geometries a custom, open-source MATLAB (Mathworks, Natick, MA) script was used to generate the XML coding necessary to achieve novel print geometries not normally permitted by the standard printing software [34]. Arrays were designed in Microsoft Paint, while sample keys were prepared as text files in Microsoft Notepad. Whole cell microarray printing pins (Telechem) with 100 μm wide sample channels were used for patterning to deposit appropriately sized micro-colonies (between 500–700 μm in diameter) without clogging the channel during printing.
2.3. Cultures and printing solution preparation
Our experimental communities consisted of strains of E. coli K-12, and S. enterica LT2. The E. coli was ΔmetB from the Keio collection (CGSC# 10824 [35],) with the lac operon replaced via conjugation with E. coli HfrH PO1 relA1 thi-1 spoT supQ80 nad57::Tn10 additionally a cyan fluorescent protein (CFP) was integrated into the chromosome. Two genotypes of S. enterica were used. The first was a wildtype S. enterica LT2. The second was a methionine-excreting mutant that was created through a combination of engineering and selection as described in [36]. The methionine-excreting S. enterica had a yellow fluorescent protein (YFP) integrated into the genome. All cells were cultured in their respective defined growth media, consisting of Hypho defined media (2.92 mM lactose, 7.26 mM K2HPO4, 0.88 mM NaH2PO4, 1.89 mM (NH4)2SO4, 0.41 mM MgSO4, and 1 ml of Delaney's metal mix [37] with glucose substituted for lactose for S. enterica cultures and 10 mM methionine included for E. coli cultures. Colonies were picked from lysogeny broth Lennox plates and used to inoculate 7 ml liquid cultures consisting of their defined media, which were then incubated for 24 h at 37 °C. After 24 h, the cultures were spun down and re-suspended in 1 ml of fresh defined media and 100 μL of each culture was transferred to a fresh 7 ml liquid culture and incubated for 12 h at 37 °C to ensure the cells would be in the exponential growth phase when harvested for patterning. Before patterning, cells were spun-down and re-suspended in 100 μL of defined media with 0.1% agarose added. Agarose was included to increase solution viscosity to minimize spreading of the patterned spots, as well as to prevent sedimentation of cells during printing.
2.4. Printing surface preparation
Planar gel printing surfaces were formed by evenly casting a molten solution of consortium media (lactose +, methionine −, glucose −) with 5% agarose onto sterilized glass microscope slides. The solution was cooled until completely solidified, and then the surfaces were stored at 4 °C until required. Before printing, the surfaces were removed from storage and allowed to reach room temperature. Each agarose slab was flipped so that the planar side previously contacting the glass surface was positioned face-up and partially dried in a closed Petri dish for 20 min before patterning to prevent printed droplet spreading due to syneresis. Each slab was then cut into fifths (15 mm × 25 mm × 1 mm) to form the final printing surfaces.
2.5. Micro-colony printing
Prior to cell patterning, unique printing geometries and sample keys were designed in Microsoft Paint and Notepad, respectively. This was followed by decontamination of the interior of the printing enclosure and the printing pin with 70% ethanol. After printing solution preparation, each solution was vortexed for 30 s and 3 μL of each solution was loaded into a specific well of a 384-well plate, as defined by the sample key. After the SPA3's enclosure humidity reached 90% relative humidity, both the 384-well plate and the agarose printing surfaces were placed at their specified locations within the enclosure. During printing, each pin wash cycle was programmed to occur after 3 spots were patterned and between all solution changes. The wash cycle was programmed with a duration of 3 s for washing and 1 s for drying for the first two steps, followed by a 10 s wash and 5 s dry for the final step. Each print was programmed to use a pin dwell time of 3 s to draw solution from the sample well and a 0.5 s dwell time for the pin when contacting the agarose substrate to deposit cells.
2.6. Culturing for observation
Before cell patterning, carrier plates were prepared by filling Petri dishes with molten 2% agarose in diH2O. The dishes were cooled and dried overnight at 4 °C before being sealed and stored at 4 °C until needed. After patterning, each printed surface was sealed into a carrier plate using parafilm to prevent surface drying and allow for easy handling of the patterned surfaces over the duration of the incubation and observation period. Carrier plates were incubated at 37 °C between all imaging steps. Fluorescent microscopy was performed using a Nikon Eclipse 80i microscope equipped with a QImaging QICAM Fast 1394 digital camera using a FITC filter at 48 h intervals to track changes in biomass. During imaging the carrier plates were opened under flame to prevent interference with the microscope objective and to provide clear images under sterile conditions. After each imaging period, a Pasteur pipette was used to deposit drops of sterile diH2O into the carrier plates to replace water lost due to evaporation upon the surface's exposure to ambient air during imaging.
2.7. Image evaluation
Images gathered during the observation period were analyzed using NIS-Elements AR 4.11 software (Nikon Instrument Inc., Melville, NY). All micrographs were captured using identical camera settings and exposure times for each species to maintain consistency between all experiments and time points. Intensity measurements were taken from the colonies by using the thresholding, smoothing and cleaning functions to remove all background pixels below a specific intensity. The threshold intensity was chosen for each individual sample by adjustment until all cell fluorescence was highlighted, while including as little background as possible. The fluorescence intensity of the highlighted pixels (those containing cells) were added together to determine the total sum intensity for each colony. The background intensity per pixel for bare surface was also recorded using an ROI, averaged and subtracted from each highlighted pixel to ensure all measured fluorescence intensity came from the cells only.
2.8. Conversion of intensity to cell density
Measurements of fluorescence intensity were converted to estimates of biomass by imaging printed micro-colonies which were grown for 12 to 36 h, which was followed by their removal from the surface and subsequent plating for colony forming unit (CFU) counts. Two sets of five separate surfaces consisting of each species respective defined media were patterned with twenty individual micro-colonies. After growth, three random micro-colonies from each surface were imaged using fluorescence microscopy so that average intensity measurements could be recorded. Each surface was then placed within a 50 ml conical centrifuge tube, along with 1 ml of PBS, and vortexed for 10 min in order to reclaim the printed cells from the surface. Cells suspended in PBS were removed from the tube and used to perform a ten-fold serial dilution. Each dilution was then plated onto a LB plate and incubated for 24 h for colonies to form. After 24 h CFU counts were performed, which permitted calculation of the average number of cells in the original, individual micro-colonies.
2.9. Genome-scale metabolic modeling
To determine the metabolic mechanism underlying observed evolutionary patterns we used constraint-based metabolic modeling. Genome-scale metabolic networks were obtained for E. coli (iJO_1366) [38] and S. enterica (iRR_1083) [39]. The models were modified to incorporate known genetic constraints in each model as described in [21]. Briefly the gene knockout in E. coli was modeled by constraining flux through the associated enzymatic steps to zero. Methionine excretion in the mutualist S. enterica was modeled by connecting excretion of the amino acid to the biomass equation that serves as the objective function. FBA models were converted to COMETS format with the script provided on the COMETS website (http://www.bu.edu/segrelab/comets/).
2.10. Simulation parameters
COMETS v. 2.2.11 was used to simulate the metabolic interactions and growth of colonies. Simulations were set up in a 40 × 60 lattice with each box having a width of 0.025 cm. The time step was set to 0.05 h. There was no cell death and no cell overlap was allowed. Biomass diffusion was maintained at 3 × 10⁻¹² cm2 s−1, and the metabolite diffusion was maintained at 5 × 10⁻⁶ cm2 s−1. The Gnu Linear Programming Kit (GLPK) was used as the optimizer. The oxygen concentration was set to 1.55 × 10⁻⁵ mmol/box. To mimic the experimental conditions, the lattice had two environments: the inner resource environment, which mimicked the media-laden agar upon which cells were bio-printed, which was nested within an outer 'moat' environment with no resources, to mimic the water agar the bio-printed environment was laid upon. The 'moat' consisted of 5 boxes surrounding the resource environment on all sides. The resource environment was therefore a 30 × 50 inner lattice. In the resource environment, lactose, the primary energy source, was supplied at 3 × 10⁻⁷ mmol/box. Glucose was supplied at 3 × 10⁻¹⁰ mmol/box to be consistent with the observation that minimal amounts of S. enterica growth were feasible in the absence of E. coli. NH4 and trace elements were supplied in unlimited amounts.
3. Results
3.1. Printed consortium controls
To confirm proper functioning of the consortium post-printing, each species was printed onto consortium media both in isolation and with partner colonies separated by a 2 mm, center-to-center distance. E. coli displayed no observable growth after 240 h in isolation (data not shown), while S. enterica did display slight growth in isolation conditions. When patterned at a separation distance of 2 mm, both partners exhibited observable growth for 240 h (SI figure 1 is available online at stacks.iop.org/BPEX/4/055010/mmedia). Background growth exhibited by S. enterica was dependent upon the presence of lactose within the media as only media with no carbon-source present prevented S. enterica growth in isolation (data not shown). This suggests impurities in the lactose underlie this observation. To account for this isolated growth in future experiments, all in vitro data for S. enterica were normalized by subtraction of the change in intensity measured in the negative control. It should be noted that the fluorescence emission produced by the CFP expressed by the E. coli was less intense than that of the YFP expressed by the S. enterica, contributing to the intensity differences observed in the images between for E. coli and S. enterica (SI figure 2).
3.2. Relating colony fluorescence intensity to cell number
To verify that colony florescence intensity is directly related to colony biomass, a separate experiment was performed to generate CFU counts from the printed partners. After printing and incubation, three of the twenty printed colonies were randomly selected from each surface and imaged using fluorescence microscopy so that average colony intensity could be recorded. CFU counts were then performed after the printed colonies were reclaimed from the surfaces via thorough washing. When each sample was plotted as average intensity against the cell number recorded during the CFU count, a general trend of increasing intensity resulting in increasing cell density was observed (figure 1). These results demonstrated that that the intensity readings accurately accounted for cell density with no major inconsistencies due to printed colony morphology, and that this is a reasonable proxy for biomass.

Figure 1. Plots of average colony fluorescence intensity recorded 12 to 36 h after printing and the number of cells per printed colony calculated after performing CFU counts on each sample. Each point represents the average intensity of 3 random colonies from the 20 colonies patterned on each sample. Error bars represent standard deviation.
Download figure:
Standard image High-resolution image3.3. Prediction and experimental validation of distance dependency
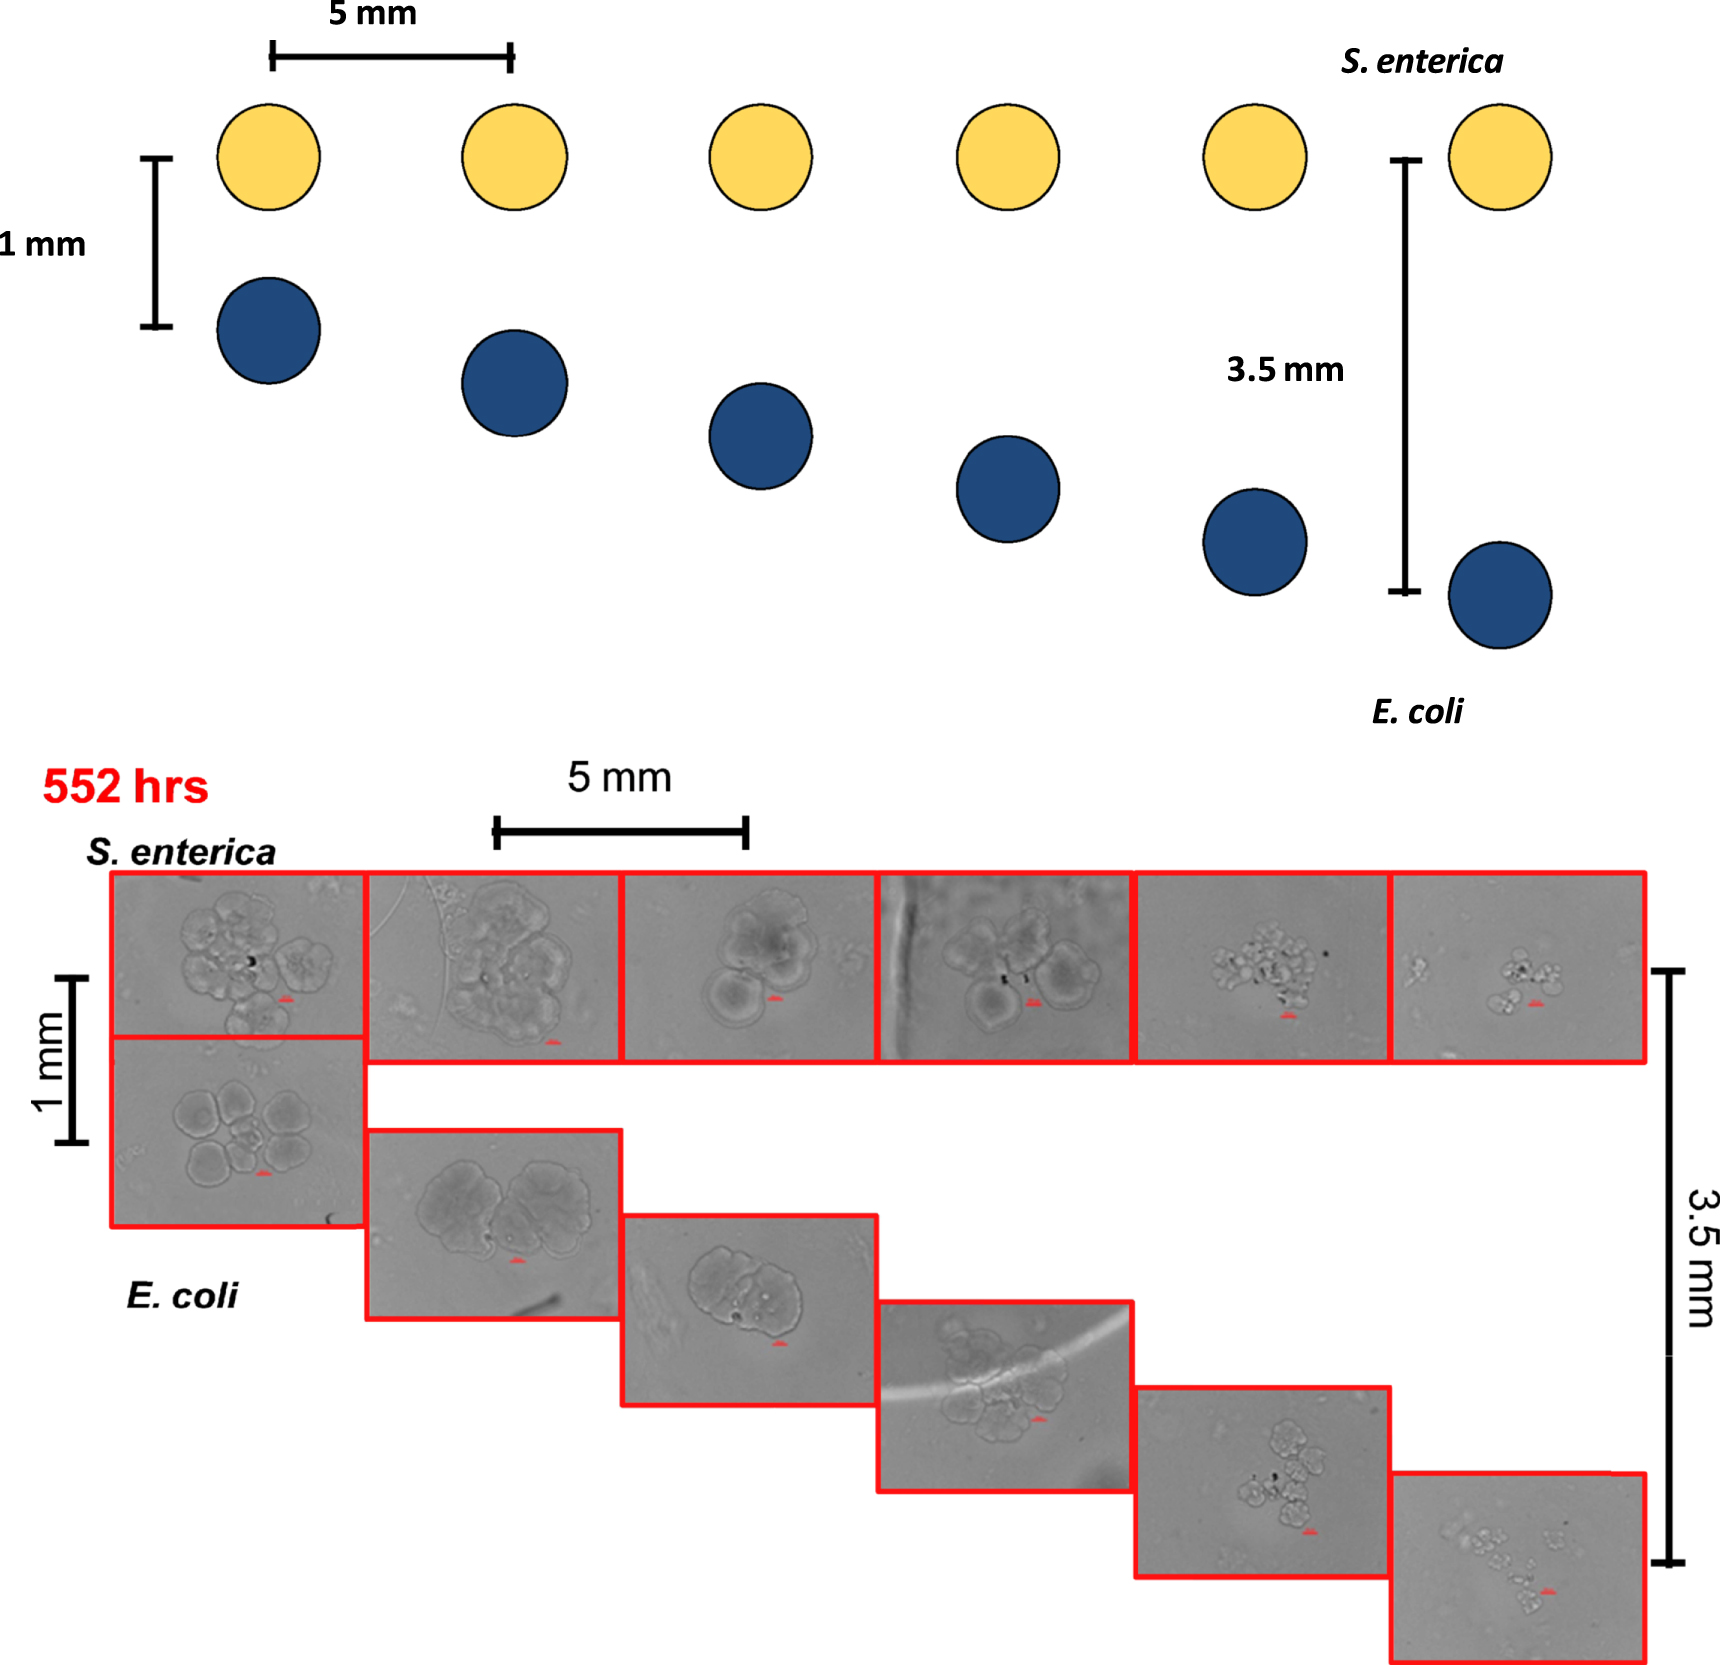
The COMETS model was first used to predict the distance dependent growth rates of the consortium partners, E. coli and S. enterica. The 'V-formation' printing geometry used to test the distance dependence of the cross-feeding interaction is illustrated in (figure 2). Briefly, S. enterica micro-colonies were patterned in a straight line with a spacing of 5 mm (center-to-center), while the E. coli were patterned at an angle which resulted in an increasing separation distance of 500 μm between each of the S. enterica and E. coli micro-colony pairings, with the distance of separation ranging from 1 mm to 3.5 mm (center-to-center). The 5 mm spacing between the patterned micro-colony pairs was chosen to limit diffusion from transporting metabolites between the individual pairings. The model suggested that the cross-feeding interaction possesses a strong distance-dependency, with growth decreasing as separation increases (figure 3(A)).
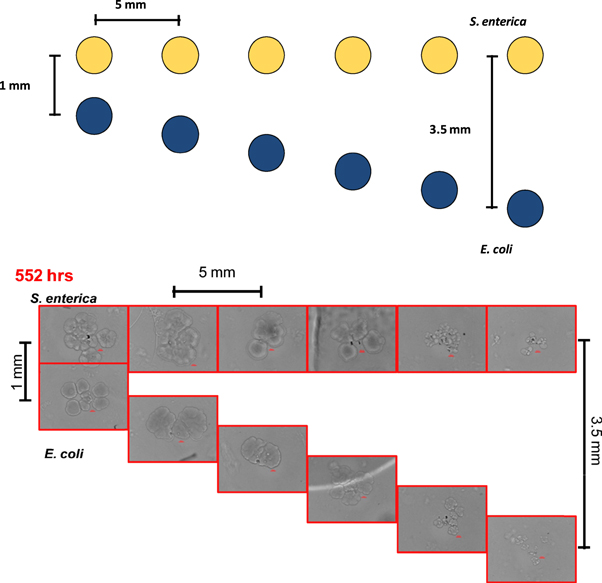
Figure 2. Illustration of the V-formation printing geometry used to test COMETS predictions of distance-dependent cross-feeding (above). Brightfield micrographs showing initial tests of cross-feeding after 552 h of growth as separation distance is increased (below). Colonies are separated by distances ranging from 1 mm to 3.5 mm, center-to-center.
Download figure:
Standard image High-resolution image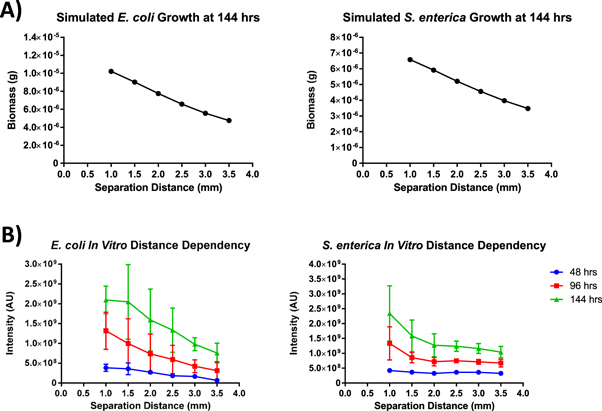
Figure 3. (A) COMETS predictions of biomass accumulation for each species over the course of 144 h based on colony proximity. (B) Fluorescence intensity measurements gathered from the consortium colonies patterned in the V-formation from 48 h to 144 h post-printing. Error bars represent standard deviation.
Download figure:
Standard image High-resolution imageTo validate the COMETS prediction of distance-dependence on the micro-scale, bioprinting was used to pattern the consortium partners at increasing distances in a tightly controlled microenvironment. Fluorescence micrographs gathered after 144 h of growth were analyzed to quantify micro-colony fluorescence in arbitrary units. Measurements of total intensity were taken from the patterned colonies to compare changes in colony intensity to the changes in biomass simulated by COMETS (figure 3(B)). Each colony was measured relative to the colony separated by the shortest distance, 1 mm between cross-feeding partners. Relative growth was then compared for each in vitro colony and its in silico counterpart (figure 4). Similar to previous results found on the macro-scale [21]; both simulation and experiment agree qualitatively with the intuitive result that the growth of the consortium partners exhibited a strong dependency upon the cross-feeding distance, with most predictions falling within the experimental data's standard deviation.
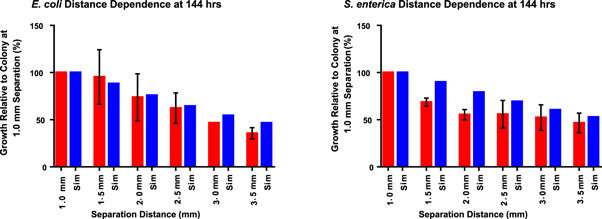
Figure 4. Comparison of in silico (blue) and in vitro (red) distance dependence growth ratios at 144 h for both cross-feeding partners. Growth percentages are relative to the colonies separated by 1 mm distance. Error bars represent standard deviation.
Download figure:
Standard image High-resolution image3.4. Prediction and experimental validation of eclipse dilemma scenarios
Due to the pervasiveness of complex mutualistic interactions between multiple species in natural ecosystems, we have selected geometries which place either an interspecific competitor or a conspecific competitor inside and outside the path of nutrient exchange between the obligate syntrophic strains. Similar scenarios were previously investigated on the macro-scale, with the resulting growth of one of the partners accurately predicted by COMETS simulations [21]. In the current work, bioprinting was used to determine if COMETS could correctly predict the experimental outcomes of these complex competition scenarios as the scale is shifted closer to the cellular level. Consortium partners were patterned in each scenario with a 2 mm (center-to-center) separation distance between them, while competitors were printed either directly between the partners or 1 mm from the E. coli colony, outside the metabolite path.
Competitor colonies consisted of either WT S. enterica as an interspecific competitor or additional consortium S. enterica which functioned as a conspecific competitor. The additional S. enterica colonies are referred to as conspecific competitors as they participate in methionine exchange with E. coli but will compete for the diffusible carbon-source. The WT S. enterica will compete for both diffusible metabolites while contributing nothing in exchange to the consortium partners. An illustrated layout and representative micrographs of the micro-scale printed samples are shown in (figure 5). This scenario has been termed the 'eclipse dilemma', as the intervening colonies interfere with the direct exchange of nutrients between the consortium partners by either utilizing one or both metabolites, yet may also aid growth of the other species [21]. Given the potential for both positive and negative effects upon the focal colonies, it was unclear which effect will be greater for each partner.
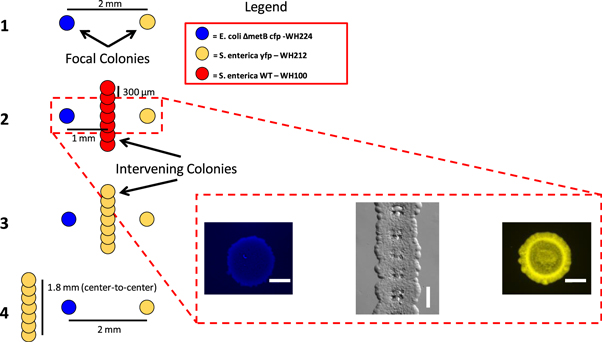
Figure 5. Illustration of the 'eclipse-dilemma' colony geometry (left). Each scenario was patterned on a separate surface with a fixed 2 mm separation between the focal consortium colonies. Representative micrographs of printed samples taken at 240 h from Scenario 2, showing E. coli WH224, the wall of WT S.enterica WH100, and S. enterica WH212 from left to right (right). Scale bars = 300 μm.
Download figure:
Standard image High-resolution imageInitial trials examining the eclipse dilemma employed smaller, single deposition intervening colonies. However, after fluorescence analysis was performed it became evident that the single colonies were not sufficient to appreciably interfere with cross-feeding between the focal colonies over the course of the experiment, resulting in only minor differences in average fluorescence between the scenarios (data not shown). This was likely due to a scale-effect, where metabolite diffusion was sufficient to drive them back into the eclipse area, decreasing the effect of shadowing over the time-course of the experiment. To enhance the shadowing effect the single colonies were replaced with a line of seven overlapping colonies, resulting in a contiguous line morphology. This represents a deviation from the macro-scale experiments where single intervening colonies were sufficient to interfere with cross-feeding.
COMETS was tasked with predicting the outcomes of these micro-scale, geometrically defined culture scenarios (figure 6(A)). The scenario 2 geometry was expected to result in decreased growth rates for both consortium partners as the S. enterica WT was predicted to strain cross-feeding relative to scenario 1 by utilizing both metabolites without reciprocation. In scenarios 3 and 4 the intervening colony was composed of conspecific competitors, which COMETS predicted would enhance the E. coli growth rate, while the distal S. enterica colony would suffer decreased growth very similar to scenario 2 despite the prediction of greatly enhanced E. coli growth. Bioprinting was performed to challenge these predictions and resulting growth of patterned colonies was observed for 240 h, with data gathered at 48 h time intervals to measure intensity changes as biomass increased (figure 6(B)). The scenario 1 geometry was included as a control under which no metabolite competition would transpire.
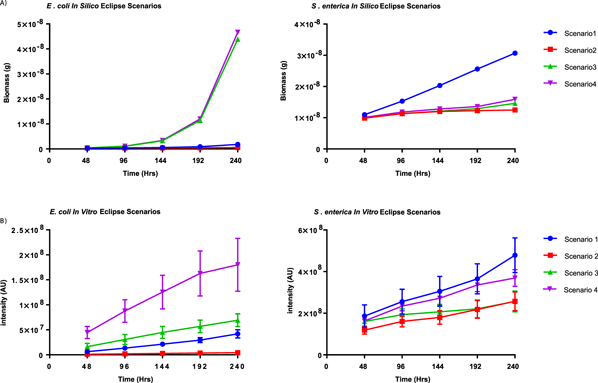
Figure 6. (A) COMETS model predictions of biomass accumulation over 240 h under the eclipse scenario for both consortium partners. (B) Measure of total fluorescence intensity for the consortium colonies over 240 h under the eclipse scenario. Error bars represent standard deviation.
Download figure:
Standard image High-resolution imageFor the eclipse dilemma trials each focal colony was evaluated relative to the growth of the colony of the corresponding species in scenario 1. Additionally, intensity profiles were taken across the consortium colonies to determine how the shadowing affected biomass accumulation from one side of the colony as compared to the other, summarized in (SI figure 3). To standardize the slopes across the top of the colonies, the highest intensity peaks were selected from the left and right side of the colonies and those values were divided by the left side peak. These results were unable to be compared to COMETS predictions due to a lack of simulation results with this level of granularity and resolution. COMETS was able to accurately predict the overall order of growth ratios as they occurred upon the patterned surfaces as well as the overall magnitude of growth for S.enterica, but much less accurately accounted for E. coli's magnitude of growth (figure 7). While the general trends of the in silico and in vitro growth ratios are similar, the overall ratios themselves do not agree as well as with previous the distance-dependence data in the case of E. coli.
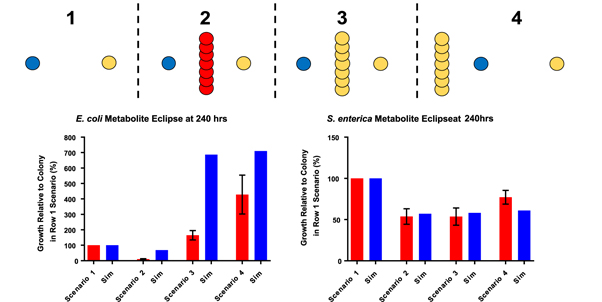
Figure 7. Comparison of in silico and in vitro eclipse dilemma data at 240 h relative to the growth of the focal colony of the corresponding species in scenario 1. Red bars and blue bars denote in vitro and in silico scenarios, respectively.
Download figure:
Standard image High-resolution image4. Discussion
Here we integrate two cutting edge tools to investigate how location mediates interactions between bacteria in spatially structured environments. Specifically, we used a novel micro-scale printing method to test computational predictions about how the location of colonies influences the growth of cross-feeding bacteria. We found that spatially explicit genome-scale metabolic modeling accurately predicted micro-scale growth patterns, but deviated quantitatively in several scenarios. Interestingly the effect of a competitor was dramatically smaller at the microscale than at the macroscale. Additionally, experiments and simulations highlighted that competitors can dramatically alter the diffusion of cross-feeding metabolites even when the competitor is not directly in the path of diffusion. The work demonstrates how sensitive microbial systems are to the placement of cells, and the importance of testing computational models across different spatial scales.
After micropatterning of cells, resulting colony growth was monitored and quantified to provide necessary data to compare to the COMETS model predictions of distance-dependence on the diffusion driven metabolite-sharing events between the syntrophic strains. Preliminary cross-feeding experiments revealed strong distance dependence between the printed micro-colonies of the consortium when the partners were patterned at increasing spatial separations (from 1 mm to 3. 5 mm). This suggested that cross-feeding becomes less effective as length of the diffusion path is increased. These intuitive results were readily reflected in COMETS' predictions of syntrophic interaction across increasing spatial separations on the micro-scale when using parameters that were similar the experimental conditions. The COMETS model was able to accurately predict the general trends of colony growth based solely on the distance between cross-feeding populations, with colony growth decreasing as separation distance between partners is increased. It should be noted however, as distance increased the experimental S. enterica growth trend decreased slightly more rapidly than the trend predicted by simulations. This demonstrates the initial steps of recapitulating a micro-scale, non-homogenous, spatially-dependent bacterial population behavior in a laboratory environment with a predictive growth model.
COMETS was used to generate predictions on cross-feeding dynamics in the face of competition. These predictions were challenged in the laboratory by micropatterning competitor strains in the path of nutrient exchange between the consortium partners to evaluate the effects of competition on the resulting fluorescence intensity of the consortium colonies. The simulations produced by COMETS on both the macro- and micro-scales predicted that competitors would strain cross-feeding, causing the growth of both partners to decrease relative to the competitor-free scenario (scenario 1). Both macroscale plating [21] and micro-scale bioprinting experiments revealed that this hypothesis is supported as consortium partners in this scenario (scenario 2) exhibited the least growth among the scenarios tested. S. enterica's growth was seen to match well with modeling predictions, however E. coli's growth was observed to be lower than what was predicted by COMETS.
Simulations predicted that even if a competitor is contributing to the mutualism, this can still decrease growth of focal colonies. Specifically, simulations predicted that a wall of mutualistic S. enterica placed between the focal colonies would decrease the growth of the focal S. enterica colony even though it increased the growth of E. coli. In scenario 3 it was predicted that the wall of conspecific competitors would inhibit the focal S. enterica growth to approximately the same degree as the wall of full competitor, S. enterica WT, did in scenario 2. This result was readily reflected by the micro-scale in vitro experiments. The wall of cooperative S. enterica was predicted to increase E. coli growth 687% relative to scenario 1, but in vitro E. coli colony in scenario 3 only increased 165% relative to scenario 1. Some of this discrepancy is likely the result of the timing of growth. In simulations, which do not include lag time, E. coli were able to reach exponential growth by 192 h in scenarios 3 and 4, while in in vitro biomass had not yet reached this exponential increase.
Under scenario 4, COMETS predicted that if the additional methionine-producing colonies were placed outside the path of nutrient exchange the focal E. coli colony would once again experience an increased biomass relative to E. coli in the scenario 1 control. However, COMETS predicted that this would increase the E. coli biomass by 711% relative to the E. coli focal colony in scenario 1. The in vitro growth of E. coli in scenario 4 was measured to be 429%, suggesting that COMETS was consistently over-predicting the magnitude of E. coli growth in each of these experimental scenarios. Predictions on S. enterica relative growth in scenario 4 were more accurate, as they were in all scenarios, with COMETS predicting a relative growth slightly higher than scenarios 2 and 3, but still lower than scenario 1.
Interestingly, COMETS predicted that the focal S. enterica colony in the scenario 4 would grow more slowly than it would in the control scenario, despite the increased biomass of the E. coli colony, due to a 'diffusion sink' created by the line of conspecific competitor colonies. The rapid utilization of acetate by the line of S. enterica colonies was predicted to create a depletion zone which would slow diffusion of acetate in the region between the E. coli colony and the focal S. enterica colony as some metabolites would back-flow from this zone of higher concentration back toward the depletion zone.
Overall, the relative growth of the colonies within each scenario observed during the 'eclipse dilemma' printing experiments agreed with the general trends predicted by COMETS. However, the magnitude of relative growth observed in vitro, particularly in the case of E. coli, was not readily reflected within the simulations. This suggests that on the micro-scale COMETS' predictions become less accurate as the experimental scenarios become more complex with respect to the relatively simple micro-scale distance dependence experiment. These results emphasize the need for rapid and reproducible bacterial cultures, defined by geometry, which can be facilitated by bioprinting. Intensity profiles gathered from each sample under the eclipse dilemma scenarios further demonstrates the utility of a bioprinting approach. The ability to image the entire bacterial colony not only enables the observation of the growth across the colony, but could readily permit the entire colony's growth to be quantified and mapped into discrete sections with a resolution constrained only by the imaging software. This level of resolution will be required as predictive models continue to achieve greater granularity.
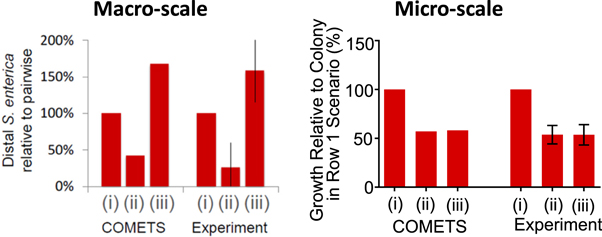
When the outcomes of the macro-scale eclipse scenario trials are compared to those of the micro-scale experiments, the importance of scale becomes apparent when predicting the behavior of microbial interactions. When similar scenarios were patterned using a macro-scale plating technique, apart from scenario 4, which was examined here for the first time, COMETS was able to predict the trends and magnitudes of the biomass ratios for S. enterica with high accuracy [21]. When scenarios 2 and 3 were investigated on the micro-scale, COMETS was able to correctly predict the trends and magnitudes of the biomass ratios for S. enterica in those same scenarios, despite overall different outcomes depending on scale for scenario 3 (figure 8). The focal S. enterica colony's decreased growth in scenario 3 relative to the macro-scale experiments is unlikely to be simply an effect of substituting a single intervening colony for a 'wall' of seven intervening colonies. If this effect were due solely to the presence of a 7-fold larger wall colony, an appreciable increase in growth between the biomass of S. enterica in scenario 3 relative to scenario 2 should still be observed due to increased amount of acetate production coming from the approximately 16-fold larger E. coli colony in scenario 3.
Figure 8. Comparison of the eclipse dilemma scenarios on the macro-scale (Left), reproduced with permission from [21]) and the micro-scale (Right). Both macro and micro COMETS simulations were generated with similar environmental parameters. Error bars represent standard deviation.
Download figure:
Standard image High-resolution image
This outcome highlights how the examination of similar interactions on different spatial scales is necessary, as they may not produce similar results. In addition, this highlights the ability of COMETS to predict such non-intuitive outcomes. Comparison of the macro- and micro-scale results demonstrates the requirement of investigating microbial interactions on multiple scales to investigate these possible scale effects. This also demonstrates the utility of this micro-patterning technique, where complex culture geometries can be generated and reproduced very quickly, and cellular growth can be easily quantified, for examining microbial behaviors with spatiotemporal dependencies.
5. Conclusions
The microarrayer-based bioprinting approach used in this study permitted the fabrication of micro-patterned, multi-species micro-cultures. Using this technique, we could control parameters, such as colony population density, environmental dimensions and spatial distribution of cells and nutrients. These parameters are readily input into software-based modeling tools, such as the COMETS platform used in this study. This can also work in reverse, with COMETS modeling parameters used to design a laboratory experiment to test the predictions of a de novo simulation.
Our micro-scale printing method enables the observation of complex intercellular interactions on the micro-scale with defined spatial characteristics. This process is amenable to the study of any microbial interaction or process which is dependent upon the exchange of soluble signals, nutrients, toxins, etc while allowing individual colony responses to be monitored and even reclaimed from the substrate for reculture. We envision this technique and other existing bioprinting methods to assist in a wide variety of complex microbial studies. Examples of these studies include within-microbiome metabolic interactions, biofilm formation, and inter- and intraspecies signaling phenomena such as quorum sensing. By providing the means to pattern both cells and bioactive molecules, bioprinting facilitates the rapid and reproducible construction of geometrically deliberate multi-species cultures, as well as the specific placement of bioactive molecules. Using our microarrayer-based approach, we have investigated the dynamics of mutualistic microbial cross-feeding and evaluated the effects of competition on nutrient exchange on the micro-scale.
We have also shown that the results of the cross-feeding interactions within this consortium are appreciably different than those found on the macro-scale. This suggests that any microbial interaction which relies upon spatiotemporal dynamics requires evaluation on multiple scales as the resulting effects can differ drastically when scale is altered. We have also demonstrated the utility of the COMETS platform and its ability to predict the general trend of many of these outcomes based on their spatial organization and scale. This bioprinting approach could be used to challenge any model, such as COMETS, which strives to predict bacterial behavior or interactions with spatiotemporal dependencies. When used in combination with COMETS, this approach demonstrates the benefits of using a computational model in conjunction with the means of readily recapitulating the model's parameters on the micro-scale in order to confirm or refute the in silico predictions in vitro.
Acknowledgments
This study was supported by a US Department of Energy award to CJM (DE-DC0006731).