
Abstract
This paper reports the fabrication of an electric double-layer supercapacitor that incorporates carbon nanotube electrodes with an ionogel electrolyte based on the sol–gel encapsulation of the ionic liquid, 1-butyl-3-methylimidazolium tetrafluoroborate. The quasi-solid nature of the ionogel electrolyte enables this supercapacitor to become a solid-state device, which overcomes the limitations of many high-performance supercapacitors, whose liquid-based electrolyte prohibits the realization of truly compact energy storage that is practical for various existing and emerging portable electronics. The device reported here combines the intrinsic high power of an electrochemical double-layer capacitor with the increased energy density associated with the wide voltage window of the ionogel. The device was characterized by a suite of electrochemistry techniques and demonstrated both high power and high energy density.
Export citation and abstract BibTeX RIS
1. Introduction
Energy storage is now becoming a design limitation for mobile electronics, especially for those with high power consumption. Batteries have been the energy storage medium of choice for portable electronics because of their large energy densities and moderate power performance [1]. As mobile electronic devices become smaller, the size of the accompanying power source must be scaled accordingly. Thus, the need for durable, efficient and inexpensive energy storage approaches is becoming a necessity [2]. As an alternative to batteries, electrochemical capacitors have shown promise in enabling high power energy storage using a variety of systems including metal oxides [3], carbon nanotubes [4], onion-like carbon [5] and graphene [6].
Electrochemical capacitors, also referred to as supercapacitors, share the same general device configuration as batteries, namely two electrodes immersed in an electrolyte. However, the similarity ends there as the devices differ in their energy storage mechanisms. Batteries store energy by electrochemical reactions that occur primarily in the bulk of their electrodes. In contrast, electrochemical double-layer capacitors (EDLCs), a subset of electrochemical capacitors, store charge at the interface between the surface of their electrodes and the electrolyte, in what is known as the electrochemical double layer [7]. In a symmetric device, the double layer occurs at both electrode/electrolyte interfaces, which results in two series capacitors each with nanometer level thickness [8]. Since capacitance is a surface process, EDLCs respond more rapidly than conventional batteries, leading to higher power operation.
EDLC penetration into commercial markets has been limited by the disparity in volumetric energy storage between state-of-the-art thin-film batteries and EDLCs. With improved energy densities, EDLCs could be a replacement for thin-film batteries because of their intrinsic high power, long cycle life and their potential to be fabricated with micron dimensions [9]. This paper presents our work on materials integration for a prototype solid-state EDLC with the highest reported voltage window [10] and areal energy density for a quasi-solid electrolyte.
1.1. Materials choice for electrodes
Capacitors store energy proportional to voltage squared, as indicated in equation (1)

Thus, a combination of a wide voltage window and high specific capacitance is necessary to raise the energy density of EDLCs. Chemically stable electrodes and electrolytes are necessary to achieve large voltage windows. The power of a capacitor is displayed in equation (2) [11]. To improve the power, the resistance of the entire system needs to be minimized, while maintaining a high operating voltage,
The ideal electrode material for a high energy and high power device has high electrical conductivity and high specific capacitance. Specific capacitance is large for light materials with high surface areas such as carbons. Commercial supercapacitors often use activated carbon because it is abundant, electrically conductive and has a specific capacitance of 100–160 F g−1. Carbon aerogels have similar specific capacitances, 70–150 F g−1 [12], to carbon black, but the open structure of aerogels results in low volumetric energy density [13]. The more conductive allotropes of carbon, carbon nanotubes (68–160 F g−1 [4]) and graphene (135 F g−1 [14]) have similar specific capacitances. In the current study, carbon nanotubes (CNTs) were chosen for their compatibility with electrophoretic deposition (EPD), a binderless deposition process [15].
1.2. Electrode deposition
Previous studies have demonstrated various methods for fabricating micro-supercapacitors, including micro contact printing [16], laser scribing [6], and EPD [5]. EPD is of interest because it can be used to selectively deposit CNTs or activated carbon [17, 18] onto charged conducting surfaces without rastering or using binders. Binderless depositions are ideal for improving both energy and power densities since binders are inactive for energy storage and they disrupt electrical contact in the electrode. An EPD apparatus consists of two electrodes in a stable suspension, where the active material deposits electrostatically onto the electrode surface when a voltage is applied. EPD has been thoroughly reviewed in the literature, and one of the most important requirements for a high-quality film is depositing from a stable suspension [19]. CNT suspensions can be stabilized by the presence of charged functional groups, such as carboxyls, as utilized in the present study. EPD fabrication can also be scaled to industrial dimensions and throughputs [20], and there are reports of good performance from EDLCs prepared with functionalized CNT deposited by EPD [21].
1.3. The materials choice of the electrolyte
Defect-free single-walled CNT can have a voltage window of 4 V [4], but the choice of electrolyte has a tradeoff between ionic conductivity and voltage window. Higher ionic conductivity will minimize the resistance in equation (2) to increase the power of the EDLC. Aqueous electrolytes, such as sulfuric acid, are commonly used for their high conductivity (730 mS cm−1) [22], but even with platinum electrodes, their voltage and therefore energy is limited by electrolysis of water at 1.2 V [11]. Organic electrolytes, such as propylene carbonate (PC) with tetraethylammonium tetrafluoroborate, have a wider voltage window of 4.5 V but a lower conductivity 60 mS cm−1 [23, 24]. Organic electrolytes can yield large energy densities when used with CNT, but they are highly flammable, evaporate easily and are often toxic [4, 25].
Room-temperature ionic liquids offer an improvement over organic electrolytes by virtue of their larger voltage windows, negligible flammability and lower vapor pressure. The one drawback to using ionic liquids is that they have lower ionic conductivity. Ionic liquids are solvent-free molten salts that exhibit moderate ionic conductivities 0.1–10 mS cm−1, wide voltage windows 2–5 V and high-temperature stability from below room temperature to 200–400 °C, depending on their chemistry [24]. This thermal stability combined with ionic liquid's very low vapor pressure make them appealing electrolytes for micro-supercapacitors integrated into circuits that produce excess heat. Ionic liquids have been successfully incorporated into EDLCs to increase the energy density to levels comparable with commercial battery systems [6, 26]. They have the additional advantage of being non-flammable, which makes them safer in the event of an electrical short [27].
The ionic liquid 1-butyl-3-methylimidazolium (BMIM) tetrafluoroborate (BF4) was selected for the experiments because it has a voltage window of 4.2 V, which will offer a good energy density, and an ionic conductivity of 1.2 mS cm−1 to give moderate power performance [24]. The energy density of EDLCs with CNT electrodes and ionic liquid electrolytes can be improved by eliminating the packaging necessary when using liquid electrolytes. For electrochemical capacitors, about 30% of the weight is active material, while the rest is a combination of current collectors, electrolyte, binder, separator and packaging [28]. To prevent electrolyte seepage and reduce the packaging necessary for these EDLCs, the electrolyte can be gelled or encapsulated. The two methods have different synthesis routes, mechanisms and limitations.
1.4. Fabricating a quasi-solid electrolyte
Gel electrolytes are formed by increasing the viscosity of an electrolyte until it no longer flows. Two approaches to increase the viscosity of the electrolyte are the addition of long-chained polymers or nanoparticles [29]. Compared with the neat electrolyte, the conductivity of gel electrolytes is greatly reduced since conductivity is inversely related to viscosity [30]. EDLCs have been successfully made with CNT electrodes and ionic liquids gelled with polyvinylidene fluoride (PVDF) [30, 31], but these EDLCs have reduced thermal stability since viscosity decreases with increasing temperature. For this particular system, the ionic conductivity was 2 mS cm−1, corresponding to 55% of the conductivity of neat 1-ethyl-3-methylimidazolium (EMIM) tris(pentafluoroethyl)trifluorophosphate (FAP) ionic liquid. The voltage window was also reduced by 50% compared to the neat electrolyte to ~2 V [32], which suggests the presence of water [33]. Moisture increases the conductivity of the ionic liquid and reduces the voltage window, which could explain the observed results [34].
The second method of gelation is the addition of nanometer-sized powders, such as fumed silica, to ionic liquids. In two recent papers, fumed silica was added to ionic liquid to make an all-solid-state flexible EDLC using CNT [35] or graphene [36]. Even though the neat ionic liquids were very similar, EMIM bis(trifluoromethylsulfonyl)imide (TFSI) and BMIM TFSI respectively, both groups reported a reduction in voltage window of the gel from ~4 V for the neat liquid to ~3 V and 2.5 V, respectively. Even though these gels have reduced voltage compared to the neat electrolytes, they are still an improvement over the nominally 1 V operation for aqueous electrolytes made by gelation of sulfuric acid [37].
An alternative approach to gelation is the use of sol–gel chemistry to encapsulate an ionic liquid. In this method, silica precursors are first hydrolyzed by acid and then mixed with ionic liquid before the silica condenses into an interconnected mesoporous matrix. The mesopores of the silica encapsulate the ionic liquid, preventing seepage without reducing the viscosity of the ionic liquid. A non-aqueous sol–gel route [38] can be used to minimize the water content of the encapsulated ionic liquids, and the resulting ionogels can be made with a variety of ionic liquids [39].
1.5. Our objective
The overall objective of the research is to develop a quasi-solid EDLC that can utilize the full voltage window of the ionic liquid in combination with the large specific capacitance of the deposited CNT electrodes. We synthesized CNT electrodes using EPD and fabricated a prototype device that incorporated a BMIM BF4 ionogel as the electrolyte. The resulting device demonstrated both high energy and power densities.
2. Methods
2.1. Electrophoretic deposition of carbon nanotube electrodes
Multiwalled CNTs (30–70 concentric tubes, 0.5–200 μm in length) were purchased from Sigma Aldrich and functionalized by heating in 12.6 M nitric acid at 60 °C for 72 h, and subsequently dispersed in common protic solvents, including water and ethanol.
The EPD apparatus consists of two parallel 304 stainless steel (SS) current collectors (McMaster Carr). A 2 × 1 cm2 electrode had 1 cm2 immersed in a suspension of 1 mg CNT in 15 mL of deionized water. The electrodes were 1 cm apart with an applied voltage of 14.5 VDC with 3 VAC at 0.3 MHz for 20 min. The use of ac voltage was based on reports of using dielectrophoresis of CNT to straighten them while the dc voltage deposits them [40, 41]. This modified ac EPD has been shown to suppress bubble formation [42]. The deposition electrode assembly was designed such that the electrodes could be removed from the solution before turning off the deposition voltage to minimize the loss of CNT. A post-deposition heat treatment was performed at 200 °C under 5% hydrogen, 95% nitrogen atmosphere for 2 h to remove the adsorbed oxygen created by electrolysis during CNT deposition [21]. The heat treatment was performed in a tube furnace (Applied Test Systems 3210) controlled by an Omega CN8240 controller. The surface roughness and thickness of the CNT electrode deposits were assessed qualitatively using scanning electron microscopy (Nova 230 SEM). The mass of CNTs deposited by EPD was measured by a microbalance.
2.2. Electrochemical characterization of carbon nanotube electrodes
Electrochemical characterization studies of the charge stored by the CNT electrodes were performed following procedures from the literature [43]. After heat treatment in reducing atmosphere, the electrodes were heated at 100 °C under vacuum to remove adsorbed moisture prior to being transferred into an argon-filled glovebox. Three-electrode cyclic voltammetry tests (VMP3 from Biologic) were performed on the CNT electrodes in a three-neck glass cell. Platinum foil served as the counter and pseudo reference electrode. The experiments used a sweep rate of 100 mV s−1 with increasing voltage windows from 3 V to 3.7 V, as shown in figure 1. The electrolyte, BMIM BF4 (from BASF), was used as-received.
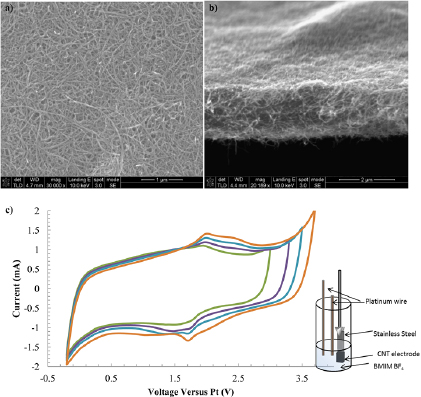
Figure 1. SEM image of CNT electrodes. (a) Plane view, and (b) a cross-section view showing the electrode thickness to be 3 µm. (c) Three-electrode cyclic voltammetry experiments for a CNT electrode deposited by EPD (after hydrogen treatment). The counter electrode was Pt foil, and the reference was a Pt wire. The sweep rate shown is 100 mV s−1 with increasing voltage windows of 3, 3.3, 3.5 to 3.7 V.
Download figure:
Standard image High-resolution image2.3. Fourier transform infrared spectroscopy of carbon nanotubes
Fourier transform infrared spectroscopy (FTIR) was used to determine the chemical functional groups on the carbon nanotubes. FTIR pellets were prepared by milling 150 μg of carbon nanotubes in 80 mg of potassium bromide. The powders were heated for 8 h at 100 °C at 0.1 torr to remove volatile impurities. After pressing, the pellets were stored in a vacuum desiccator to minimize air exposure. FTIR spectra were obtained in ambient conditions using a Jasco FTIR 6100 with 4 cm−1 resolution and averaged over 64 scans. The data shown in figure 2 were processed using Jasco spectrum analysis with the automatic baseline function and 11-point adaptive smoothing.
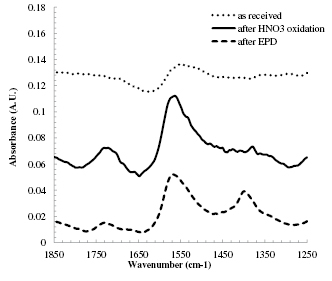
Figure 2. FTIR spectra for the CNTs at different stages of the electrode preparation. The peaks at 1720, 1560 and 1390 cm−1 correspond to C=O stretching, C=C stretching and CO–H bending, respectively.
Download figure:
Standard image High-resolution image2.4. Synthesis of ionogel electrolyte
The ionogel electrolyte was formed by a non-aqueous sol–gel route using formic acid (FA) and two silanes, vinyltriethoxysilane (VTEOS), tetramethylorthosilicate (TMOS), following our previously published procedure [44]. The sol for the ionogel was made by magnetic stirring of 2:2:5 volume ratios of VTEOS:TMOS:FA in a borosilicate glass vial at a hydrolysis temperature of 39 °C maintained by a silicon oil bath in a fume hood. After 19 min of hydrolysis, the sol was pipetted into a polyethylene vial (McMaster-Carr) at room temperature. BMIM BF4, stored under argon to minimize water absorption, was added to the sol so that 72% of the total precursor volume was ionic liquid. This value differs from our previous work, which used 42% ionic liquid. The benefit of increased ionic liquid content is improved ionic conductivity. Electrochemical methods used to characterize the ionogel were reported previously [44].
2.5. Fabrication of carbon nanotube/ionogel capacitors
EDLCs with parallel plate geometry were made by combining the CNT electrodes with the ionogel. EPD was used to deposit 190 µg of CNTs evenly onto the 1 cm2 SS electrodes. 120 um Teflon shims were used around the edges of the electrode to set the thickness of the ionogel layer, as shown schematically in figure 3. Devices were formed by drop casting 20 µL of ionogel onto the bottom CNT electrode after 19 min of hydrolysis. 20 µL is an excess of ionogel to ensure that the volume between the electrodes is filled. The top electrode was placed CNT side inward to complete the device fabrication. The device was then dried in ambient conditions for 30 min prior to heat treatment and testing.

Figure 3. The cyclic voltammetry of the CNT/ionogel EDLC at 100 mV s−1 in a two-electrode configuration showing capacitive scans at 3, 3.25, 3.5 and 3.75 V.
Download figure:
Standard image High-resolution imageDevices were heated at 50 °C for 3 h, and then at 100 °C for two days to ensure full condensation of the ionogel and remove volatile reaction products, alcohols and water. Nickel wires were added with silver epoxy (Epotek H20E) to the two stainless steel current collectors. Devices were transferred hot into a polycarbonate measurement apparatus (NEMA 4 enclosure with added electrical and gas connections). Steps were taken to minimize the BMIM BF4 contact with moisture because it is known to be an HF former [45]. The air in the enclosure was exchanged by flowing argon during device testing to provide a dry environment.
2.6. Electrochemical characterization of carbon nanotube/ionogel capacitors
Electrochemical measurements included cyclic voltammetry and galvanostatic cycling. Two-electrode cyclic voltammetry was performed at a sweep rate of 100 mV s−1. The swept voltage window was varied from 2 to 3.75 V (figure 3). Galvanostatic cycling is the accepted measurement technique for device performance since it emulates the mode of operation for an energy storage device [46]. Ten galvanostatic cycles were performed at current densities between 0.5 to 20 mA cm−2, as shown in figures 4 and 5. The impedance of the supercapacitors was measured using a Solartron 1287 and 1252a potentiostat and function generator, respectively. Impedance measurements were performed with 13 mV ac amplitude, 0 V dc bias at 10 steps per decade of frequency in the range 10−2 to 105 Hz (figure 6). Leakage measurements were performed by applying a staircase voltage from 0 to 3.75 V at 5 min per step. The steady-state current after 5 min was reported as the leakage current for that voltage, and is shown in figure 7. Impedance hysteresis testing was performed with a 13 mV ac amplitude at 1 frequency step per decade in the range of 100 to 105 Hz, while cycling the dc bias voltage from −2.5 V to 2.5 V and back to −2.5 V at 1000 points per sweep. These results are shown in figure 8.
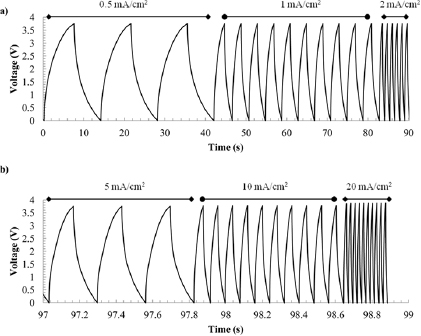
Figure 4. Galvanostatic cycling of a CNT/ionogel EDLC at (a) current densities of 0.5, 1 and 2 mA cm−2, (b) 5, 10 and 20 mA cm−2, showing slightly sharper curves at higher scan rates.
Download figure:
Standard image High-resolution image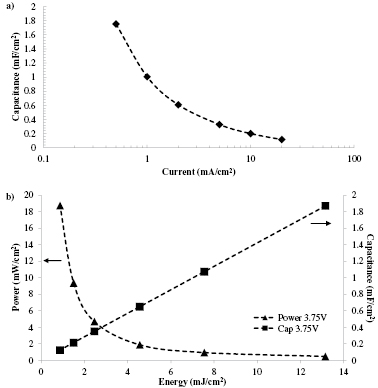
Figure 5. (a) Areal capacitance versus galvanostatic current density for the CNT/ionogel EDLC. (b) Areal power, energy and capacitance of the same device.
Download figure:
Standard image High-resolution image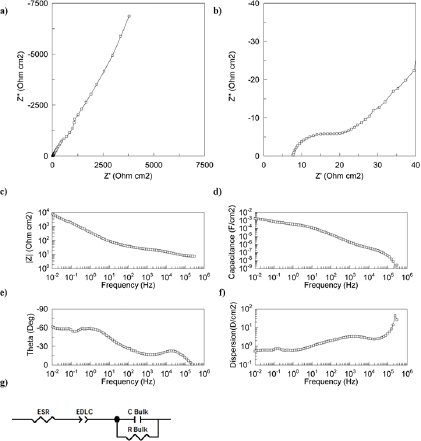
Figure 6. The impedance of the CNT/ionogel EDLC. (a) Nyquist plot; (b) a zoom of the low-resistance regime; (c) Bode plot; (d) parallel capacitance; (e) phase angle; (f) dispersion; and (g) the equivalent circuit used for the model, containing two resistors, a constant phase element and a capacitor.
Download figure:
Standard image High-resolution image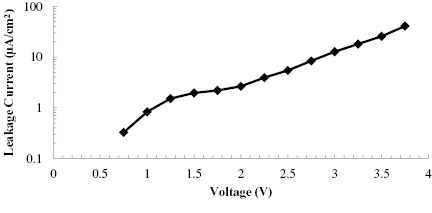
Figure 7. CNT/ionogel EDLC leakage current as a function of voltage showing a non-linear dependence.
Download figure:
Standard image High-resolution image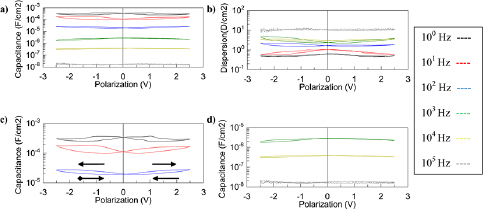
Figure 8. Polarization plots displaying (a) capacitance and (b) dispersion for the device. (c) Zoom of the capacitance at low frequency, 100–102 Hz, with arrows to indicate how the data was acquired, and (d) capacitance at high frequency, 103–105 Hz.
Download figure:
Standard image High-resolution image
3. Results
3.1. Carbon nanotube electrodes
The CNT electrodes used in this experiment were deposited into dense interwoven mats roughly 2 µm thick, as shown in figures 1(a) and (b). The cyclic voltammetry plot in figure 1(c) demonstrates that the deposited CNT electrode under argon has a wide electrochemical window of 3.8 V and resembles the ideal box shape response of a capacitor. The coulombic efficiency, the total charge from the discharge step divided by the total charge from the charging step, of the scans in figure 1 decreases with increasing voltage window, from 99% to ~ 98%. This voltage window is nearly the full value of 4 V for pristine CNTs [4], even though these CNTs were functionalized before EPD. The small oxidation and reduction peaks at 1.95 V and 1.7 V versus platinum, respectively, likely belong to oxygen-containing functional groups that are introduced during the oxidative treatment of CNT. These peaks have been reported previously [43]. The existence of these small peaks prompted further characterization by FTIR (figure 2).
FTIR was used to identify the chemical functional groups present on the CNT. It is well known that oxidizing agents such as nitric acid can produce a wide variety of oxygen-containing functional groups such as aldehyde, ether, ester, carbonyl, phenol, carboxylic acid and carboxylic anhydride, on CNT [47]. One simple way of classifying these groups is whether they contain single or double-bonded oxygen. The region of the FTIR spectrum from around 1250 to 1850 cm−1 is particularly useful because therein lie three peaks at 1720, 1560 and 1390 cm−1, which correspond to C=O stretching, C=C stretching and CO–H bending, respectively [48]. As shown in figure 2, the as-received CNTs have a relatively flat signal with a small peak associated with C=C. After oxidation in 12.6 M HNO3, the C=C peak increases in amplitude and a C=O peak appears as well as a CO–H peak. After EPD the CNTs exhibit a decrease in the C=O peak and an increase in the CO–H peak.
3.2. Carbon nanotube/ionogel capacitors
The electrochemical properties of fully assembled CNT/ionogel EDLCs were determined using cyclic voltammetry (two-electrode experiment). The results are shown in figure 3. The EDLC also displays a box-shaped curve, but the small redox peaks that were evident in the cyclic voltammetry scans of individual electrodes (figure 1) are no longer visible in figure 3. The scans show a steady coulombic efficiency of 88% up to 3.75 V, which is a very large window for an encapsulated electrolyte [9, 36].
Following the cyclic voltammetry scans, galvanostatic cycling was performed to study charge storage characteristics under more realistic device conditions. The current densities were chosen to give discharge times slower and faster than common commercial capacitors, which are discharged in a few seconds [46]. In figure 4, the galvanostatic cycling becomes more triangular with increasing scan rates, which is consistent with other reported CNT EDLCs [31]. This trend occurred for 0.5, 1 and 2 mA cm−2 current densities, figure 4(a), and for 5, 10 and 20 mA cm−2 current densities, figure 4(b). From the galvanostatic cycling, the effect of discharge rate on capacitance is shown in figure 5(a). The areal capacitance decreases with increasing current, likely from ohmic polarization, and demonstrates similar trends to other CNT EDLCs in the literature [49]. Figure 5(b) summarizes the results from the galvanostatic testing and shows the tradeoff between power and energy for the EDLC.
In addition to galvanostatic cycling of the CNT/ionogel EDLC, we also carried out electrochemical impedance spectroscopy, which gives an insight into the charge storage mechanisms (figures 6(a) and (e)), equivalent series resistance (ESR) (figure 6(b)) and hysteresis (figure 8). The Nyquist plots in figures 6(a) and (b) show a high-frequency intercept offset from the imaginary axis, followed by a semicircle and then a low-frequency capacitive tail [7]. The impedance was modeled using a modified Randle's circuit [50] appropriate for ionic liquid double-layer capacitance, and is shown in figure 6(g).
Leakage current is a common metric for assessing the quality of an EDLC. For this device, the leakage current increases non-linearly with voltage, as shown in figure 7. This leakage current distorts the semicircle in figure 6(b) and also contributes to the dispersion seen in figure 6(d). Dispersion, also known as dissipation factor, is the ratio of the real part of the impedance to the imaginary portion. For a supercapacitor, the dispersion should ideally be a small value, since large values are associated with higher resistance [51]. Leakage current is a common problem for supercapacitors, but there are few reports with which to compare. The rate of self discharge can be reduced by using higher purity materials [52]. More aggressive heat treatments or a more open device architecture could further remove impurities from the system to minimize the leakage current.
When considering the quality of the device, capacitance hysteresis is problematic because it gives uncertainty to the EDLC's capacitance. In the CNT/ionogel EDLC, hysteresis is evident at frequencies lower than the characteristic time constant ~103 Hz shown in figures 8(a)–(c). The hysteresis is at most a 30% difference from the capacitance measured at 0 V. For frequencies greater than 103 Hz, the hysteresis is negligible, as shown in figure 8(d). This behavior is consistent with a literature report on the hysteresis of EMIM TFSI EDLCs that used platinum electrodes. In that work, the hysteresis spans 20% of the capacitance at lowest bias voltage [50]. Since the work by Drüschler et al used bare platinum electrodes, the difference in hysteresis may be attributed to the difference between smooth platinum electrodes and rough CNT electrodes. It has been reported that hysteresis commonly occurs with ionic liquids due to counter ion adsorption and over screening as a result of the high ion concentration [53].
4. Discussion
4.1. Electrochemical impedance spectroscopy
Circuit models can be used as a tool to characterize the physical processes occurring in the CNT/ionogel EDLC. The physical processes include resistance from ion transport through the bulk ionogel, capacitance from the CNT and charge transfer associated with the CNT/electrolyte interface. These physical processes are assigned to the ESR, EDLC and R Bulk elements from figure 6(g), respectively.
The justification for our circuit model begins with our previous report of ionogel impedance, where a capacitive tail was observed and its intercept with the real axis corresponded to the ionic resistance through the ionogel [44]. A capacitive tail (vertical line) is the ideal Nyquist plot for a capacitor, and suggests that the charge storage is completely capacitive. For the CNT/ionogel EDLC, the circuit model yields an ESR 8 Ω which, considering the volume of the ionogel (1 cm2 footprint and 120 µm thickness), corresponds to an ionic conductivity of 1.4 mS cm−1, which is in good agreement with the conductivity of the neat electrolyte.
The impedance semicircle in figure 6(b) is a new feature that is only present with the CNT electrodes. The addition of a semicircle to the impedance is also seen for CNT electrodes with gelled EMIM tetracyanoborate, and has been attributed to charge transfer resistance [30]. The charge transfer resistance is 14 Ω, 64% of the total resistance of the system. The source of this resistance is unknown, but it could be associated with the gelation of sol–gel precursors occurring at the CNT/electrolyte interface.
Considering the dense CNT electrodes, there is an interesting effect of a capacitance (C Bulk) that appears at frequencies above 3 kHz with a magnitude of 10−6 F cm−2. This capacitance appears to be related to the dielectric capacitance from the ionic liquid in the CNT electrodes. Considering that BMIM BF4 has a dielectric constant of 12.2 [54], the CNT surface area is roughly 0.02 m2 [55] and the 2 microns of CNT electrode thickness yields a capacitance of 10−6 F.
The capacitance of the EDLC is modeled at 0.5 mF cm−2, which is in agreement with the capacitances shown in figure 5(a) from galvanostatic cycling. Using the ESR and the modeled capacitance of 0.5 mF, the characteristic RC time constant is 4 mS. This fast response time is promising and similar to that reported for micro-supercapacitors [16].
4.2. Energy storage properties
There are a variety of electrodes, electrolytes and architectures that have been reported for energy storage in supercapacitors. To better compare the results from this paper, a subset of the literature on symmetric supercapacitors, those with carbon-based electrodes, liquid-based electrolytes and active area electrode thicknesses less than 100 µm, were used for table 1. The maximum reported capacitances per device footprint area are reported in table 1 following an example from the literature [56]. Table 1, arranged by electrolyte, shows a broad range of capacitances with thicker electrodes tending to yield higher capacitances. There is also good performance from the systems with tetrabutylammonium tetrafluoroborate (TBAF) dissolved in PC.
Table 1. Comparison of supercapacitors with symmetric electrodes arranged by electrolyte and scaled by the energy storage footprint of their active material.
| Comparison of literature supercapacitors | |||||||
|---|---|---|---|---|---|---|---|
| Electrode material | Electrode configuration | Electrolyte | Voltage (V) | Capacitance (mF cm−2) | Electrode thickness (µm) | Areal energy (mJ cm−2) | Energy/thickness (mJ cm−2 µm) |
| AC [56] | Interdigitated (16) | NaNO3 Aqueous | 1 | 90.7 | 50 | 45.4 | 0.91 |
| AC [16] | Interdigitated (20) | TBAF PC | 2.5 | 2.1 | 2 | 6.6 | 3.3 |
| C onion [5] | Interdigitated (16) | TBAF PC | 3 | 0.9 | 7 | 4.1 | 0.59 |
| CNT [57] | Interdigitated (30) | BMIM BF4 | 1 | 0.428 | 80 | 0.2 | 0.003 |
| LSG [6] | Planar | EMIM BF4 | 4 | 5.0 | 7.6 | 40 | 5.3 |
| PyP [9] | Interdigitated (9) | EMIM TFSI ionogel | 2 | 0.6 | 1.2 | 1.2 | 1.0 |
| LSG [36] | Interdigitated (16) | BMIM TFSI ionogel | 2.5 | 1.8 | 7.6 | 5.6 | 0.74 |
| CNT (this work) | Planar | BMIM BF4 ionogel | 3.75 | 1.9 | 2 | 13.4 | 6.7 |
Note: The number of interdigitated fingers are in parentheses. AC, activated carbon; C onion, carbon onion; LSG, laser scribed graphene; PyP, pyrolyzed photoresist. The last column is the areal energy divided by the thickness of one electrode.
Using table 1, it is clear that the CNT/ionogel EDLC offers improvements in voltage and energy, especially among the solid-state ionic liquid-based supercapacitors. The CNT/ionogel EDLC has one of the highest operating voltages among the data shown in table 1, and the highest for a quasi-solid. Of all the systems in table 1, the ac with NaNO3 stores the most energy but has one of the thickest electrodes. To better account for the differences in electrode thickness, the last column of table 1 scales the areal energy by the thickness of one electrode. Using the metric of energy per electrode thickness, it is clear that the CNT/ionogel has higher energy density than the similarly sized planar LSG with liquid EMIM BF4. The CNT/ionogel offers the advantages of a solid-state electrolyte, higher operating voltage and denser energy storage than other similarly sized devices.
5. Conclusions
In the field of supercapacitors, there are many different choices for materials and techniques, but there is a common goal of achieving high power and high energy devices. Electrophoretic deposition has advantages in its selectivity, simplicity and binder-free process over other electrode deposition techniques. These CNT electrodes show the highest areal energy density for a quasi-solid EDLC in the literature, at 13.4 mJ cm−2. Combining these electrodes with the platform of the ionogel, we have shown a quasi-solid EDLC that preserves the operating voltage and ionic conductivity of the constituent ionic liquid electrolyte. The encapsulation of ionic liquids provides benefits in packaging, and combining these advances leads to a robust EDLC that is suitable for miniaturization into a micro-supercapacitor.
Acknowledgments
The authors acknowledge the support of the FENA Focus Center, one of six research centers funded under the Focus Center Research Program (FCRP), a Semiconductor Research Corporation entity. The authors also acknowledge the support in part from the following NSF IGERT programs: Materials Creation Training Program; DGE-0654431 (DM) and NSF Clean Green IGERT; DGE-0903720 (LS). The authors also greatly appreciate the support of this research in part by the Office of Naval Research.