
Abstract
The formation mechanism of fibrous tungsten nanostructures, fuzz, induced by helium plasma irradiation on tungsten materials has been investigated. We have developed a BCA-MD-KMC hybrid simulation, which solves the injection process of helium atoms by the Binary Collision Approximation (BCA) method, the diffusion process of helium atoms in tungsten materials by the Kinetic Monte-Carlo (KMC) method, and the deformation of tungsten materials due to helium bubbles by the Molecular Dynamics (MD) method. In addition, the model used to calculate the recoiling of tungsten atoms in BCA was improved to account for the reduced binding energy of tungsten atoms on rough surfaces. Using the hybrid simulation, the height of the nanostructures reached about 50 nm. The main mechanism of nanostructure growth was that sputtering and redeposition caused transport of tungsten atoms perpendicular to the surface. The present simulation was able to represent not only the dependence that the nanostructure height increases in proportion to the square root of the helium fluence, but also the existence of incubation fluence before the growth starts.
Export citation and abstract BibTeX RIS

Original content from this work may be used under the terms of the Creative Commons Attribution 4.0 licence. Any further distribution of this work must maintain attribution to the author(s) and the title of the work, journal citation and DOI.
1. Introduction
When tungsten surfaces are irradiated with helium plasma, the bubbles have a size of 1-10 nm which are called helium bubbles [1, 2]. The fluence of plasma irradiation required for a helium bubble is about 1021 m−2. When the fluence reaches 1024 m−2 or more, the fiberform nanostructure on the tungsten surface which is called 'fuzz' is generated [3, 4]. The width of the fiber is several tens of nanometers. With the fluence of helium plasma irradiation, the length of fibers increases and it reaches a micrometer or more.
The formation of fuzz has been observed in many environments, i.e. linear plasma devices NAGDIS-II [5], PICIES-B [6], MAGNAM-PSI [7, 8], and PSI-2 [9], large torus devices ASDEX Upgrade [10] and Large Helical Device (LHD) [11], and a magnetron sputtering [12]. Therefore, the formation of fuzz is a universal physical phenomenon caused by helium plasma irradiation. Tungsten material is used as the inside wall of the vacuum vessel and the divertor plate of magnetic confinment fusion devices. There has been some concern that the fuzz causes problems. The generation of arcing increases when the surface is covered with the fuzz [13, 14], and the arcing generates droplets of tungsten, becoming dust for plasma [15]. On the other hand, the sputtering is reduced on the surface filled by the fuzz [16]. Microscopic cracks caused by intermittent heatload are suppressed by the fuzz [17], while thermal conductivity on the divertor plates is reduced [18]. In addition, it is expected that the fuzz enhances hydrogen isotope retention [1].
In the present work, scientific interest is the formation mechanism of the fuzz, which has not yet been clarified. The sputtering and etching are by plasma irradiation, or (2) the deposition of source molecules from plasma. However, it had been considered that the helium plasma in the growth process of the fuzz does not bring about the sputtering because the incident energy of helium ions is lower than the sputtering threshold energy which is 105-120 eV, estimated by the Binary Collision Approximation (BCA) method. In addition, it is not the latter because the helium, which is a noble gas, cannot create bonding and cannot deposit on the surface.
Although the direct relationship is not well understood, helium bubbles are thought to play an important role in the formation of fuzz. Therefore, the behaviors and mechanisms for helium bubbles have been investigated by using numerical simulations. The reason for the agglomeration of helium atoms in tungsten materials is explained by the density functional theory(DFT) [19, 20]. A place with low electron density is an energetically stable location for noble gas atoms, and the helium atoms self-agglomerate to create an area with low electron density [21]. Molecular dynamics (MD) methods have demonstrated the formation process of helium bubbles and the emission of dislocation loops from the helium bubbles [22, 23], which is called 'loop punching'. Moreover, if helium bubble grows near the surface, it bursts. However, in an MD simulation for a short timescale, the size of the pinhole on the surface generated by the bursting is less than 1nm. Although the size of the pinhole in the MD simulations is smaller than that in experiments [5], almost all helium atoms in the bubble quickly escape to the vacuum region within a few picoseconds [24, 25].
Anyway, the dislocation loop released toward the surface and the bursting of helium bubbles forms a 1-2 nanometer ridge on the surface. Therefore, this has been considered as an early process of fuzz formation, it has been expected that a large scale and long time simulation can represent the fuzz formation. Since MD has a limit to the timescale that can be reproduced, the flux has to be larger than the experimental conditions. Therefore, it is important to achieve large fluence while setting the flux as low as possible. Excessive flux causes unreal destruction of tungsten material. Hammond et al [26–28] have taken up the challenge of a the massively parallel MD simulation for helium plasma irradiation onto tungsten surfaces, and its MD achieved a fluence of 1019 m−2 with a flux of 1025 m−2s−1, and a fluence of 1021 m−2 with a flux of 1027 m−2s−1. These certainly deserve the record for long-time calculations of MD, and have demonstrated that the size of the pinhole due to helium bubbles became large for a long time (>4 nm). However, no fuzz growth was observed in those MD simulations, although this may have been due to the fact that the fluence was still small.
To aim at reaching a long timescale such as seconds or longer, in our previous works, an MD-KC hybrid simulation was developed [29, 30]. In the MD-MC hybrid simulation, the diffusion of helium atoms was solved by using the Kinetic Monte-Carlo (KMC) method and while the deformation of tungsten material due to helium bubbles was solved by using MD. Since long time diffusion was quickly calculated by KMC, the MD-MC achieved a fluence of 0.5 × 10²² m−2 with a flux of 1.4 × 10²² m−2s−1 during a day of calculation time. Although the MD-MC in a two-dimensional condition showed growth of surface roughness, this was due to the fact that the two-dimensional structure of tungsten was very brittle and easily broken. On the other hand, the MD-MC in a three-dimensional condition could not show growth of the nanostructure even when the fluence reached 1023 m−2 or more.
We need to elucidate the driving force that causes the transport of tungsten atoms in a surface vertical direction, which is essential for the growth of fuzz. From macroscopic viewpoints, many coarse-grained models for fuzz formation were proposed by assuming the driving force for normal transport of tungsten atoms. The proposed driving forces are loop punching and bursting [31], the gradient of adatom concentration [32], viscosity and an elastic modulus [33–35], and stress in the near surface region [36]. In this situation, we wish to identify the causes of the driving forces from a microscopic and ab initio viewpoint by using MD or any atomistic simulations.
Now, as mentioned above, the sputtering has been excluded from the formation of the fuzz due to low incident energy. However, in the present work, we dare to consider the possibility of sputtering. The reason is that the known sputtering threshold energy for helium atoms on tungsten material is estimated from bulk tungsten material, at least in the BCA model, without considering nanoscale surface roughness. In addition, the massively parallel MD and MD-MC hybrid methods described above have a common simplification under the assumption that sputtering hardly occurs. That is, the injection process of the helium atoms is not solved in their simulations, because it requires a computational cost due to a short time step in MD. Instead of injection, the helium atoma are directly implanted inside the tungsten material.
In the present work, we tried to reproduce the growth of the fuzz using the BCA-MD-KMC multi-hybrid method [37], in which the injection process is solved using BCA and connected to the MD-MC hybrid method. In addition, the model of BCA is improved in terms of the recoil of tungsten atoms to take into account the effect of the nanoscale roughness of the surface. In the section 2, the hybrid simulation method is described. In the section 3, we demonstrate the nanostructure growth from the present simulation and it is also discussed in the section 4. We conclude the paper with a proposed mechanism of nanostructure growth in section 5.
2. Simulation method
We have developed a hybrid simulation to treat a phenomena under plasma irradiation in a nanometer scale, while at the same time aiming to reach a long timescale. The formation and bursting of helium bubbles is based on MD-MC hybrid calculations [29, 30]. The long time diffusion process of helium atoms is solved by KMC and the deformation of the tungsten material due to helium bubble formation is solved by MD. The key point of the present work is to add the injection process of helium atoms. Here the injection process can be ideally solved by MD. However, the number of injections exceeds 1 billion in the present simulation towards 1024 m−2 in fluence. Therefore, we employed BCA to solve the injection process in the hybrid method and modified the model in terms of generation process of recoil atoms. In this section, we first describe the modification of BCA. Then, we describe the combination of BCA and MD-MC.
2.1. Modification of binary collision approximation
The basic flow of BCA is described in figure 1(a): Even when multiple particles are moving, as in cascade scattering, their trajectories are calculated one particle at a time. All particles except the one currently being tracked are stored in the moving particle stack and calculated later. At the beginning of the BCA calculation, the moving particle stack is empty. In step 1, an injected particle is pushed into the stack. In step 2, a particle is selected from the moving particle stack and assigned as the 'projectile' to be tracked here. In step 3, a collision target particle for the projectile is selected from the atoms of the target material. In the traditional code, the atoms of the material are not kept due to resource limitation, and the target particles are generated each time, using random numbers. On the other hand, in the hybrid method, all the atomic coordinates of the target material are kept in a memory resource and shared with MD.

Figure 1. (a) The flow of the BCA simulation. (b) The flow of the BCA-MD-KMC hybrid simulation.
Download figure:
Standard image High-resolution imageIn step 4, the binary collision of the projectile and the target particle is solved according to classical mechanics, and then the asymptote of the trajectory after the collision is obtained. In the present work, Ziegler-Biersack-Littmark (ZBL) potential [38] is used as a interatomic potential function between the two atoms. Let the kinetic energy of the projectile before the collision be E1, and the kinetic energies of the projectile and the target atom after the collision be  and
and  , respectively.
In step 5, it is determined whether the target particle has been recoiled or not. If the kinetic energy of the target atom received by the collision  is greater than the recoil cutoff energy Er, the target is assumed to have been recoiled and is added to the moving particle stack.
The decision to continue or stop tracking the projectile is made in steps 6 and 7. If the tracking is stopped, the process is classified into 'implantation', 'displacement', 'reflection', 'sputtering' and 'surface trap'. In step 6, if the z-coordinate of the projectile after the collision is less than the surface height Hz
, assume that the projectile is still inside the material and go to step 7a, while if the z-coordinate is greater than the surface height Hz
, go to step 7b. In step 7a, if the kinetic energy of the projectile  is less than the stop threshold energy Es, it is considered as 'implantation' or 'displacement'. If not, return to step 3 to find the next collision target. In step 7b, if
  is greater than the surface energy Esbe, it is considered 'reflection' or 'sputtering'. If
  , it is considered a 'surface trap'. In the present simulation dealing with fuzz, Hz
is set to the upper boundary of the simulation box, and the space below Hz
contains a microscopic vacuum area in the gap between fibers of the fuzz. Therefore, the projectile determined to be a 'surface trap' is pulled back to the position just after the last collision, which is near the actual surface, and is stopped there. The particles determined as 'implantation' are added to the shared atoms with MD. The particles determined as 'sputtering' are removed from the shared atoms with MD. The particles determined as 'displacement' or a 'surface trap' are updated for their coordinates in the shared atoms with MD.
, it is considered a 'surface trap'. In the present simulation dealing with fuzz, Hz
is set to the upper boundary of the simulation box, and the space below Hz
contains a microscopic vacuum area in the gap between fibers of the fuzz. Therefore, the projectile determined to be a 'surface trap' is pulled back to the position just after the last collision, which is near the actual surface, and is stopped there. The particles determined as 'implantation' are added to the shared atoms with MD. The particles determined as 'sputtering' are removed from the shared atoms with MD. The particles determined as 'displacement' or a 'surface trap' are updated for their coordinates in the shared atoms with MD.
When the tracking of a projectile is finished, it reaches step 8. Here, if there are any particles in the moving particle stack, the tracking of the next projectile is started by returning to step 2. The recoiled particles should be added to the moving particle stack in step 5, and the trajectories obtained by tracking all of them is a cascade scattering. When the moving particle stack is empty, the BCA calculation for an injection process is finished.
Our focus has been on the algorithm for the generation of the recoiled particle in the above step 5. In traditional BCA codes, the recoil cutoff energy Er is set equal to or less than the surface binding energy Esbe, which is typically replaced by cohesive energy or sublimation energy. In addition, most importantly, Er and Esbe are usually constant values because traditional BCA codes assume a bulk with a uniform particle distribution and a flat surface.
However, the uniform particle distribution in the present simulation is only at the beginning, because of helium. Also, the flat surface will change to a rough one as the helium bubbles burst on the surface. Therefore, in the present work, we propose a model of recoil that takes into account the atomic configuration in the material. The recoil cutoff energy is considered as the binding energy in the material and is assumed to vary with the number of bonds for each atom. The number of bonds of the i-th atom ni is defined by the following equation:


where rij
is the distance between atoms. The cutoff lengths are set as  and
and  to count the number of the first neighbor atoms in the Body-Centered Cubic (BCC) tungsten material. Note that the lattice constant of the BCC tungsten is 3.2 Å under the used potential model [25]. Then distances to the first and second nearest neighbor atoms are 2.77 Å and 3.2 Å, respectively. The symbol ∑W
means that the sum is for W-W pairs only and does not include W-He pairs. The recoil cutoff energy for the i-th tungsten atom, Er,i
, is given by the square root of the number of bonds as follows:
to count the number of the first neighbor atoms in the Body-Centered Cubic (BCC) tungsten material. Note that the lattice constant of the BCC tungsten is 3.2 Å under the used potential model [25]. Then distances to the first and second nearest neighbor atoms are 2.77 Å and 3.2 Å, respectively. The symbol ∑W
means that the sum is for W-W pairs only and does not include W-He pairs. The recoil cutoff energy for the i-th tungsten atom, Er,i
, is given by the square root of the number of bonds as follows:

where  which is the cohesive energy of tungsten and nbulk = 8 is the number of bonds in the case of a bulk BCC structure. This model where the binding energy is proportional to the square root of the number of bonds is based on the embedded atom method [39] and the tight-binding model [40]. Since the coordinates of the target atoms are shared between BCA and MD, ni
and Er,i
in BCA change according to the structure changes due to the time evolution of MD. As a result, the recoil cutoff energy of a tungsten atom near the helium bubble or near surfaces with roughness is expected to be smaller than that of the bulk.
which is the cohesive energy of tungsten and nbulk = 8 is the number of bonds in the case of a bulk BCC structure. This model where the binding energy is proportional to the square root of the number of bonds is based on the embedded atom method [39] and the tight-binding model [40]. Since the coordinates of the target atoms are shared between BCA and MD, ni
and Er,i
in BCA change according to the structure changes due to the time evolution of MD. As a result, the recoil cutoff energy of a tungsten atom near the helium bubble or near surfaces with roughness is expected to be smaller than that of the bulk.
It should be noted that the above improvement in the recoil cutoff energy is only applied in the case of tungsten atoms. For helium atoms, the recoil cutoff energy is constant at 1.5 eV. The surface binding energies for tungsten and helium atoms are also constant at 8.9 eV and 0.0 eV, respectively. In step 7b of the traditional code, the kinetic energy of a projectile, which consists only of velocity components normal to the surface, is often compared with the surface binding energy to judge a 'surface trap' or 'sputtering'. However, since the normal direction is difficult to define for nanoscale rough surfaces, this study compares the kinetic energy of projectiles consisting of all velocity components.
2.2. Algorithm of BCA-MD-KMC hybrid method
In the BCA-MD-KMC hybrid simulation [37], the injection process of helium atoms onto the target tungsten material is solved by using BCA, the deformation process of the tungsten materials receiving forces from the helium bubble is solved by using MD, and the diffusion process of the helium atoms in the tungsten material is solved by using KMC, as shown in figure 2. The BCA and MD parts are atomistic simulations and share all the atomic coordinates during the hybrid simulation. The MD part is simply performed with the Langevin thermostat [41, 42].

Figure 2. The schematic image of the BCA-MD-KMC hybrid simulation. The left figure is the all-atom simulation system for MD and BCA, in which the pink and blue spheres indicate the tungsten atoms and the helium atoms, respectively. The right figure is the cell simulation system for KMC, in which the pink and blue cells indicate the cell labeled as the tungsten region and the cell labeled as the helium region, respectively.
Download figure:
Standard image High-resolution imageOn the other hand, the KMC simulation is performed in the cell system. The simulation box is divided into cubic cells with a width approximately 3.2 Å which is the width of the simulation box divided by an exact integer. By reflecting the atomic coordinates in the MD part, the cubic cells are classified into the following three kinds of cells. The first is the vacuum cell in which no atoms in a cell region. The second is the helium cell in which the number of helium atoms located in a cell region is 4 or greater. The third is the tungsten cell in which tungsten atoms are located. If the number of helium atoms in a cell is less than 4, it was regarded as a movable helium object in KMC. This assumption corresponding to the fact that diffusion of a helium atom, dimer and trimer is quickly in a tungsten material and while the diffusion of helium cluster with 4 or more atoms is slow [43]. The movement of the helium object follows general lattice KMC. Each helium object moves to the six adjacent cells. If the adjacent cell is the vacuum cell, the helium object is deleted. If the adjacent cell is the helium cell, it is regarded as trapped. The trapped helium object cannot move in KMC hereafter. If the adjacent cell is a tungsten cell, the helium object continues to move. However, when two helium objects meet in the tungsten cell, they fuse into an object with a total number of helium atoms. If the total number of helium atoms reaches 4, the tungsten cell changes into the helium cell and the helium object is regarded as trapped. Finally, before the simulation of MD part starts, the coordinates and number of atoms in helium object are reflected into the MD. The event selection algorithm is based on the use of a binary tree search [44, 45].
The basic flow of the BCA-MD-KMC hybrid simulation is shown in figure 1(b). An injection process can be regarded as an event in the KMC, and the occurrence rate of the injection event is given by the product of the incident flux and the surface area. Therefore, the injection of the helium ions and the migration of the helium atoms in the tungsten material are repeated under the event selection algorithm of KMC as the BCA-KMC hybrid method [46]. Strictly speaking, the transition from the BCA-KMC simulation part to the MD simulation part depends on the number of absorptions in the injection processes on the BCA and the number of helium atoms trapped by the helium bubble region on the KMC. When either number reaches a set threshold, the BCA-KMC simulation part switches to the MD simulation part. Before starting the MD simulation, the trapped helium objects are implanted as particles into the atomic coordinates in the MD, and the positions of all helium atoms and only the recoiled tungsten atoms are relaxed to make the force acting on them smaller than 0.1 eV /Å. In this way, the calculation time of MD is kept to the minimum necessary to treat deformation such as the loop-punching and the bursting of helium bubbles. The MD simulation part is calculated at just 104 steps at one cycle, switching until the next BCA-KMC simulation part. Before starting the BCA-KMC simulation, the cells for KMC are refreshed and classified into the above three kinds of cells by counting the number of atoms of MD in each cell region.
In the present BCA-MD-KMC hybrid simulation, there are three conditions for switching from the BCA-KMC part to the MD one. The first condition is that the steps of KMC reaches the threshold sth = 108, in which the injection process solved by the BCA is counted as one step. The second condition is that the number of helium atoms trapped by the helium bubble region in the diffusion process of the KMC reaches the threshold  where
where  and the initial surface area S = 9.296 × 10⁻¹⁶ m2. The third condition is that the number of absorbed helium atoms in the BCA reaches the threshold
  where
where  and ϕ is the flux of helium atoms. In the present work, the flux is set to ϕ = 1.4 × 10²² m−2s−1, which corresponds to that in the NAGDIS-II experiments [4]. On the other hand, the parameters sth, nth
trap, and
and ϕ is the flux of helium atoms. In the present work, the flux is set to ϕ = 1.4 × 10²² m−2s−1, which corresponds to that in the NAGDIS-II experiments [4]. On the other hand, the parameters sth, nth
trap, and  are artificial parameters to reduce the computation time. Ideally, their parameters should be small values. Since MD can only achieve a shorter time than that in reality, it is not possible to set ideal values to their parameters.
The simulation box has a size of 30.37 × 30.61 × 83.54 nm3, as shown in figure 3(a). The initial tungsten material with a thickness of 50.14 nm is located at the bottom of the simulation box. Its structure is a BCC one with a lattice constant of 3.2 Å and a (111) surface. The MD simulation is performed using the core of the GLIPS code [25] under the following conditions: The time step is Δt = 1.05 × 10⁻¹⁵ s. To control temperature T at 1100 K, the Langevin thermostat is employed and the relaxation time 1/γ = 1.05 × 10⁻¹¹ s. The atoms located up to 4.8 Å from the bottom boundary of the simulation box are fixed during MD. For the inter-atomic interaction among tungsten and helium atoms, the potential model that is based on the Embedded Atom Method is optimized by comparing the DFT calculations [25]. The KMC simulation is performed using the core of the FlyAM code [47]. In the KMC, the diffusion coefficient of the helium atom D = 1.0 × 10⁻⁸ m2/s. The BCA simulation is performed using the core of the BDoG code [37] under the following conditions: The incident energy of the helium atom EI = 100 eV. The Oen-Robinson model [48–50] is employed as a model of electron stopping power.

Figure 3. (a) Simulation box with the initial tungsten material, (b)-(h) The snapshots of the target tungsten materials in the BCA-MD-KMC hybrid simulation. The spheres indicate atoms, and they are colored according to their z-coordinates.
Download figure:
Standard image High-resolution image3. Results
In total, the hybrid simulation achieved a fluence of 1.13 × 1024 m−2 and an elapsed time of 80.4 s. The total number of helium atom injections reached 1.0 billion. Total compuration time was about 90 days in the cluster system of Intel Xeon Gold with 240 CPU cores. On average, during a cycle of switching between the BCA-KMC part and the MD one, 0.916 × 10⁻³ s elapses in the simulation of the BCA-KMC part, while about 1.05 × 10⁻¹² s elapses in the simulation of the MD part.
As a result of the BCA-MD-KMC hybrid simulation, the nanostructure is generated on a tungsten surface, as shown in figure 3. The atoms in this figure are shown in colors depending on their positions in the z-direction. Initially, up to 1021 m−2 in fluence, the loop-punching and the bursting of helium bubbles occur, and then the surface is raised to a height of several nanometers. The width of the raised structure is approximately 5-10 nm in the x- and y-directions. Until the fluence reaches 1022 m−2, the apparent height of the raised surface changes little. However, the width of the raised structures narrows to about 2-3 nm, and the entire surface is covered with these narrow raised structures. From 1022 m−2 to 1024 m−2, their height increases. In this stage, their width increases again, but their number decreases accordingly. Finally, when the fluence reaches to 1024 m−2, the height of the raised structures reaches about 50 nm.
In order to quantitatively evaluate the growth of the nanostructures, we define the surface height h(i, j) as follows: The (x, y) space is divided into discrete cells with a width of 3.2 Å and specify them by (i, j). All tungsten atoms are assigned to the discrete cells (i,j) from the x and y coordinates of each atom. The height h(i, j) is the largest z-coordinate in the tungsten atoms that are assigned to each discrete cell. Of course h(i, j) is also a function of time, although not explicitly stated, since the surface changes with time.
The above explanation, based on visualization in figure 3 focuses on the ridge structure. However, in fuzz growth there are not only raised areas but also sinking ones below the original surface [5, 51]. To confirm the sinking areas, the maximum, minimum and mean of h(i, j) are shown in figure 4(a). It is confirmed that as the fluence increases, not only does maximum height increase but also the minimum height decrease which means sinking. The difference between the maximum and minimum heights corresponds to the thickness of the nanostructure layer and reaches about 50 nm at 1024 m−2 in fluence.
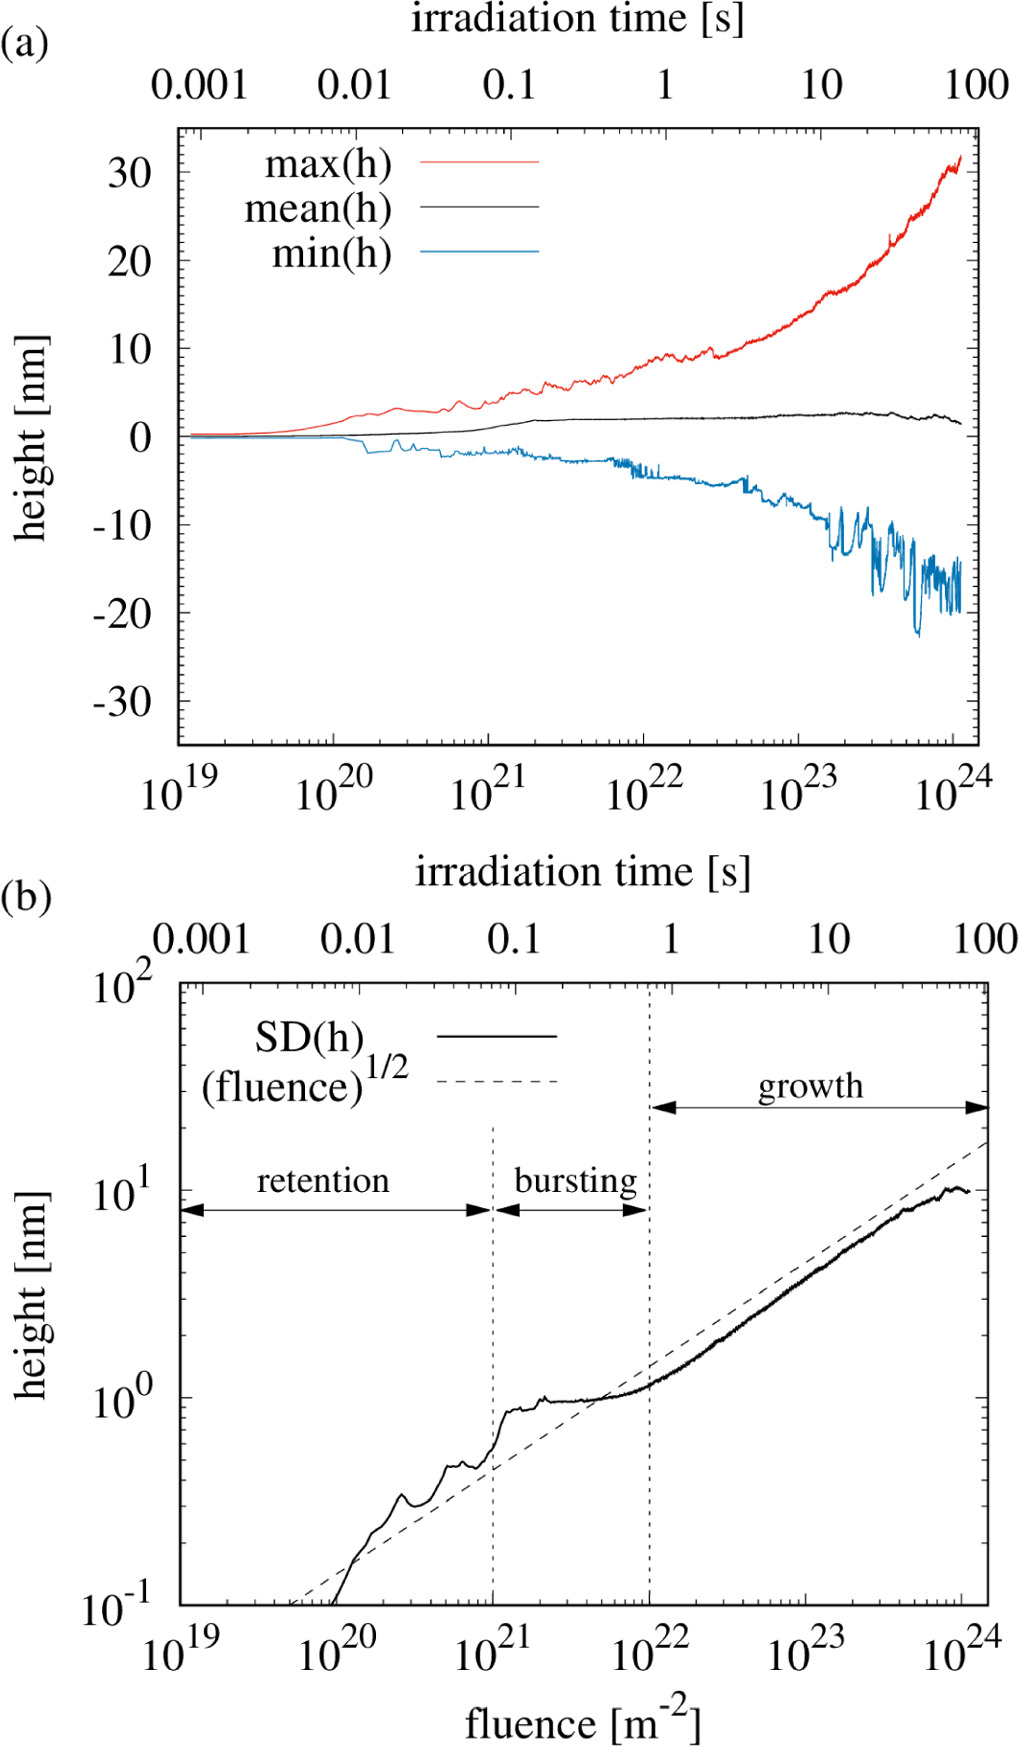
Figure 4. (a) The mean, minimum and maximum of the surface height h(i, j) as a function of fluence. (b) The standard deviation (SD) of the surface height h(i, j) as a function of fluence. The dashed line is a reference function proportional to the square root of fluence.
Download figure:
Standard image High-resolution imageMoreover, the mean height is hardly changed in the simulation. If volume expansion due to helium implantation is the primary cause of fuzz growth, then the average height of the surface probably continues to increase. However, the fact that the mean height of the surface hardly changes indicates that there are factors other than volume expansion due to helium implantation.
Since the mean height does not change, we evaluate the standard deviation of the surface height, as ![${\sigma }_{{\rm{h}}}=\sqrt{V[h(i,j)]}$](https://content.cld.iop.org/journals/2053-1591/10/12/125002/revision2/mrxad0ea9ieqn15.gif) . The standard deviation of the height is a statistically better quantity for discussing the thickness of the nanostructure layers than the maximum and minimum heights. The actual thickness of the nanostructure layers estimated from a visualization such as figure 3 is considered to be roughly several times σh. From the profile of σh in figure 4(b), it can be regarded that the nanostructure growth consists of the following three stages. The first stage is the period from the start of irradiation to 1021 m−2 in fluence, and σh increases non-smoothly with the increase of fluence. In this stage, the height of nanostructure is up to 1 nm. The second stage is the period from 1021 m−2 to 1022 m−2. It can be confirmed that σh is maintained during this stage. On the other hand, in the third stage from 1022 m−2 to 1024 m−2, σh smoothly increases with the increase of fluence.
. The standard deviation of the height is a statistically better quantity for discussing the thickness of the nanostructure layers than the maximum and minimum heights. The actual thickness of the nanostructure layers estimated from a visualization such as figure 3 is considered to be roughly several times σh. From the profile of σh in figure 4(b), it can be regarded that the nanostructure growth consists of the following three stages. The first stage is the period from the start of irradiation to 1021 m−2 in fluence, and σh increases non-smoothly with the increase of fluence. In this stage, the height of nanostructure is up to 1 nm. The second stage is the period from 1021 m−2 to 1022 m−2. It can be confirmed that σh is maintained during this stage. On the other hand, in the third stage from 1022 m−2 to 1024 m−2, σh smoothly increases with the increase of fluence.
Here, the increase of σh in the third stage is proportional to the square root of the fluence and irradiation time, that is t−1/2. This fact agrees with the experimental result [6, 52].
In addition, the existence of an incubation fluence or incubation time is known from experiments [53]. That is, a fluence of 1024 m−2 or more is required for the fuzz to start growing. The present simulation is qualitatively consistent with the existence of the incubation fluence, although the fluence to start growing in the simulation is 1022 m−2, which is two orders of magnitude smaller than that in the experiment. In order to understand the cause of the incubation fluence, we focus on the activity of the second stage. Regarding only the height of the nanostructure, in the second stage, it is seen to be stationary. However, as figures 3(c) to (e) show, the nanostructures become narrower during this stage, and the surface is fully covered with narrow nanostructures. We tentatively hypothesize that a qualitative change in this surface structure is necessary to start the growth. However, future detailed studies are needed to support this hypothesis.
In order to analyze the three stages for nanostructure growth, the time dependency of helium retention, which is the number of helium atoms staying in the tungsten material, is evaluated, as shown in figure 5. The helium retention linearly increases with the fluence from the start of the simulation to 1021 m−2. This period is consistent with the first stage. Therefore, the first stage is called the retention stage.

Figure 5. Helium retention, which is the number of helium atoms existing within the target material per surface area, as a function of fluence.
Download figure:
Standard image High-resolution imageHere the helium retention increases smoothly and linearly, while σh increases non-smoothly. We consider that this discrepancy is related to the properties of the helium bubble as follows. As the helium retention increases, the volume of the helium bubble does not easily increase. Instead of the volume, its internal pressure increases. Then, when the internal pressure reaches a threshold when the tungsten material can resist the pressure, loop punching occurs. That is, the volume of the helium bubble expands instantaneously. As a result, the volume of the helium bubble is discontinuous as a function of time, according to the occurrence of the loop punching. And the deformation of the tungsten material due to the loop punching that reaches the surface is reflected in σh. As a result, σh is expected to increase non-smoothly.
For a fluence greater than 1021 m−2, the helium retention is roughly saturated, although it oscillates microscopically with the increase of fluence. The oscillation of the helium retention is a repetition of an increase proportional to the fluence and an instantaneous decrease. The instantaneous decrease is a signal of the release of helium atoms by the bursting of the helium bubble. Although the bursting of the helium bubble is observed from about 1020 m−2 in fluence, it is considered that the fluence, when the occurrence frequency of the bursting reaches a frequency sufficient to saturate the helium retention, is about 1021 m−2. By comparison with the growth of surface height in figure 4(b), the saturation of the helium retention begins from the second stage. Therefore, the second stage of nanostructure growth is the bursting stage. The frequent bursting probably causes the qualitative change of the surface structure which are filled by narrow nanostructures, as shown in figure 3(d) and (e).
On the other hand, in the third stage of nanostructure growth after 1022 m−2 in fluence, the height of the nanostructure begins to increase again, but the helium retention does not particularly change. This suggests that a mechanism other than the bursting and the loop punching is necessary for nanostructure growth.
To investigate the growth mechanism of nanostructures in the third stage, we focus on the sputtering of tungsten atoms by incident helium atoms. The 'net sputtering yield' is defined as the ratio of the number of helium atoms that escape from the z-boundary of the simulation box to the number of incident helium atoms. Figure 6 shows the net sputtering yield as a function of fluence. For a fluence less than 1022 m−2, which is in the first and second stages, the net sputtering yield is smaller than 10−5. The reason why the sputtering yield appears to drop for fluence from 1.0 × 10²⁰ m−2 to ×1021 m−2 is simply that the surface area in the simulation is small. Since the surface area is only about 10−15 m2, the actual number of incident helium atoms is only 105 at a fluence of 1020 m−2. If only an atom is sputtered out, the sputtering yield will be 10−5. Similarly, the number of incident helum atom is 106 at a fluence of 1021 m−2. If only an atom is sputtered out, the sputtering yield is 10−6. On the other hand, for a fluence greater than 1022 m−2, the net sputtering yield increases to about 10−4. From this fact, it is expected that the sputtering of tungsten atoms is related to the nanostructure growth in the third stage.
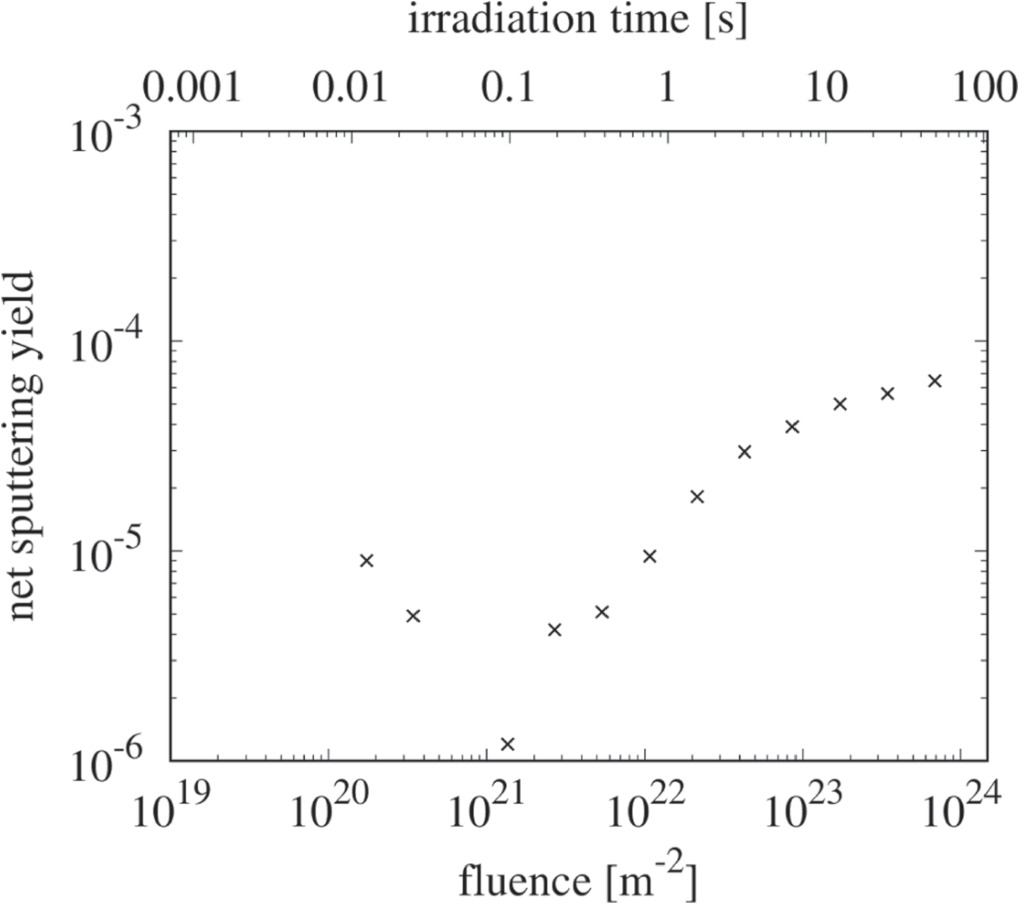
Figure 6. Net sputtering yield as a function of fluence. This counts the tungsten atoms that have escaped the z-boundary of the simulation box and does not count those that are redeposited on the surface after being sputtered out of the surface.
Download figure:
Standard image High-resolution imageOf course, the net sputtering yield is still small compared to that in the experiments and the BCA simulations [16, 54, 55].
Furthermore, the net sputtering yield is a macroscopic quantity. Microscopically, the event of a tungsten atom being knocked out from its original position and starting to move as a recoil particle has a much higher probability than that of the net sputtering yield. When the recoiled tungsten atom stops immediately in the bulk material and cannot reach the surface, it is not counted as a net sputtering yield. Figure 7 shows the recoil ratio, which is defined as the number of recoiled tungsten atoms per helium atom injection. The recoil ratio is certainly higher than the sputtering yield. In addition, it is confirmed that the recoil ratio also increases with the increase of fluence.

Figure 7. The recoil ratio, which is the number of generated recoil atoms per helium injection, as a function of fluence.
Download figure:
Standard image High-resolution imageAlso, on a rough surface, even once a recoiled tungsten atom is released from the surface, it might hit the raised structures on the surface. If the recoiled tungsten atom is adsorbed there, it is not counted by the net sputtering yield. In this way, the transient ejection of a tungsten atom from the surface is also called sputtering from microscopic viewpoint, and the adsorption is called 'redeposition', here. Since the net sputtering yield is not high even in the third stage, it is considered that redeposition occurs at quite a high probability.
Let us show that sputtering and redeposition contribute to the growth of nanostructures. Here, the nanostructure growth requires the transport of tungsten atoms along the z-direction. The z-component of the displacement of recoiled tungsten atoms is shown in figure 8, where the tungsten atoms counted as the net sputtering yield are not included. The standard deviation of displacement increases as a fluence increases, and it reaches 6 nm or more at 1024 m−2 in fluence. The standard deviation of the displacement is sufficiently comparable to the standard deviation of the surface height σh of 10 nm. This long displacement is caused by the sputtering and redeposition, as shown in figure 10(c). Moreover, since the mean displacement is close to zero, the transport of tungsten atoms by the sputtering and the redeposition occurs not only in the direction from lower to higher locations in the nanostructure, but also in the opposite direction with approximately the same probability.

Figure 8. The z-component of the displacement which are recoiled atoms except for the case when the atoms escape from the z-boundary of the simulation box. (a) The mean and standard deviation (SD) of the z-component of the displacement as a function of fluence, and (b) the SD as a function of fluence.
Download figure:
Standard image High-resolution imageTo concretely confirm the impact of sputtering and redeposition on the third stage of growth, we compare it with the two cases of simulations where the model of the BCA part is modified tentatively. By comparison with them, the standard deviation of surface height σh is shown in figure 9. The first tentative case is the simulation in which the recoil cutoff energy for the knocking out of the tungsten atom is set a constant of 8.9 eV, the same as the traditional BCA. In this case, the nanostructure growth stage changes from the first to the second stage at a fluence of 1021 m−2. However, it could not shift to the third stage. Namely, σh did not increase for a fluence of 1022 m−2 or greater. The reason for this is that the sputtering cannot occur under the traditional BCA model. When a helium atom with kinetic energy E1=4.0 and mass m1 collides with a tungsten atom with mass m2 = 183.84 and then the tungsten atom receives the kinetic energy  , the maximum of energy transfer ratio is given by

In the present simulation, E1 < EI = 100 eV. Then the kinetic energy transferred to the tungsten atom  is less than 8.3 eV. This is smaller than the constant recoil cutoff energy of 8.9 eV. Consequently, the sputtering cannot occur in the traditional BCA model. This result suggests the sputtering is a necessary process of the transport of tungsten atoms for the nanostructure growth.

Figure 9. The standard deviation (SD) of the surface height h(i, j) as a function of fluence compared with tentative simulation conditions. The red line indicates the present simulation applying the improvement of the recoil process in which the recoil cutoff energy depends on the number of bonds. The black line indicates the first tentative case in which the improvement of the recoil process is not applied and in which the recoil cut-off energy is a constant, similar to the traditional BCA model. The blue line indicates the second tentative case in which the improvement of the recoil process is used and the redeposition ratio is artificially reduced.
Download figure:
Standard image High-resolution imageThe second tentative case shown in figure 9 is the simulation in which the dependence of the recoil cutoff energy on the number of bonds is applied and while the redeposition ratio is artificially reduced. In this case, the growth of nanostructure is able to shift to the third stage at a fluence of 1022 m−2. Then, σh reaches over 4 nm. However, the standard deviation σh in the third stage is proportional to the cubic root of fluence. This is a slower than the experimental growth rate proportional to the square root of fluence. This implies that the redeposition ratio of the sputtered tungsten atoms is important for the nanostructure growth.
4. Discussion
Let us discuss the validity of the improved model for recoil in BCA. The assumption that the binding energy of each tungsten atom is reduced by the roughness of the surface is reasonable. And, it is also appropriate to use the binding energy of each tungsten atom as the recoil cutoff energy, Er,i . The problem is the reliability of the approximation that Er,i is proportional to the square root of the number of bonds. In the future, the recoil cutoff energy for each atom needs to be estimated by using a more accurate model. DFT calculation can achieve sufficient accuracy for recoil cutoff energy [56]. However, in order to quickly estimate the recoil cutoff energy in accordance with the changing atomic configurations in time evolution, it would be useful to use machine learning and to improve the accuracy of the MD potential.
The recoil cutoff energy is important to understand the incident energy threshold for nanostructure growth. As experimental facts, the incident energy requires 6 eV for the helium bubble formation [2, 57] and 20-30eV [4, 58] for the fuzz formation. The former threshold incident energy is understood to be the solution energy of a helium atom in the tungsten material, which can be estimated as the energy difference between the case of helium atoms in a vacuum and in bulk tungsten material [21, 30]. The reason for the existence of the latter threshold incident energy is not yet well understood. From the present simulation, we expect that the latter threshold incident energy is due to the recoil cutoff energy. A tungsten atom sputtered at the incident energy of 30 eV is required to be bound on a surface at a binding energy of 2.5 eV, which is estimated from the energy transfer coefficient of 0.083. In the future, we should clarify how the tungsten atom has such weak binding energy. A detailed discussion using DFT would be useful.
Modeling the redeposition process is also important. In the present simulation, the redeposition process is simply based on the BCA model. Namely, the tungsten atom stops by collision when its kinetic energy becomes lower than the stopping threshold energy inside the material or the surface binding energy. The redeposition ratio of tungsten atoms has an impact on the growth rate, as shown in figure 9. To understand the details of the redeposition process, MD and DFT analyses are useful.
And redeposition is also associated with the experiment for the enhancement of tungsten atom depostions [59, 60], Nano Tendril Bundles (NTBs) [61, 62], and Large-scale Fiber-form Nanostructures (LFNs) [63], in which tungsten atoms sputtered elsewhere are deposited onto the fuzz, reaching sizes of a millimeter. Their growth rate is also dramatically increased. Whereas the thickness of ordinary fuzz increases in proportion to the square root of the fluence, the thickness of the LFNs increases in proportion to about square of the fluence [51, 64]. This fact is consistent with the result that the redeposition ratio affects the growth rate shown in this calculation.
Here we mention problems that are not explained by the present simulation. The simulated incubation fluence is two orders of magnitude lower than that measured in experiments. One possible reason is that the diffusion coefficient of the helium atom in the KMC part differs from the real one. If we aim to reproduce the same incubation fluence as the experiment, by changing the temperature and diffusion coefficient, we simply need a calculation time 100 times greater. However, this is difficult because it already takes one month of computation time at present.
Next, the fuzz generated in the experiments generally has a winding shape, while that of the nanostructure generated in this simulation is straight, like a needle. Let us consider the reason for this difference in shape. Of course, the nanostructure in the present simulation is only 50 nm long at best, and the experimentally observed fuzz is more than a micrometer long. So there may not be enough fluence for the nanostructure to start winding. If the winding of the nanostructure occurs when this simulation is resumed, the helium bubbles are probably also related to its mechanism. When the nanostructure reaches a certain thickness in the third stage, the helium bubblea are actually formed in the nanostructure. If these bubbles burst, it would be a trigger for the bending of the nanostructure. A transmission electron microscope (TEM) observation also shows many helium bubbles in the fibers of the fuzz [18].
To begin with, comparing the shape of fuzz is difficult to choose an indicator of the degree of winding. One way to compare shapes is the fractal dimension of the fuzz. The fractal dimension of fuzz was reported to be 2.2-2.8 from the experiment [65]. The fractal dimension may allow future comparisons between different experimental setups and between experiments and simulations.
Finally, we mention surface diffusion. Let us assume that the phrase refers to the atomic migration of tungsten on a surface. Since the surface is not flat, it may not be appropriate to call it an adatom, and yet it is assumed that an atom will move independently on a surface. Some are similar to hopping, others are called crowdion migration [66]. And if the atomic migration occurs over a long period of time under plasma irradiation, it can affect the shape of the nanostructure. Basically, surface diffusion seems to act in the direction of surface smoothing and flattening, like annealing. However, from the present simulation, it would be a different story if the adatoms were permanently supplied by sputtering and redeposition. Moreover, as shown in figure 8, the adatoms are produced by redeposition at locations far from their original positions, and the competition between adatom production, distribution and surface diffusion is likely to cause complex geometries. This is an interesting issue that affects both the shape of the fuzz and the generation of NTBs and LFNs.
5. Conclusion
In the present work, we simulate the nanostructure growth induced by helium plasma irradiation using the BCA-MD-KMC hybrid method. In particular, the recoil model in the BCA part was improved to account for the reduction in the binding energy of tungsten atoms on rough surfaces. The simulation achieved 1024 m−2 in fluence, and then a nanostructure reaching about 50 nm long was generated. The growth of nanostructure height proportional to the square root of fluence and the presence of incubation fluence to start growth were confirmed.
From the simulation, we propose the three-stage growth process of the nanostructure, as shown in figure 10. The first is the retention stage, in which helium retention increases linearly with the increase of fluence. The second is the bursting stage, in which many helium bubbles burst and the surface is filled with fine rough structures. The third is the nanostructure growth stage, in which the key mechanism is the transport of tungsten atoms by sputtering and redeposition.

Figure 10. Schematic image of the three stages of the nanostructure growth. The gray region is the tungsten material. The white and gray dark spheres indicate a helium atom and a tungsten atom, respectively. (a) The first is the retention stage for the retention of helium atoms and a helium bubble formation. (b) The second is the bursting stage for loop-punching and bursting of helium bubbles. (c) The third is the sputtering and redeposition stage in which tungsten atoms are transported by the sputtering and the re-deposition. If the sputtered tungsten atom deposits at place (i), this means transport in the negative direction, while if it deposits at place (ii), this means transport in the positive direction. If the sputtered tungsten atom escapes out of the nanostructure region, this is detected as net sputtering yield.
Download figure:
Standard image High-resolution image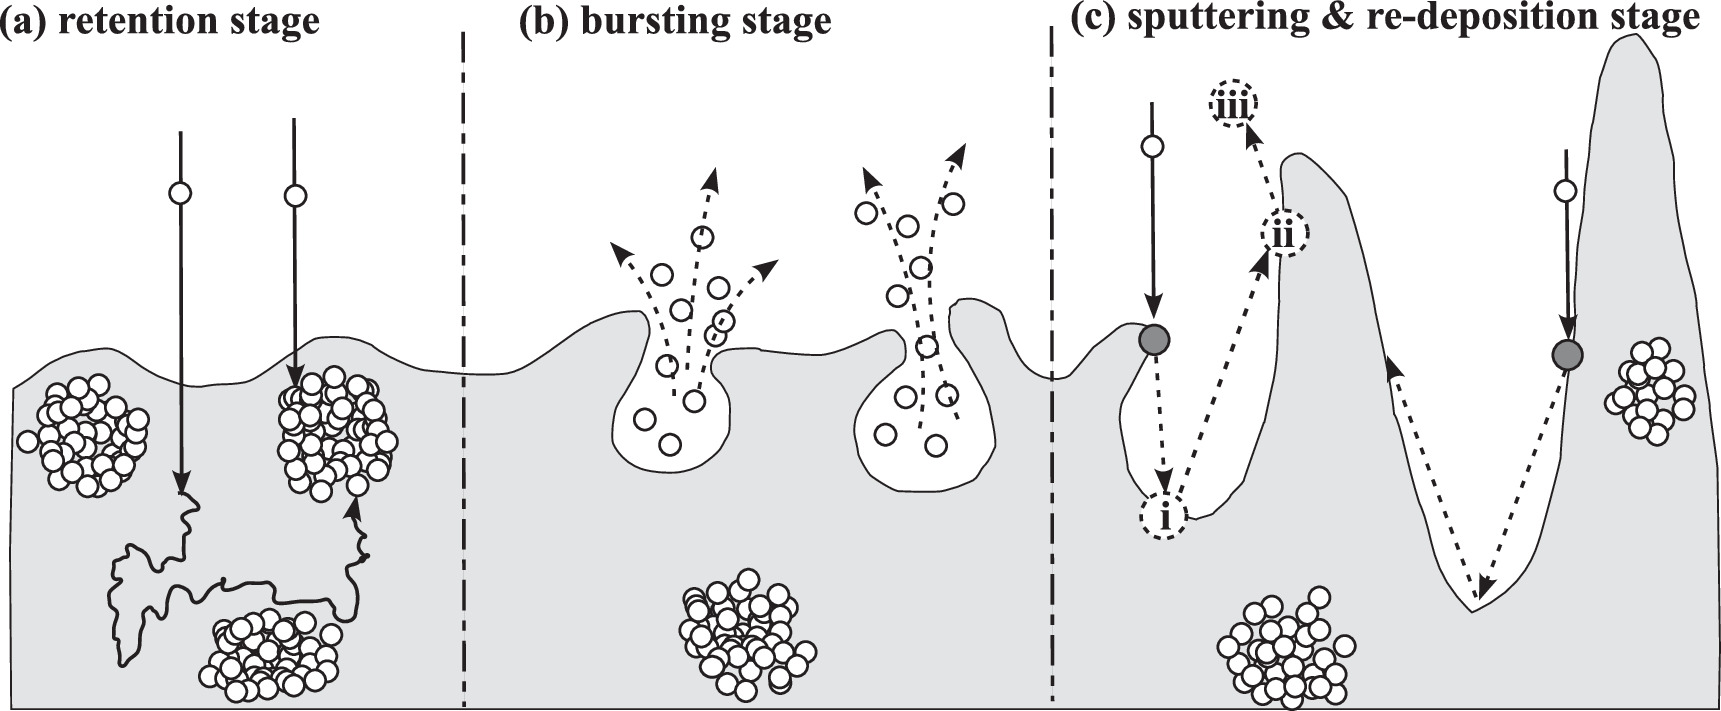
In addition, we mention open questions in fuzz formation. These open questions have in common that microscopic processes can have significant effects on the shape of materials, due to long time motions. This means that research on the formation of the fuzz can serve as a guide to understanding a more general problem of plasma-material interaction and for the wall materials of fusion reactors.
Acknowledgments
The present work was supported by JSPS KAKENHI (19K21870, 19H01882, 19H01874, and 23K17679). The simulation were performed on Plasma Simulator (NEC SX-Aurora TSUBASA) in NIFS with the support and under the auspices of the NIFS Collaboration Research program (NIFS22KISS027).
Data availability statement
The data cannot be made publicly available upon publication because the cost of preparing, depositing and hosting the data would be prohibitive within the terms of this research project. The data that support the findings of this study are available upon reasonable request from the authors.