

Abstract
Silk-based microsphere received remarkable attentions due to its impressive biocompatibility and biodegradation in drug delivery system. However, its application was still limited by complex process and unfriendly chemical agents using. In this study, we developed a novel approach to prepare silk fibroin nano or microspheres rapidly via electrostatic assembly. We demonstrated experimentally that the silk fibroin microsphere (SFM) with diameters ranging from 0.5 μm to 3 μm could be easily fabricated by combining pH value adjustment and low voltage electrostatic field. The production was optimized to be a simple and highly repeatable process that did not require sophisticated equipment and chemical agents. SFM represented α-helix structure enriching and homogeneous morphology, as well as improved dispersion and controllable size by regulating the silk fibroin concentration. The SFM demonstrated concentration-dependent drug release behavior with about 75% accumulative release ratio at day5. Thus, this SFM with high production efficiency and promise features provided a new drug carrier and substitute in control release field.
Export citation and abstract BibTeX RIS
1. Introduction
Microspheres provide a predictable opportunity for regenerative medicine and life science, such as drug delivery systems, cell culture carriers, and enzyme carriers [1–3]. Especially, microspheres are gaining increasing attentions as drug delivery system due to its efficiency and controllability [4, 5]. Up to now, many kinds of drug delivery system have been developed, including polymeric micelles, liposomes, microspheres, water-in-oil emulsification method, and nanoparticles [6–10]. As a drug delivery vehicle, microspheres should exhibit some excellent performances, such as sufficient stability for function, excellent incorporation for drugs and green process etc [11]. Considering requirements of microsphere and its fabrication, the protein material continued to be useful to prepare the nano or microspheres as promise applications in biomedicine field.
In recent years, silk fibroin as a natural polymer with a broad range of potential applications in textile, advanced materials, biomedical devices and drug delivery [12–15], which dependents on its impressive mechanical properties, good biocompatibility, biodegradability, and low-inflammatory response. Silk fibroin microspheres (SFM) showed a high promise to be effective vehicles of drug carrier [16]. This prospect motivated many researches develop various methods to prepare SFM, such as phase separation, emulsion-solvent evaporation method, electrostatic spraying, spray drying and self-assembly [17–21]. However, the barriers that the microsphere prepared with complex process and chemical or toxicant agents hinder its application in the medical field of drug release. To overcome the drawbacks, electrostatic field was employed to assemble the SFM without chemical agents [22]. Under electric fields, the silk fibroin molecules were drafted and assembled into nano or microspheres. Although this approach meets a friendly mild need of the SFM preparation, the challenges of time-consuming, the low productivity and non-uniform size of SFM still remained.
As a protein solution, the pH value of silk fibroin aqueous can be adjusted near its isoelectric point (pI) to accelerate the self-assembly process of silk fibroin molecules [1, 23]. In this study, we hypothesis that charge disappearance inters and inners of the silk proteins would be beneficial to silk fibroin molecule chains aggregation combining electric field force drafting. We adjusted the pH value of silk fibroin solution near its isoelectric point under a low electrostatic field. The satisfactory distribution of the SFM was optimized via controlling its concentration as well. More remarkably, the combination of ease fabrication and α-helix structure enrich of those SFM allowed the use of conformation transition to regulate its drug release and degradation furtherly, determined by scanning electron microscopy(SEM), fourier transform infrared spectroscopy(FTIR), x-ray diffraction(XRD). These new systems provided an approach and substitute for biomaterial and healthcare applications.
2. Materials and Methods
2.1. Purification of aqueous silk fibroin
Bombyx mori silk cocoons (Suzhou, China) were degummed by the established procedure described previously [24]. Briefly, Bombyx mori silk cocoons were boiled three times in 0.05 wt % Na2CO3 for 30 min to remove silk sericin, rinsed thoroughly with deionized water, and then dried in an oven overnight. Degummed silk was dissolved in 9.3 M LiBr solution, by stirring at 60 °C for 2 h. The resulting SF solution was then dialyzed against distilled water for 3days to remove LiBr. The deionized water refreshed every 1 h on the first day, and every 2 h on the last two days. After being filtered, the solution was centrifuged at 100 00 rpm for 3 min at 4 °C. 6 wt% pure silk fibroin solution was obtained and stored at 4 °C for further use.
2.2. Preparation of silk fibroin microspheres
The SF solution was diluted with deionized water to 0.1, 0.2, 0.3, 0.4, 0.6, 1.0 (wt%) concentration, and the pH value of the SF solution was adjusted to near its pI(≈4.2) by HCl (Sigma Aldrich, Shanghai, China). Then, 24 V D.C. (E = 120 V m−1) was applied to a pair of conductive electrodes device, and the process electrodes were immersed in SF solution. After 30 min, a visible granular aggregate formed at the positive electrode was harvested for further investigation, and the SFM was prepared after freezing at −80 °C for 6hs and freeze-drying for 48 h, as shown in figure 1.
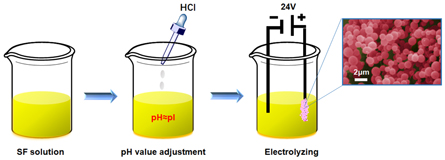
Figure 1. The schematics for process of silk fibroin microspheres.
Download figure:
Standard image High-resolution image2.3. Characterization of SFM
The morphology of SFM was observed by using a scanning electron microscope (SEM, S4800, Hitachi, Japan) at an operating voltage of 20 kV. The microspheres were mounted on a copper plate and sputter-coated with a gold layer of 20–30 nm thickness prior to imaging.
The secondary structure of the SFM was analyzed by attenuated total reflection-fourier transform infrared spectroscopy (ATR-FTIR) [25]. ATR-FTIR spectra were obtained in the range of 400–4000 cm−1 with an accumulation of 64 scans and a resolution of 4 cm−1 on with a VERTEX 70, each sample measured for three times.
X-ray diffraction was usually applied to determine crystalline structures in silk materials [26]. Herein, x-ray diffractions of various SFM were obtained with Ni-filterd Cu-Kα radiation (λ = 0.154 18 nm) from Empyrean (PANalytical B.V.). And diffraction intensity curves with 2θ from 5° to 45° were obtained.
The particle sizes of SFM were measured by Nano Measurer analysis software (Department of Chemistry, Fudan University, Shanghai, China) based on the image of SEM. And the average diameter and different particle size distribution of the samples was calculated by the software (Sigma scan, USA).
2.4. Loading and release of drug
Drug loading of the SFM conducted by rhodamine B (Sigma Aldrich, Shanghai, China) as a model drug. 30 ml silk protein solution was mixed with a model drug (0.03 mg, Wo). Silk fibroin solution with 0.3 wt%, 0.6 wt% and 1.0 wt% were selected to evaluate drug release of SFM, due to significant difference in the release results. 0.2 and 0.4 wt% silk fibroin solution were not used for it because of its small concentration gradient. The mixture solution was prepared to fabricate SFM, after 30 min under the low voltage electrostatic field, the visible granular aggregate on the positive electrode was harvested and washed with deionized water, which would be centrifuged for 10 min at 5000r/min and analyzed for residual drug content with UV–vis spectrometry. Standard calibration curves for model drugs were used for drug quantification [14]. A control group of samples containing 30 ml silk fibroin solution was prepared for each experiment to calculate the content of SFM. Drug concentrations of control and sample supernatants were used to calculate the amount of drug incorporated in the silk particles (Wm). All experiments were performed for four times. Encapsulation efficiency (EE) was determined using the following equation (1).

The drug loaded SFM was immersed into a screw-capped tube with 15 ml PBS (pH7.4) solution, which then was placed horizontally in a 37 °C-orbital shaker (HZQ-F160, Harbin, China). At different time points, 2 ml release medium in the tube was collected for UV absorbance analysis and the system was replaced with 2 ml fresh medium. The drug release amount was determined by calculation equation (1).
3. Results and discussion
3.1. Morphology of SFM
SEM pictures in figure 2 revealed that SFM was produced from electrostatic assembly system. When the pH value of the SF solution was adjusted near its pI, the SFM was fabricated quickly in 30 min under low-voltage electric field. This technique enhanced process efficiency of the SFM compared with low-voltage electric field only (about 2–4 h) [22]. Obviously, the shape of particles presented spherical, and the size of SFM increased with increasing of the SF initial concentration. As the concentration increases, the SFM gathered more closely, which contributed to the microspheres assemble. The size of the microspheres prepared by high concentration of SF solution is more uniform compared with that of low concentration.
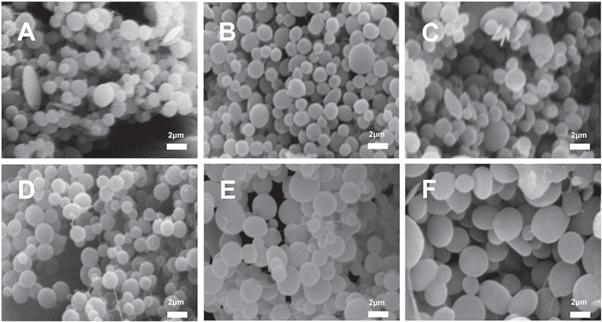
Figure 2. SEM (A)–(F) micrographs of SFM. (A)–(F) were derived from 0.1, 0.2, 0.3, 0.4, 0.6, 1.0 (wt%) SF concentrations, respectively. Scale bar: 2 μm.
Download figure:
Standard image High-resolution image3.2. Structural analysis of SFM
ATR-FTIR spectra analysis was carried out to characterize SFM fabricated from LiBr system [27, 28]. Protein characteristic peaks can be found at different distinguishable vibration absorption bands ranges relating to amide groups. The absorption bands at 1610–1630cm−1 (amide I) and 1510–1520 cm−1 (amide II) are characteristic of β-sheet structure, and 1648–1554 cm−1 and 1235 cm−1 (amide I) are indicative of random coil structure, and 1640 cm−1, 1535 cm−1 indicating of a-helix structure. Consequently, the SFM showed one strong peak at 1643 cm−1 and medium peak at 1535 cm−1 in amide I band, corresponding to a-helix structure, and another peak at 1514 cm−1 revealed β-sheet structure. These results suggested that the molecular conformations in SFM fabricated via in electrostatic assemble enriched a-helix structure with portion of random coil and β-sheet structure (figure 3(a)).
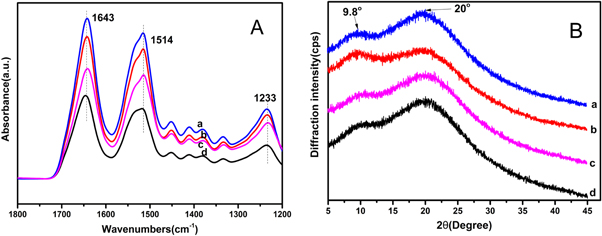
Figure 3. FTIR-ATR (A) and XRD(B) spectra of SFM. (a)–(d) were fabricated from 0.1, 0.3, 0.6, 1.0 (wt%) SF concentration, respectively.
Download figure:
Standard image High-resolution imageX-ray diffraction patterns of SFM have shown in figure 3(b). According to previous studies [29, 30], the main diffraction peaks of the silk I crystal occur at 12.2°(d = 7.25 Å, medium strong), 19.7° (d = 4.5 Å, strong), 24.7° (d = 3.60 Å, medium), and 28.2° (d = 3.16 Å, medium), and the silk II occur at 9.1° (d = 9.7 Å, medium strong), 18.9° (d = 4.69 Å, medium strong) and 20.7° (d = 4.30 Å, very strong). Consequently, the XRD curves showed a broad peak at 20°, and a weak peak at 9.8°, which indicated that condense structure of SFM was crystalline and amorphous coexistence. Silk I was mainly crystalline structure in the SFM, which was consistent with the ATR-FTIR data. Based on electrostatic assembly system, SFM was fabricated and contained mainly silk I and a little silk II crystal. This SFM enriched silk I allowed to regulate its drug release behavior and degradation properties further due to its metastable structures (α-helix and random coil).
3.3. Particle size analysis of SFM
It is obvious that the mean diameter of SFM raised with the increase of silk fibroin concentration (figure 4). Especially, the diameter of SFM increased remarkably with the concentration over 0.3 wt%. Silk fibroin molecules have more chances to close and aggregate in higher concentration solution, which means more microcells and particles formed. Further, microcells were grafted and assembled into nano or microspheres by electrostatic interactions under electrostatic field. The large size of microsphere will be hampered its application in biomedicine field at a certain extent, thus it is insufficient to control the size of SFM by concentration only. The distributions of SFM were revealed by the data in table 1, from the statistical point of view, the size distribution of SFM has not increased but improved with the increase of SF concentration. There was no doubt that pH value adjustment has a profound effect on preparing SFM. When the pH value is adjusted to about 4.2(pI), the negative charge in the preparation system of SFM decreased or disappeared and weaken electrostatic repulsion, which contributed to the complex and tight structure of SFM (figure 6, Route i). However, the chance for microcell assembling into microsphere decreased markedly in low concentration. These results were beneficial to tight and complex structure of SFM which would improve their size and distribution. Therefore, it was effective to prepare and improve the characters of SFM by electrostatic field and pH value adjustment.
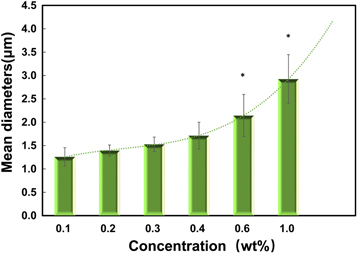
Figure 4. Average diameter of SFM as a function of protein concentration. Error bars indicate the width of the size distribution (P < 0.05, n = 5).
Download figure:
Standard image High-resolution imageTable 1. Average diameters and size distribution of SFM fabricated by different silk fibroin concentration.
| Concentration(wt%) | 0.1 | 0.2 | 0.3 | 0.4 | 0.6 | 1.0 |
|---|---|---|---|---|---|---|
| Average size(μm) | 1.468 | 1.496 | 1.553 | 1.769 | 2.143 | 2.924 |
| Distribution | 0.341 | 0.379 | 0.379 | 0.410 | 0.451 | 0.524 |
Values are average ± standard deviation (n = 50).
3.4. Drug loading and release
To investigate the drug loading of the SFM, rhodamine B was used as preferential drug for strong fluorescence and with a large molar absorptivity [31]. From the table 2, there is a significant difference of loading performance for different SFM with different concentrations. The SFM encapsulation efficiency improved slightly. During the aggregation process of SF microcell, SF molecules tend to intertwine closely resulting to encapsulate more tightly for drug based on the influence of pH value. With the microcell assembled into microsphere, drug would be further encapsulated or absorbed, which resulted in a good encapsulation efficiency and a potential of durable release process.
Table 2. Rhodamine B encapsulation efficiency of SFM Samples.
| SF concentration (wt%) | 0.3 | 0.6 | 1.0 |
|---|---|---|---|
| Encapsulation efficiency(%) | 31.22 ± 1.67 | 39.75 ± 3.28 | 47.56 ± 7.49 |
Values are average ± standard deviation (n = 5).
The release profile (figure 5) of rhodamine B revealed that a more prolonged release process was possessed in SFM with low concentration. The initial burst about 10% is lower than that of SFM prepared in high concentration, which would reduce the harmful stimulation of wounds. Compared with a long release process, the SFM with low concentration presented a short sustainable release behavior in case the body depends on drug too much [32]. At first 20 hs, the cumulative release ratio of the SFM reached to approximately 50% drug in SFM. Additionally, SFM with high concentration presented a high cumulative release ratio because of its complex release process that allowed drug to detach rapidly from the SFM surface and escape easily from microcell. (figure 6, Route ii)

Figure 5. Cumulative rhodamine B release from SFM. (a)–(c) SFM derived from 0.3, 0.6, 1.0 (wt%) SF concentration (n = 5, P < 0.05).
Download figure:
Standard image High-resolution image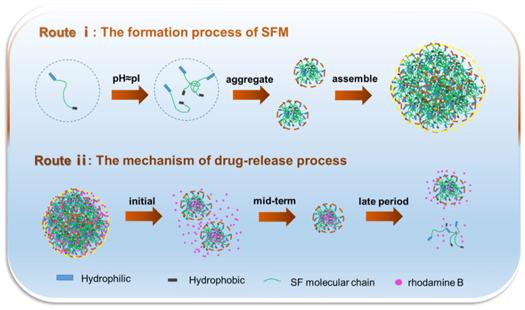
Figure 6. The formation process of SFM (Route i) and the mechanism of drug-release process of SFM (Route ii).
Download figure:
Standard image High-resolution image
4. Conclusion
In this study, SFM was prepared with high productivity by easy-handle process. Diameter of the SFM was controlled range from 0.5 μm to 3 μm and concentration-dependent by combining low electrostatic field with pH value adjustment. The shape of the SFM showed homogeneous morphology. Interestingly, the secondary structure of the SFM showed mainly α-helix and a little β-sheet structures detected by ATR-FTIR and XRD. Drug release results showed that cumulative release ratio of the SFM was about 75% in 5 days, which provided a promise possibility that drug taken up prolonged residence time at the site of application and caused intimate-contact with the absorption site and produced better therapeutic. This study developed a new system to fabricate silk microspheres that would apply in biomedical field.
Acknowledgments
This work was supported by the Nature Science Foundation of Hubei Province, China (2017CFB578, 2018CFB663), National Nature Science Foundation of China (51303141, 51403163, and 31600774).