

Abstract
Two dimensional (2D) layered magnetic materials have obtained much attention due to their intriguing properties with a potential application in the field of spintronics. Herein, room-temperature ferromagnetism with 0.2 emu g−1 magnetic moment is realized in Fe-doped ZrS2 single crystals of millimeter size, in comparison with diamagnetic behaviour in ZrS2. The electron paramagnetic resonance spectroscopy reveals that 5.2wt% Fe-doping ZrS2 crystal exhibit high spin value of g-factor about 3.57 at room temperature also confirmed this evidence, due to the unpaired electrons created by doped Fe atoms. First principle static electronic and magnetic calculations further confirm the increased stability of long range ferromagnetic ordering and enhanced magnetic moment in Fe-doped ZrS2, originating from the Fe spin polarized electron near the Fermi level.
Export citation and abstract BibTeX RIS
1. Introduction
Diverse applications of spintronics especially in the information storage, and transport processing have attracted significant interest of researchers from academic as well as industrial point of view. Dilute magnetic semiconductors (DMS) have shown promising features towards fabrication of nanoscale spintronics devices. Such kind of materials can work at room temperature due to their unique structures and rich electronic properties. However, to develop suitable low-dimensional materials with room-temperature ferromagnetism still remains an immense challenge. Doping in semiconductors with magnetic elements to acquire materials has been studied since last few decades, such as low temperature ferromagnetic DMS [1–3]. However, the continuous efforts are being made to fabricate DMSs with room temperature ferromagnetism [4–9].
On the other side, 2D layered TMDCs materials have found enormous research interest owing to distinctive physical, electrical, catalytic properties as well as for thin transparent semiconductors applications [10–17]. TMDCs with general formula MX2 have been studied both experimentally and theoretically for various applications, where M is a transition metal typically from groups IV-VII, and X is a chalcogenide such as S, Se, or Te [18–28]. With rich electronic structures and possible band gap engineering, these 2D materials are pervasive for fabricating spintronic devices. Particularly, excellent optical properties in 2D layers make them a promising candidate for transparent spintronics devices. Most recently, room-temperature ferromagnetism was reported in a few MX2 bulk and monolayer phases [29–31]. In fact, the existence of room temperature ferromagnetism in MoS2 was ascribed to vacancy and zigzag edges. Several attempts have been also made for the fabrication of DMSs by applying tensile strain [32, 33] and by incorporating magnetic elements such as Mn, Co, Fe, Ni or Cr [34–38]. Among various 2D materials, layered zirconium disulfide (ZrS2) have superior optical and electrical properties [13, 39–42]. However, the magnetic property of ZrS2 such material was rarely reported might due to the lack of ideal crystal objects. Herein, we adopted a chemical vapor transport (CVT) method to successfully prepare high quality ZrS2 and Fe-doped ZrS2 single crystals of millimeter size. Further, our magnetic measurement results reveal that the diamagnetic character of ZrS2 can be changed to room-temperature ferromagnetic nature after doped Fe atoms, which is further confirmed by first principle calculations.
2. Results and discussions
The optimized chemical vapor transport CVT synthesis technique was used to synthesize ZrS2 and Fe-doped ZrS2 single crystals. The synthesis process and transport reactions were carried out in silica tubes as shown in figure 1. The detail of the experiments is available in the experimental section of supporting information is available online at stacks.iop.org/MRX/5/046110/mmedia. After successful growth of the single crystals, different techniques were used were characterized the as grown samples.
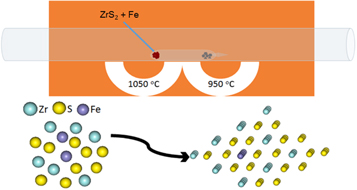
Figure 1. Schematic configuration of chemical vapor transport (CVT) synthesis of Fe-doped ZrS2 single crystals.
Download figure:
Standard image High-resolution imageX-ray diffraction (XRD) patterns were employed to probe the crystalline phase of the as-grown samples. Figure 2(a) shows the typical XRD results of ZrS2 and Fe-doped ZrS2 crystals. It reveals that the crystal parameters and lattice planes are well matched with the standard diffraction data of ZrS2 (JCPDS 11-0679). As comparison, the peaks (003), (110) and (004) show a slight shift to higher diffraction angles after doping Fe doped into ZrS2 (also see figure S1 of supplementary), while the (103) peak was suppressed with Fe incorporation. The slight shift can be ascribed to the larger ionic radii of Fe (Fe2+) as compared to Zr (Zr4+) [43]. Similar results were reported previously in 2D TMDCs with transition metals doping [38, 44]. The energy dispersive X-ray spectroscopy (EDS) further confirms the existence of Fe, Zr and S in the grown samples. Notably, a low intensity oxygen peak is also observed due to slight surface oxidization. The inset camera image represents large size of as-grown ZrS2 and Fe-doped ZrS2 crystals. The actual concentration of Fe, Zr and S were estimated by inductively coupled plasma mass spectroscopy (ICP-MS) measurements, which suggest approximately 5.2%wt of Fe in Fe-doped ZrS2 (as shown in table S1 of supplementary). The Raman spectra for ZrS2 and Fe-doped ZrS2 crystals were performed in order to study their vibrational modes (as shown in figure S2 of supplementary). For ZrS2, the in-plane vibration mode (Eg) is observed at 246.78 cm−1 and the out of plane mode (A1g) at 332.23 cm−1. The Eg and A1g modes for Fe-doped ZrS2 appear at 257.5 and 343.43 cm−1, which are slightly shifted in comparison with ZrS2. The Raman shifting is a result of bond length shortening due to Fe substitutions, similar to other doped materials [45].
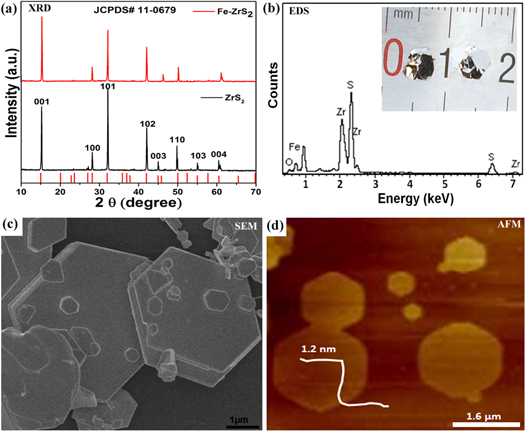
Figure 2. (a) X-ray diffraction (XRD) patterns equipped with (λCu-Kα = 1.5406 Å) for as-grown ZrS2 and Fe-doped ZrS2 crystals. (b) Energy dispersive X-ray spectra (EDS) of as grown Fe-doped ZrS2. Inset: Photo camera image of as-obtained ZrS2 (left) and Fe-doped ZrS2 (right) crystals. (c) SEM and (d) AFM images of Fe-doped ZrS2 crystals.
Download figure:
Standard image High-resolution imageThe scanning electron microscopy (SEM) was used to investigate the morphology of the samples by grinding large crystals into small size. The typical SEM image in figure 2(c) shows hexagonal morphology of Fe-doped ZrS2, with no big change as compared to pure ZrS2. The layered structure of Fe-doped ZrS2 crystal is confirmed by a closer view of the edges (as shown in figure S3(a) of supplementary). Atomic force microscopy (AFM) was used to measure the thickness of samples after exfoliating and depositing them on silicon substrate. It can be seen from figure 2(b) that the exfoliated nanoflakes exhibit a thickness of 1.2 nm, indicating the presence of bilayer Fe-doped ZrS2 [46, 47]. Some particles are observed on the surface of Fe-doped ZrS2 sample, which might due to the surface absorption of oxygen with Fe atoms.
X-ray photoelectron spectroscopy (XPS) was performed to identify the chemical states and composition of as-synthesized ZrS2 and Fe-doped ZrS2 crystals. It is observed from figure 3 that Zr 3d5/2 and 3d3/2 peaks are located at 182.7 and 184.8 eV (figure 3(a)), while S 2p3/2 and 2p1/2 at 161.4 and 162.5 eV (figure 3(b)). In comparison with pristine ZrS2, a minute shift of Zr 3d and S 2p in Fe-doped sample can be ascribed to the enhancement of valence states of Zr atom after Fe substitution. Figure 3(c) shows Fe 2p1/2 and 2p3/2 peaks at 711 and 724.5 eV, suggesting the presence of Fe2+ in the doped samples [4, 48].
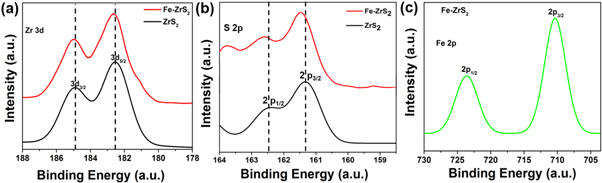
Figure 3. XPS analysis of as-synthesized ZrS2 and Fe-doped ZrS2 crystals. (a) Zr 3d (b) S 2p and (c) Fe 2p spectrum.
Download figure:
Standard image High-resolution imageIn order to figure out the local structure of ZrS2 after Fe doping, X-ray absorption fine structure spectroscopy (XAFS) was performed to detect the atomic structure of the grown samples (as shown in figure 4). Figure 4(a) exhibits the Zr K-edge X-ray absorption near-edge structure (XANES) spectrum for ZrS2 and Fe-doped ZrS2. It reveals that the curve of Fe-doped ZrS2 is shifting to higher energy due to surface oxidation of Fe. The corresponding Fourier transform (FT) spectrum of Zr k-edge in figure 4(b) reveal that the dominant bond is Zr-S for both samples, indicating the lattice remains same for ZrS2 after Fe doping. However, the decrease of oscillation amplitude in doped sample suggests the decrease of coordination number after Fe doping. Besides, the presence of Zr-O peak may suggest a slightly surface oxidization of Fe-doped ZrS2, which is agreeing with the strong oxidizing agent Fe in a free environment. To further detect the bonding state of dopants, Fe K-edge curves were recorded on Fe-doped ZrS2 sample in comparison with commercial FeS. The corresponding FT curves of the typical XAFS are comparably shown in figure 4(d). The characteristic peaks of Fe-S and Fe-Fe bonds strongly indicate the substitution position of Fe in doped ZrS2, agreeing with the above XRD and XPS results. Notably, small oxidation peak of FeO also appears in the doped sample due to the Fe-induced surface oxidization.
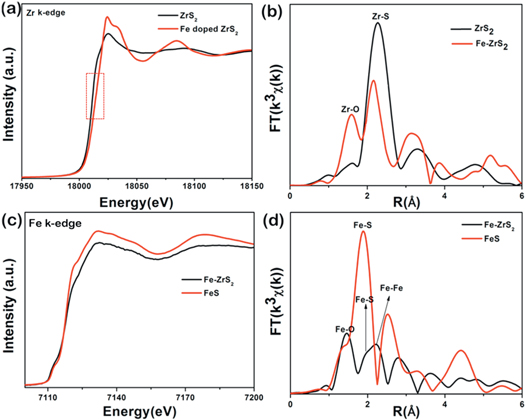
Figure 4. XAFS analysis of as-synthesized ZrS2 and Fe-doped ZrS2 crystals. (a) Zr k-edge XANES and (b) the corresponding Fourier transform (FT(k3χ(k))) curves in real space. (c) Fe k-edge XANES and (d) the corresponding FT(k3χ(k)) spectra for Fe-doped ZrS2 compared with commercial FeS sample.
Download figure:
Standard image High-resolution imageHigh-resolution transmission electron microscopy (HRTEM) was used to observe the microstructure, as shown in figure 5(a). It can be seen that the Fe-doped ZrS2 sample poses a regular hexagonal structure with a lattice-spacing of 0.30 nm corresponding to the (100) plane. The estimated other lattice plane distance of (102) plane is around 0.18 nm, which is matched with the above XRD results. The selected area electron diffraction (SAED) pattern in the inset of figure 5(a) shows a set of a diffraction spots. These results confirm that the doping Fe atoms do change the hexagonal structure and crystal lattice of ZrS2. Based on the structural analysis from XRD, XAFS and TEM, we build up an atomic model of Fe-doped ZrS2 in figure 5(b) with crystal parameters a = b = 3.67 Å and c = 5.03 Å. In this model, we suggest that Zr and Fe are octahedrally coordinated with six S.

Figure 5. (a) Typical HRTEM image of Fe-doped ZrS2. Inset: SAED pattern atomic arrangement with hexagonal image and inset marked hexagonal and trigonal shapes of Fe-doped ZrS2. (b) Structural model of Fe-doped ZrS2 (top view and side view of few layers with spacing d).
Download figure:
Standard image High-resolution imageThe electrical conductivity was measured on both samples. Figure 6 reveals that the resistivity decreases with increasing temperature for both pristine and Fe-doped ZrS2, which strongly confirms their semiconducting nature [49–53]. The room temperature resistivity is 3.23 kΩ and 32.18 kΩ for ZrS2 and Fe-doped ZrS2, respectively. Obviously, the conductivity of ZrS2 is increasing after Fe doping, similar to previous studies [54].
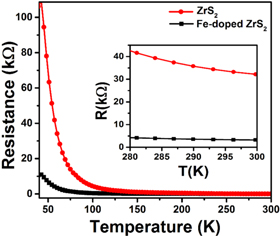
Figure 6. Temperature dependent electrical resistivity of ZrS2 and Fe-doped ZrS2.
Download figure:
Standard image High-resolution imageThe magnetic measurements were carried out on millimeter size single crystal of as-grown ZrS2 and Fe-doped ZrS2 by using a vibrating sample magnetometer (VSM). The magnetic hysteresis loops for ZrS2 shows diamagnetic response without coercivity curves at room temperature (see figure S4 in supplementary) [55–58]. In contrast, the M-H curves of Fe-doped ZrS2 in figure 7(a) shows a noticeable coercivity with a clear M-H loop, strongly indicating its ferromagnetic (FM) behavior at all tested temperatures. The inset of figure 7(a) further displays the saturation magnetization (MS) and coercivity curves at 100 K, 200 K, 300 K and 360 K, respectively. Similarly, the magnetic moment value of Fe-doped ZrS2 can reach up to 0.22 emu g−1 at 100 K, while the value of Ms at room temperature is around 0.2 emu g−1. In comparison with previous reports, the Ms value of Fe-doped ZrS2 is higher than any pure TMDCs materials [9, 42, 47, 48]. Figure 7(b) shows the magnified M-H loops of Fe-doped ZrS2 at 100 K, 200 K, 300 K and 360 K, respectively. The existence of sizeable coercivity curves is a strong and conclusive evidence for presence of FM state at all measured temperatures.
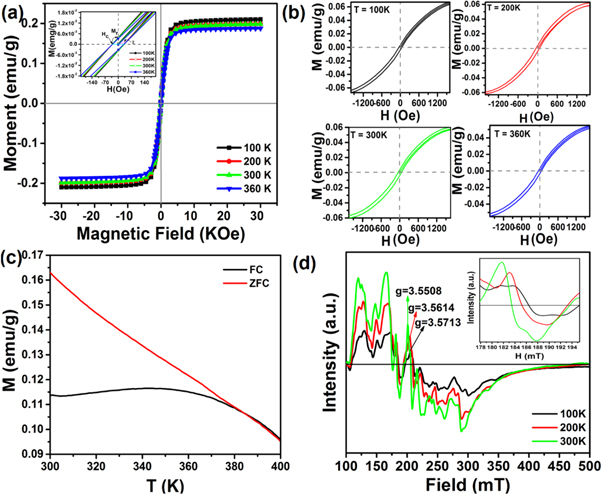
Figure 7. The magnetic evaluation for milimeter size Fe-doped ZrS2 single crystals. (a) M-H curves with an inset: magnified image of hysteresis loop wich shows remances, susceptibility and coercive force. (b) The magnified M-H loops at 100, 200, 300 and 360 K, (c) the ZFC and FC curves measured at 500 Oe and (d) EPR spectra.
Download figure:
Standard image High-resolution imageThe temperature-dependent magnetization behaviour of Fe-doped ZrS2 was measured through field-cooled (FC) and zero-field-cooled (ZFC) curves at the applied field of 500 Oe. The FC/ZFC curves in figure 7(c) reveal that the magnetization is very high at low temperature, while it decreases with increasing temperature. Furthermore it can be observe that there is no clustering throughout the measured range below the Curie temperature (TC), indicating typical FM characteristics. It is also estimated from FC/ZFC curves that the Curie temperature (TC) of Fe-doped ZrS2 is around 384.6 K. Similarly, electron paramagnetic resonance spectroscopy (EPR) was recorded on the Fe-doped ZrS2 with a constant frequency of 9 GHz at 100 K, 200 K and 300 K. The clear ferromagnetic signals in figure 7(d) are observed in Fe-doped ZrS2. Notably, the ferromagnetic resonance between 150 to 200 mT is shifted to lower resonance center magnetic field (Hcenter) with decreasing temperature from 300 K to 100 K. The value of magnetic coupling factor or g-factor (geff) is used to measure the magnetic moment of atoms from the EPR spectra by using the following equation [5];

where 'γ' is the frequency, 'h' is Planck constant, 'μB' indicating Bohr magnetron and Hcenter is the resonance magnetic field. The value of 'geff' is higher at room temperature as compared to the lower temperature, indicating strong spin-orbital moments at room temperature, as shown in the inset figure 7(d). These observations further prove the room temperature FM nature in Fe-doped ZrS2 single crystals.
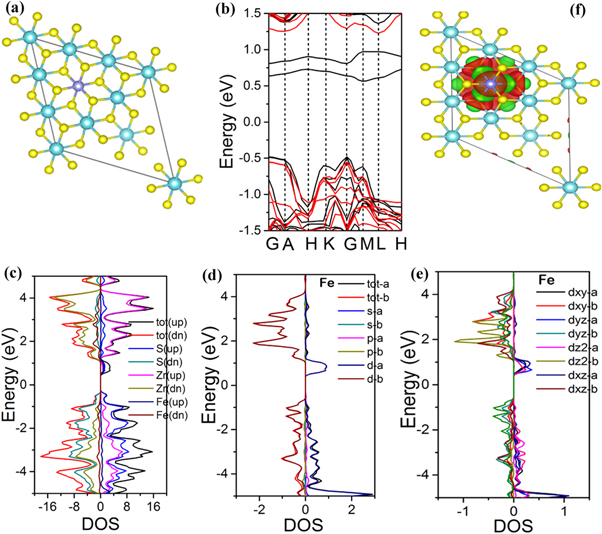
According to recent studies [59, 60], the ferromagnetic ordering behavior in Fe-doped ZrS2 may be originated from the interchange relationship among the Fe doped atoms at the interlayer sites, which generate spin-polarized carriers. Because of large size single crystal of our tested sample, it can rule out the side effect from impurities, surface defects or zigzag edges. To further understand the ferromagnetic behavior, first-principles spin-polarized calculations based on density functional theory (DFT) were performed to get further insight the electronic and magnetic properties of Fe-doped ZrS2. The detail of calculations can be found in supporting information. A 2 × 2 × 1 unit cell of ZrS2 was constructed with one Zr substituted by one Fe atom similar to the experimental data, as seen in figure 8(a), to study its electronic properties. Similarly, for long-range FM ordering coupling a 3 × 3 × 1 supercell with two Fe atoms has been tested for total energy calculations. After the total magnetic energy calculations, we find that the antiferromagnetic state is less stable than the ferromagnetic state, with a magnetic energy difference ΔE (ΔE = EFM – EAFM) of −0.21 eV. The total energy calculations depicts that the FM coupling is energetically more favorable than the AFM coupling in Fe-doped ZrS2. This kind of magnetic coupling behavior has also been theoretically investigated in previous reports [37, 61]. The magnetic moment of iron atom per unit cell is 2 μB, while the magnetic moment of a sulfur atom occupying S 3p states bonded by Fe atom yielded a negligibly small magnetic moment (less than 0.035 μB). Table S2 also shows the magnetic moments for both pristine and Fe-doped ZrS2, with a leading total magnetic moment of about 2.7 μB for Fe-doped ZrS2. The calculated magnetic moment value is closely related to experimental value of 2.0 μB at room temperature.
Figure 8. (a) Atomic structure configurations for DFT simulations based on the experimental data. (b) The calculated band structure, (c) projected density of states, (d) Fe different orbitals and (e) Fe d-orbitals in Fe-doped ZrS2 using HSE06 functional potential. (f) the calculated Isosurface plot of spin charge densities distribution (ρup–ρdown) of Fe-doped ZrS2 with Isosurface value of 0.004 e/Å of iron along the plane (001).
Download figure:
Standard image High-resolution image
The detail calculations of electronic band structures, projected density of states (PDOS) and spin charge density of ZrS2 and Fe-doped ZrS2 are shown in figure 8 (also see figure S5). It is found that ZrS2 is a diamagnetic semiconductor with an indirect band gap of 1.43 eV, showing symmetric behavior in both spin-up and spin-down. In contrast, the calculated band structure in figure 8(a) clearly shows two spin-polarized impurity states after Fe substitutions. The impurity levels within the bandgap above the Fermi level come from Fe atom rather than Zr atoms. Our PDOS calculations in figure 8(b)–(d) indicate that the valence band maximum (VBM) and conduction band minimum (CBM) are mainly contributed by S's p, Zr and Fe's d orbitals. The calculated DOS in figure 8(c) suggests that the Fe-doped ZrS2 can exhibit the spin-polarized carriers near the Fermi level. The significant asymmetry between the spin-up and spin-down channels can endorse the ferromagnetic evidence in Fe-doped ZrS2. Similarly, figure 8(d) shows the PDOS of different electronic states of all Fe-orbitals with noticeable asymmetry. Moreover, figure 8(e) illustrates the Fe 3d orbitals with a higher spin asymmetry, providing the primary contribution of magnetic moment and spin orbit coupling near the Fermi level. In addition, figure 8(f) demonstrates the spin charge distribution isosurface plot of the given structure in figure 8(a). It is obviously show that the plotted spin-charge density is mainly localized around Fe atom. The red and green isosurface areas represent the spin-up and spin-down charge density of Fe atom. Large spin-charge densities are localized around Fe spin-up state with increased charge distribution. In comparison, the less S spins meet one Fe atom of large spins, the antiferromagnetic coupling and spin states between S and Fe atoms leads it to an effective ferromagnetic (FM) state for the whole Fe spins. Therefore, these computational results clearly suggest that the doping of Fe into a diamagnetic semiconductor ZrS2 can induce ferromagnetic character, which may open up a facile way to tune intrinsic magnetic property for various 2D materials.
3. Conclusion
In summary, the electronic and magnetic properties of large size ZrS2 and in situ Fe-doped ZrS2 single crystal were studied experimentally combined with DFT calculations. Our characterizations revealed that microstructure and chemical structure of ZrS2 were not largely affected, while the intrinsic magnetic properties were dramatically changed after Fe doping. In particular, pristine ZrS2 exhibited diamagnetic semiconducting character, whereas Fe-doped ZrS2 showed distinct ferromagnetic semiconducting behavior. This study suggests that magnetic elemental dopant in 2D materials may be a new way for realizing room-temperature dilute magnetic 2D semiconductors with significant potential applications in multifunctional devices and future nanoelectronics.
Acknowledgments
This work is financially supported by NSFC (U1532112, 11574280, 11605201), CAS Key Research Program of Frontier Sciences (QYZDB-SSW-SLH018), CAS Interdisciplinary Innovation Team and Innovative Program of Development Foundation of Hefei Center for Physical Science and Technology (2016FXCX003). Z M acknowledges the CSC (Chinese Scholarship Council) Program. We thank the Hefei Synchrotron Radiation Facility (ARPES, and Photoemission Endstations at NSRL), the Beijing Synchrotron Radiation Facility (1W1B and soft-X-ray endstation, BSRF), and the USTC Center for Micro and Nanoscale Research and Fabrication for helps in characterizations.