
Abstract
Electronic, structural and elastic properties of fresnoite,  (BTSO), are obtained via first principles calculations. The electronic properties having been comparatively analysed using both the generalised gradient approximation and the hybrid functional method. The indirect band gap of BTSO is found to change significantly through the choice of functional; it shows an increase from 3.79 eV to 5.72 eV. A small indirect gap of 0.33 eV is also present directly above the conduction band edge, which allows for small optical transitions similar to that of defect transitions. The titanium orbitals are dominant near the conduction band edge, with oxygen orbitals being the main contributor to the valence band edge. Dielectric and elastic properties of the material are also obtained, with the bulk modulus being 131.73 GPa and the elastic moduli along the [1 0 0] and [0 0 1] directions being 180.57 GPa and 102.56 GPa, respectively. Theoretical values for Raman frequencies are reported for BTSO. Finally, Bader charge analysis reveals the barium and titanium atoms in BTSO are comparable to their charges in
  . However, due to the presence of the Si–O bonds, oxygen exhibits a significant charge redistribution. Through the choice of functional, charge can become more localised on the oxygen atoms.
Export citation and abstract BibTeX RIS

Original content from this work may be used under the terms of the Creative Commons Attribution 3.0 licence. Any further distribution of this work must maintain attribution to the author(s) and the title of the work, journal citation and DOI.
1. Introduction
Due to its high permittivity (up to 5000 at 1kHz) [1, 2],  (BTO) is seen as a material with great potential for device applications, such as capacitors [3], energy storage devices [4], phased array radar [5] and random access memory [6]. Recent literature has looked into the potential to form composites that can exhibit both the high permittivity found in BTO whilst also displaying the low dielectric loss of materials such as silica,
  (SO) [7–9]. To this end, BTO/
 core-shell composites have recently been made that exhibit the high breakdown voltage of
  whilst maintaining the colossal permittivity of the BTO [10–12], giving them greater promise for use in supercapacitors. However, it has been shown that, during growth, a layer of fresnoite,
  (BTSO), forms across a diffusion length into either material at the interface [13, 14]. These core-shell structures have been shown to exhibit both desired properties experimentally, yet theoretical studies of BTO/SO interfaces do not mirror these results [15, 16]. BTO/BTSO interfaces are, therefore, potentially responsible for the properties of such a structure. Furthermore, as many manufacturing processes for BTO involve growth on silica wafers, intermediate fresnoite layers can form during the process [13]. Clearly the properties of BTSO needs to be understood before the interface can be explored.
Successful growth of large BTSO crystals, as well as the characterisation of its piezoelectric and dielectric properties were reported in the 1970s [17]. BTSO has the space group P4bm, experimental lattice parameters of  Å and
Å and  Å, and displays a melting temperature of 1445 °C [18]. The tetrahedral TiO5 structure present in fresnoite makes it highly polar [19], causing it to exhibit piezoelectricity [20, 21], nonlinear optical properties [17, 22] and ferroelectricity [23]. Due to the highly polar structure, modelling surfaces of fresnoite becomes rather challenging as most potential cleavage planes form non-stoichiometric and charged surfaces. For modelling purposes, this creates a net electric field across the structure, which is unphysical.
In order to fully understand the electronic and elastic characteristics of materials [24], such as BTSO, density functional theory (DFT) calculations are necessary. Very little literature is currently available on first principles calculations for BTSO, with only one paper partially exploring its electronic properties via the generalised gradient approximation (GGA) in DFT [25]. It is therefore unclear whether such results can be fully reliable as it is well known that GGA significantly underestimates the band gap of semiconductors, as well as electron localisation [26]. Our choice of the Heyd–Scuseria–Ernzerhof (HSE06) hybrid functional [27] is due to its improved accuracy for electron localisation and band gap values [26]. An alternate approach would be to consider GW calculations, however, it has been recently shown [28–30] that for systems without a defect, HSE06 calculations accurately capture the bulk properties as effectively as GW calculations, for a lower computational cost. Hence our approach here is focused on application of HSE06.
In this work, we perform ab initio first principle calculations on the bulk fresnoite structure. We study the electronic properties, comparing GGA and hybrid functionals and their effects on the band structure, band gap and charge distribution. We also present the bulk elastic properties and the Raman modes to investigate the stability criteria of fresnoite. For the elastic properties, we compare and contrast with the properties of BTO and SO.
2. Methodology
First principles calculations are performed using the plane-wave DFT software package VASP [31–33]. The Perdew–Burke–Ernzerhof (PBE) [34] and projector-augmented-wave method [35] is used for GGA calculations. For hybrid DFT calculations, the HSE06 method [36] is applied. The valence electrons for each atomic species are considered as follows: 5s25p66s2 for Ba, 3s23p2 for Si, 3p63d44s2 for Ti and 2s22p4 for O.
In order to optimise the structure of BTSO, the internal atomic coordinates are fully relaxed using PBE-DFT until the residual Hellmann–Feynman forces acting on every atom became smaller than 0.01 eV  . The theoretical lattice constants are then found for both PBE and HSE06 whilst maintaining the experimental ratio of
  , which is done to better compare with experimental data. The structural optimisation was carried out using an energy cutoff of 600 eV and a
  Monkhorst–Pack k-point mesh [37]. To better understand the localisation of electrons within fresnoite, Bader charge analysis [38] is performed on BTSO and BTO using both functionals.
For the calculation of the dielectric and elastic tensors, as well as the Raman frequencies of the fresnoite structure, a higher accuracy is required. An energy cutoff of 650 eV, as well as an improved force convergence of 0.0002 eV Å−1. is used along with a  Γ-centred Monkhorst–Pack k-point mesh to sample the Brillouin zone for these calculations, which are obtained through use of density functional perturbation theory (DFPT) [39, 40] using the PBE functional for the Raman and dielectric properties and the finite difference method [41] using PBE for the elastic properties.
Figure 1 displays the crystal structure of BTSO. Ba and Si are in Wyckoff position  , whilst Ti is in
  . Whilst the other atomic species each display only one type, oxygen displays four distinct types (see Supplementary materials), with O(1) in Wyckoff position
  , O(2) in
  , O(3) in general
  and O(4) in
  .
.

Figure 1. The crystal structure of  seen from (a) the [0 0 1] and (b) [1 0 0] planes, with the unit cell being outlined in both. The TiO5 pentahedrons and SiO4 tetrahedrons are highlighted, where O(4) and O(2) are located at the bottom of them, respectively.
Download figure:
Standard image High-resolution image3. Results and discussions
3.1. Mechanical properties
The elastic properties of fresnoite are presented in table 1. The tetragonal structure of BTSO breaks symmetry between the  and
and  elastic constants. We find that our results agree well with the experimental values for direct deformation. From figure 2, one can extract the bulk modulus, B, through use of the equation

where V is volume, E is energy and V0 is the volume at zero pressure. In this case, the value of 131.73 GPa is obtained for the single crystal. This value lies between that of BTO (175 GPa) [42] and quartz silica (37.2 GPa) [43, 44]. Values for polycrystalline elastic moduli can also be obtained from the elastic tensor via the Voigt–Reuß–Hill approach [45]. For BTSO, we find values of the bulk, shear and Young's moduli are 85.06 GPa, 35.57 GPa and 94.60 GPa, respectively. For single-phase BTO, we show a Young's modulus of 247 GPa, in good agreement with literature [46]. From these results, we see find that polycrystalline BTSO is more flexible than that of BTO. The difference between the two values of bulk modulus for BTSO are due to the difference between single crystal and polycrystalline structures. The bulk modulus shows that the system becomes more susceptible to deformation when under pressure with increasing SO content. The mechanical stability of a system is defined using the Born stability criteria [47]. The elastic constants (Cij), presented in table 1, show the system is stable, according to these criteria.
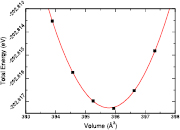
Figure 2. Calculated results using the PBE functional of the total energy versus volume for fresnoite  .
.
Download figure:
Standard image High-resolution imageTable 1. Theoretical and experimental elastic moduli,  (in units of GPa) for
  ,
,  and quartz
  . Where the elastic constants are defined in their usual notations.
 |
 |
 |
 |
 |
 |
|
|---|---|---|---|---|---|---|
 |
180.57 | 84.06 | 45.25 | 102.56 | 23.47 | 66.74 |
 |
165.5 | 57.7 | 43.6 | 99.9 | 31.7 | 69.4 |
 |
280.52 | 102.65 | 101.34 | 271.62 | 120.23 | 120.76 |
 |
81.1 | 8.3 | 7.5 | 104.8 | 49.7 | 36.4 |
aThis work, calculated using PBE bExpt. [22] cLocal density approximation [48].
By comparing the value of  for BTSO to that of BTO and SO, the elasticity along the [1 0 0] direction is found to be the average of the two. Whereas, for the elasticity along the [0 0 1] direction, we find fresnoite to be lower than that of both BTO and SO; through the inclusion of Si and O in BTSO, the direct deformation in the [0 0 1] direction becomes close to the value found in pure SO.
The O(4)–Ti–O(3) bond angles are found to be 106.4°, whereas the O(2)–Si–O(3) and O(2)–Si–O(1) bond angles are 115.4° and 110.7°, respectively. In comparison, the bond angle for O(3)–Ti–O(3) in BTO is  , and the angle for O(3)–Si–O(3) is
  in quartz silica. The larger Ti–O bonding angle found in fresnoite suggests that the Si–O bonding is dominant; whilst the larger Si–O bonding angle than in SO is likely caused by the large ionic Ba–O bonds in fresnoite.
Phonon frequencies for BTSO are calculated at the Γ–point and show no imaginary modes, thus demonstrating the system to be dynamically stable. All Raman-active modes are displayed in table 2. Through factor group analysis, BTSO is shown to have 47 Raman-active modes, split into 11A1, 6B1, 10B2 and 20E modes, where the 20 E modes are doubly degenerate. The strongest peak exhibited in Raman spectra, found at around 876  [49, 50], is found in our analysis. We see good agreement in the vibrations that give rise to these modes. For example, the bands between 600–700
  are due to Si–O(1)–Si stretching; whereas the bands between 800–925
  are due to SiO3 stretching. We find that two bands around 854
  are due to symmetric and antisymmetric stretching of the Ti–O(4) bonds. Bands are found at 864
  and 890
  that correspond to symmetric and antisymmetric stretching modes of the SiO3 groups.
Table 2. Raman-activate phonon frequencies ( ) for
) for  . Calculated using PBE.
| Mode number | A1 | B1 | B2 | E |
|---|---|---|---|---|
Frequency ( ) ) |
||||
| 1 | 108.567 599 | 38.214 216 | 86.308 234 | 49.934 423 |
| 2 | 125.590 279 | 159.280 804 | 136.882 766 | 75.346 482 |
| 3 | 211.314 167 | 324.568 544 | 139.348 692 | 107.981 567 |
| 4 | 246.963 528 | 346.949 356 | 254.622 529 | 114.743 744 |
| 5 | 268.205 099 | 448.681 377 | 388.125 932 | 152.840 538 |
| 6 | 446.527 377 | 854.019 813 | 423.117 658 | 176.465 284 |
| 7 | 555.008 999 | 544.006 739 | 188.182 915 | |
| 8 | 628.996 167 | 638.728 551 | 206.664 157 | |
| 9 | 853.603 009 | 889.963 443 | 255.529 978 | |
| 10 | 915.104 215 | 961.793 413 | 298.740 370 | |
| 11 | 994.884 744 | 322.380 920 | ||
| 12 | 351.945 957 | |||
| 13 | 364.979 379 | |||
| 14 | 451.223 322 | |||
| 15 | 514.336 224 | |||
| 16 | 545.658 933 | |||
| 17 | 824.997 166 | |||
| 18 | 864.366 343 | |||
| 19 | 932.125 583 | |||
| 20 | 975.193 524 | |||
3.2. Dielectric properties
We perform linear response calculations using DFPT to obtain the dielectric tensor for BTSO using the PBE functional. In doing so, we find the dielectric constants along the a and c axes ( and
and  , respectively) (table 3), which compare well with those found in experiment [20, 21, 51]. Due to the isotropy of the [1 0 0] and [0 1 0] directions,
  and
and  are equal. In comparison to the relative static permittivity of SO (3.9), fresnoite displays values roughly three times larger. Yet it is much lower than the exceptionally high values of dielectric constant of BTO (over 103). This is to be expected though, as the large dielectric constant exhibited by BTO is caused by a pressure-induced phase change [52]. As fresnoite is not known to display any other phases up to its melting point, this effect is not present. Evaluation of the dielectric properties of systems using the hybrid functional HSE06 is not performed as it is not currently supported in VASP.
Table 3. Theoretical and experimental values for the relative permittivity of  in the static and high-frequency regimes,
  and
and  , respectively. Calculated using PBE.
 |
 |
 |
 |
|
|---|---|---|---|---|
 |
3.365 | 3.200 | 14.548 | 11.774 |
 |
15 | 11 |
aThis work, calculated using PBE bExpt. [21]
Refractive indices of can be obtained by using the approximation  . Due to the uniaxial nature of BTSO, it displays two refractive indices, no and ne, relating to the a and c axes, respectively. It, therefore, also displays a birefringence,
  . From our theoretical values of the high frequency responses, we find refractive indices of
  and
and  , with
  . Shen et al [53] shows experimental refractive indices of
  and
and  in response to a wavelength of
  m, with a birefringence of
  . Oxygen defects strongly affect optical responses of the system, and are likely the cause of the discrepancy between our theoretical results and those found in experiment. Our results show a much higher birefringence than those found in the experimental values, showing a larger anisotropy
3.3. Electronic properties
To better understand the electronic and polar properties, we first examine the charge distribution. By performing Bader charge analysis, we are able to find a more accurate picture of the localisation of electrons across the unit cell. In figure 3, we present the charge distribution across the fresnoite unit cell for both the PBE and HSE06 functionals. In the system, strong oxidation occurs to the barium atoms, causing them to display strong ionic bonding with nearby oxygen atoms. This is typical of barium in oxides and is very similar in its behaviour to BTO (table 4). Bader analysis shows very little charge on the silicon atoms and further analysis of the charge density suggests this is due to covalent bonding between them and their neighbouring oxygen. Although titanium shows partial ionic bonding between neighbouring oxygen atoms, it exhibits more covalent-like bonding than the barium, with the charge being shared between both the Ti and O atoms.

Figure 3. Bader charge analysis of  performed using the (a) PBE and (b) HSE06 functionals. The numbers depict the amount of charge gained by each atom when compared to the isotropic charge of the respective atomic species.
Download figure:
Standard image High-resolution imageTable 4. Bader analysis of the tetragonal unit cell of  using the PBE and HSE06 functionals. Here, O(1) are the two O that lie in the Ti plane and O(2) the O atom that lies in the Ba plane.
| Functional | Electrons gained | |||
|---|---|---|---|---|
| Ba | Ti | O(1) | O(2) | |
| PBE |  |
 |
+1.235 | +1.256 |
| HSE06 |  |
 |
+1.322 | +1.360 |
Comparison of the HSE06 and PBE functionals shows that the charge localisation broadly remains the same. Small charge redistribution is seen on the barium, and no charge redistribution occurs on the silicon. Significant charge redistribution is instead seen on the titanium and oxygen atoms. Overall, these results are expected as charge is generally found to be more delocalised with GGA functionals than the HSE06 functional.
The HSE06 functional calculations show slightly stronger oxidation occurring to the Ba atoms than the PBE functional. In general, Bader charge analysis reveals the Ba has a positive charge. In PBE calculations, this value is +1.657, whereas in HSE06, the value is +1.699, indicating the ionic bonding is stronger in the real system than a PBE calculation would suggest. Although no change of charge is found on the silicon atoms, their neighbouring oxygen atoms see slight charge redistribution. O(2), O(1) and O(3) all exhibit an increase in charge comparing HSE06 with PBE. Similarly, silicon atoms show slightly increased ionicity and decreased covalency. In comparison, O(4) and Ti atoms all show significant differences in charges between the two functionals. Overall, an increased localisation of charge does not change covalent bonds much; whereas ionic bonding is shown to depend quite heavily on the choice of functional. This stronger ionisation is also visible in the band structures seen in figure 4; the increased ionisation results in a larger band gap.
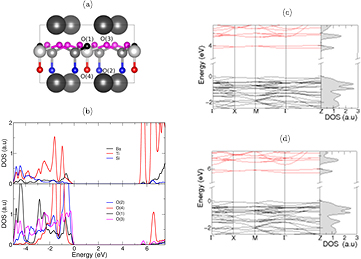
Figure 4. (b) Projected density of states (PDOS) for Ba2TiSi2O8 calculated using the HSE06 functional. (a) distinguishes between the four oxygen atoms, where their various colours match those of the states found in the PDOS in (b). The band structure and total density of states for  using the PBE (c) and HSE06 (d) functionals. All energies are given with respect to the valence band maximum. (a) Atomic structure. (b) PDOS of atoms (HSE06). (c) Band structure (PBE). (d) Band structure (HSE06).
Download figure:
Standard image High-resolution image
When comparing BTSO and BTO, we find that barium and titanium show similar charge characteristics, regardless of choice of functional. Through the introduction of silica to form BTSO, electron distribution across the oxygens is radically changed. Oxygens neighbouring silicon atoms gain roughly 1.8 electrons each—whereas O(4) gain only 1.07 electron. In both systems, Ti atoms ionise roughly 2.3 electrons each. Due to the polar nature of BTSO, Ti atoms undergo ionic bonding with oxygen in the Si-Ti plane, and more covalent-like bonding to oxygens near the Ba plane. This polar structure is also present with the Si atoms, but to a much smaller extent.
For HSE06, the in-plane bond lengths of Ti–O(4) are found to be 1.68 Å, which is shorter than the in-plane bonds in BTO (1.99 Å in-plane and 2.01 Å in-tetragonal-plane). Along with the average loss of 0.3 electrons for O(4) compared to BTO, this indicates the TiO bonds in fresnoite are more covalent-like. Because SO is dominant in this region, the TiO bonds orientated in the [0 0 1] direction are decreased, preventing O(4) from extending further.
3.4. Band structure and density of states
In figure 4, we present BTSO's band structure and density of states. We compare also the PBE and HSE06 results. The first clear result is that using PBE gives a value of 3.79 eV for the band gap of fresnoite, whereas the hybrid functional method of HSE06 gives the band gap as 5.717 eV (table 5). By comparison, the experimental band gaps of  and quartz are 3.2 eV [54] and 8.9 eV [55], respectively, showing that inclusion of SO in BTSO significantly increases the band gap.
Table 5. Theoretical and experimental lattice parameters, cohesive energy and band gap for  and tetragonal
  unit cells.
| Method | Lattice parameter (Å) | Cohesive energy (eV/atom) | Eg (eV) | ||
|---|---|---|---|---|---|
| a | c | ||||
 |
PBE |
8.6500 | 5.2918 |  |
3.793 |
| HSE06 |
8.565 00 | 5.2398 |  |
5.717 | |
| Expt. |
8.529 | 5.211 | |||
 |
PBE |
4.03 | 4.048 |  |
1.788 |
| HSE06 |
3.98 | 3.998 |  |
3.114 | |
| Expt. | 3.998 |
4.018 |
6.314 |
3.2 |
|
BTSO is shown to have an indirect band gap of 5.717 eV along the Γ-M direction, with a second indirect gap of 0.330 eV appearing above the first two conduction bands. This suggests that BTSO can display not only a broadband response between the conduction band and valence band, but also a small optical response within the conduction band. This optical transition in the conduction band will look similar to that of defect transitions. Figure 4 shows that the electronic contribution due to the oxygen create the valence band edge of BTSO, whilst the titanium orbitals are dominant in the conduction band. Strong hybridisation of the O(4) orbitals with the Ti orbitals can be seen in figure 4(b), in which both atoms display very similar features near to the band edges. This structure of the titanium orbitals being dominant in the conduction band, oxygen orbitals being the main contributor to the valence band edge and barium orbitals filling the lower valence band is similarly present in BTO [42, 56, 57].
By comparing figures 3(b) and 4(b), the weaker localisation of charge on the O(4) atoms (when compared to the other O atoms in the system) is, again, attributed to a stronger covalent-like bonding between the Ti atoms above, as evidenced by the hybridisation of the O(4)-2p and Ti-3d orbitals. One of the largest differences between the two band structures in figure 4 is the downward shift of a band near the conduction band edge. This band splitting and increased dispersion of the O(4)-2p and Ti-3d orbitals is a result of the charge redistribution in this bond between the two functionals. Due to this splitting, the anti-crossings present in these bands also increase with use of HSE06. As expected, there is no significant change of the bands within the valence region between functionals.
The BTSO HSE06 band structure displays a strong difference between the band edges and the sub bands. Whilst the valence band maximum (VBM) and conduction band minimum (CBM) states are relatively dispersionless, the sub bands show significant dispersion. Large anisotropy in the system is also present in the bands; we find both the band edges along Γ-Z display almost entirely flat bands, whereas the other directions display more dispersion—with a maximum band variation of 0.17 eV. Across the entire Brillouin zone, we find that two Ti electronic bands at the CBM are separated from the rest of the conduction band and act like a defect in the band structure, with very little dispersion. We describe this state as defect-like as the difference in the energies of minima-maxima of the band is under 0.001 eV, which means the electron mobilities are expected to be very low along Γ-Z unless excited to the second set of conduction bands. This is due to the low percentage of Ti in the structure, constituting approximately 20% of the potential Si/Ti sites. The conduction band is, therefore, highly sensitive to the titanium and its surrounding environment.
Finally, we present the effective masses of the electrons and holes ( and
and  , respectively) at the CBM and VBM when using the HSE06 functional. Due to the curvature, the values for
  depend on the total range of the Brillouin zone considered. The value ranges represent us approximating the band edge within 15% or 25% of the Brillouin zone near to the band edge in the quadratic regime. It is found that holes travelling along the Γ-M direction display an
  of 2.1–2.3 me. Whereas electrons at the conduction band edge exhibit an effective mass,
  , of 4.7–5.7 me along Γ-M. By comparison, we notice the conduction band edge along Γ-Z displays an almost completely flat band. This suggests very little conduction along this direction with an effective mass of approximately 300 me. However, this value is difficult to quantify in a meaningful manner as we attempt to fit a nearly flat band to a quadratic. But we can confidently state a minimum value of at least 147 me.
4. Conclusion
Electronic and mechanical properties of  , have been obtained and compared using the generalised gradient approximation and hybrid functional methods. The Ti-3d state is found to dominate the conduction band edge, whilst the O-2p is the main contributor to the valence band edge. With use of a hybrid functional, the band gap is corrected from 3.79 eV to 5.72 eV. The hybrid functional shows overall stronger ionic bonding and weaker covalent bonding within the structure; both the barium and titanium atoms are found to show stronger ionic bonding than with the GGA functional. The calculated value of 131.73 GPa for the bulk modulus sits between the values for
  and
and  . Theoretical values for Raman frequencies of the system allow us to show the system to be mechanically stable, as well as the origin of the vibrational modes. The elastic tensor values we obtain agree strongly with those found in experiment, showing the system to be highly anisotropic, as expected. Both the electronic and elastic properties of fresnoite show it to be a highly anisotropic system, with little dispersion visible in its band edges along Γ–Z and significant differences between the elastic moduli along the [1 0 0] and [0 0 1] directions. We believe that the more accurate HSE06 electronic structure of BTSO will give a better understanding of the optical and electron transport properties as well as its chemical structure, which will be helpful for further research on systems involving fresnoite.
Acknowledgments
Via our membership of the UK's HEC Materials Chemistry Consortium, which is funded by EPSRC (EP/L000202), this work used the ARCHER UK National Supercomputing Service (www.archer.ac.uk). We acknowledge financial support from the Engineering and Physical Sciences Research Council (EPSRC) of the United Kingdom, via the EPSRC Centre for Doctoral Training in Metamaterials (Grant No. EP/L015331/1). Crystal structure images were generated using the VESTA visualisation program [59]. The authors thank Eros Mariani for his useful discussions. The research materials supporting this publication can be accessed at http://hdl.handle.net/10871/30403.