

Abstract
In the present study an organic–inorganic nanocomposite ion exchanger Polyindole-Ce(IV) vanadophosphate (PIn-CVP) was synthesized via sol-gel process showing excellent ion exchange capacity (IEC‒1.90 meqg−1). The material was characterized by SEM, TEM, XRD, FTIR, and TGA. A heterogeneous ion exchange membrane of PIn-CVP (IEC‒0.90 meqg−1) was also prepared by solution casting method. PIn-CVP shows high electrical conductivity (5.5 × 10⁻² S cm−1) and it is stable up to 120 °C under ambient conditions. Cd2+ selective membrane electrode was fabricated and its linear working range (3.98 × 10⁻⁷ M to 1.0 × 10⁻¹ M), response time (25 s), Nerstian slope 25.00 mV dec−1 and working pH range (4–7) were calculated. It was employed as an indicator electrode in the potentiometric titration of Cd2+.
Export citation and abstract BibTeX RIS
1. Introduction
Cadmium is a toxic heavy metal causing nausea, vomiting, diarrhea, muscle cramps, salivation, sensory disturbances, convulsions, shock and renal failure, affecting organs such as kidney, liver, bone, when people are exposed to it above permissible limits through water, soil and food. It is a part of many industrial and agricultural processes such as metal plating, cadmium–nickel batteries, mining, pigments, stabilizers, alloys and phosphate fertilizers [1]. Recently, several techniques including flame atomic absorption spectrometry (FAAS), electrothermal atomic absorption spectrometry (ETAAS), inductively coupled plasma mass spectrometry (ICP-MS), striping choronopotentiometry and atomic fluorescence spectrometry (AFS) [2–9] have been used for the determination of trace elements in different samples. However, all these methods are expensive, time consuming, involve sample manipulation and require infrastructure set up. Selective analytical methodologies, which are easily operated and involve harmless reagents, cost effective equipment, have therefore been proposed as alternative to standard methods.
Potentiometry based ion-selective electrodes (ISEs) are especially suited for such determination because they offer advantages such as selectivity, sensitivity, good precision, simplicity, and low cost [10]. A number of cadmium selective electrodes based on Ag2S–Cd mixture [11], cadmium chelates [12], tetrol [13] macrocycles [14] and variety of other ionophores [15–18] have been reported but these suffer from serious interferences caused by Ag+, Cu2+, Hg2+ and Fe3+. Since most of them lack of high selectivity, wide concentration range, short response time, low detection limit, Nernstian response and reproducibility, the efforts are still in progress to improve the quality of cadmium selective electrodes.
One area of improvement in designing the electrode is the use of mechanically strong and dimensionally stable heterogeneous ion exchange membrane showing the better IEC, electrochemical properties and selectivity for a particular ion. This is achieved by using conductive nannocomposite ion exchange material exhibiting high affinity for particular ion to prepare the membrane. A number of ISEs prepared from heterogeneous ion exchange membrane have been reported in literature [17, 19–20].
The present research work describes the fabrication of Cd2+ selective membrane electrode for the estimation of cadmium in aqueous samples. The linear concentration range, working pH range, and response time were investigated to evaluate the performance of membrane electrode. The heterogeneous membrane utilized in the fabrication of Cd2+ selective membrane electrode was prepared by solution casting method using conductive nanocomposite ion exchange material with polyvinyl chloride (PVC) serving as a binder. The nanocomposite was synthesized by incorporating Ce(IV) molybdophosphate in the polymer matrix of organic polymer polyindole.
2. Experimental
2.1. Chemicals, reagents and instruments
Ammonium ceric nitrate ((NH4)2[Ce(NO3)6]), sodium (meta) vanadate (NaVO3) and ortho-phosphoric acid (H3PO4) were purchased from CDH; Indole (C8H7N) from Himedia (India); ferric chloride, N, N-Dimethyacetamide (DMAC) and chloroform were acquired from Qualigens (AR grade); Ethylenediaminetetraacetic acid (EDTA) were purchased from E-Merck (India Ltd). All other chemicals were of analytical grade and were used as received. The following instruments were used: scanning electron microscope (SEM) with energy-dispersive x-ray (EDX) (LEO 435–VF, JEOL, Japan); transmission electron microscopy (TEM) (JEOL JEM-2100); Rigaku x-ray powder diffractometer (PW 1148/89, Phillips, Holland); FTIR spectrophotometer (PerkinElmer); thermal analyzer (DTA)-2.2A (DuPont 9900, USA); the Four Probe Setup, DFP-RM-200 (Research Model), SES Instruments, Roorkee, India; a digital potentiometer (Equiptronics Q 609, India); atomic absorption spectrophotometer (AAS) (model GBC 902, Australia) and electronic balance (digital).
2.2. Synthesis of polyindole–Ce(IV) vanadophosphate (PIn-CVP) and its membrane
Ce(IV) vanadophosphate (CVP) was prepared by mixing ammonium ceric nitrate and sodium vanadate with ortho-phosphoric acid in different volume ratios at room temperature about 25 °C as given in table 1. The precipitate was filtered, washed and dried to fine powder. PIn-CVP composite ion exchange material was synthesized by sol-gel method [21]. Calculated amount of indole was dissolved in 100 ml chloroform in round bottom flask. The pH of the solution was maintained at 1 by adding few drops of HCl. FeCl3 solution (1, 2 and 3 M) in chloroform was prepared in a separate beaker and was slowly added to the flask and stirred for 6 h for complete polymerization of indole at room temperature about 25 °C [22]. Freshly prepared inorganic precipitate of ceric ammonium nitrate and sodium vanadate with ortho-phosphoric acid was mixed slowly to the flask and the stirring was continued for another 12 h at room temperature. Finally the mixture was filtered, washed, dried and grounded to fine powder. Condition and details of preparation are given in table 2.
Table 1. Conditions of preparation and IEC of inorganic cation exchanger CVP.
| Sample no. | Mixing volume ratio (V:V:V) | IEC (meqg−1) | ||
|---|---|---|---|---|
| Ammonium ceric nitrate (0.1 M) | Sodium vanadate (0.1 M) | H3PO4 (0.1 M) | ||
| CVP-1 | 1 | 1 | 1 | 1.40 |
| CVP-2 | 2 | 1 | 1 | 1.35 |
| CVP-3 | 1 | 2 | 1 | 1.45 |
| CVP-4 | 2 | 1 | 2 | 1.55 |
| CVP-5 | 1 | 1 | 2 | 1.45 |
Table 2. Conditions of preparation and the ion-exchange capacity of PIn-CVP cation exchange composite.
| Sample | Fixed mixing volume ratio(v:v:v) | Na+ IEC (meqg−1) | ||
|---|---|---|---|---|
| PIn | CVP-4 | FeCl3 | ||
| C-1 | 1 | 1 | 1 (1.0 M) | 1.65 |
| C-2 | 2 | 1 | 1 (1.0 M) | 1.70 |
| C-3 | 1 | 2 | 1 (2.0 M) | 1.80 |
| C-4 | 2 | 1 | 1 (2.0 M) | 1.70 |
| C-5 | 1 | 2 | 1 (3.0 M) | 1.90 |
| C-6 | 2 | 1 | 1 (3.0 M) | 1.75 |
The heterogeneous ion exchange membrane was prepared by solution casting method. The composite PIn-CVP as ion exchanging material and PVC as binder were mixed in various mixing ratios in tetrahydrofuran (THF) in a beaker with a magnetic stirrer for 12 h to make a thick homogenous mixture. The mixture was casted onto a clean glass plate and kept at room temperature until it was dried. Then it was peeled off and washed with distilled water, dried and utilized for further studies. Conditions of preparations and IEC are given in table 3.
Table 3. Condition of preparation and IEC of heterogeneous PIn-CVP cation exchange membrane.
| Membrane no. | PVC (g) | Composite (g) | THF (ml) | Stirring time (h) | IEC (meqg−1) |
|---|---|---|---|---|---|
| M-1 | 0.30 | 0.20 | 50 | 24 | 0.60 |
| M-2 | 0.25 | 0.20 | 50 | 24 | 0.75 |
| M-3 | 0.20 | 0.20 | 50 | 24 | 0.80 |
| M-4 | 0.20 | 0.15 | 50 | 24 | 0.90 |
| M-5 | 0.15 | 0.20 | 50 | 24 | 0.65 |
2.3. Ion exchange capacity (IEC)
The IECs of CVP and PIn-CVP composite were calculated by column method. First, the ion exchange material was kept in 1 M HNO3 for 24 h to convert it into H+ form. Then, it was filtered, washed with demineralised water (DMW) to remove excess acid and dried in an oven at 40 °C. A glass column of internal diameter ~1 cm fitted with glass wool (bed length ~1.5 cm) was packed with one gram of exchanger. The H+ ions were eluted from the column by using 1 M NaNO3 keeping a flow rate of 0.5 ml min−1. The effluent was collected and titrated against 0.1 M NaOH standard solution using phenolphthalein as indicator.
To calculate the IEC of membrane, first, it was cut into 3 cm × 3 cm piece and dipped in 1 M HNO3 for 24 h to convert it into H+ form. Then it was taken out and rinsed with DMW and dried at room temperature. It was kept in 1 M NaNO3 for 24 h and was intermittently shaken to elute H+ ions from membrane. Finally, the effluent was titrated against 0.1 M NaOH standard solution using phenolphthalein as indicator.
2.4. Distribution coefficient ( values)

The distribution studies were done by batch method by equilibrating the metal ions (Ni2+, Hg2+, Pb2+, Cu2+, Cd2+) between different solvents (HCl, HNO3, H2SO4, CH3OH, etc) and composite ion exchanger to determine distribution coefficients [23]. The suspension in conical flask containing 0.005 M metal ion solution and 2 g ion exchanger was agitated for 24 h with intermittent shaking to ensure the complete distribution of metal ion between aqueous (solvent) and solid phase (exchanger). Metal ion concentration was determined by titration with EDTA.  values were calculated by following equation:

Where 'I' is the initial amount of metal ion in the aqueous phase, 'F' is the final amount of metal ion in the aqueous phase, 'V' is the volume of the solution (ml) and 'M' is the amount of cation exchanger (g). The details are given in table 4.
Table 4. Kd values of metal ions on PIn-CVP composite ion exchanger in different solvents.
| Metal/aqueous solutions | HNO3 (M) | H2SO4 (M) | HCl (M) | C2H5OH 10−2 M | DMW | Buffer pH-5.75 | ||||||
|---|---|---|---|---|---|---|---|---|---|---|---|---|
| 10−1 | 10−2 | 10−3 | 10−1 | 10−2 | 10−3 | 10−1 | 10−2 | 10−3 | ||||
| Ni2+ | 160 | 188 | 240 | 77 | 86 | 98 | 116 | 135 | 164 | 138 | 250 | 330 |
| Cu2+ | 160 | 220 | 284 | 110 | 125 | 148 | 90 | 120 | 185 | 140 | 200 | 150 |
| Pb2+ | 220 | 256 | 290 | 115 | 152 | 177 | 250 | 286 | 333 | 265 | 425 | 490 |
| Hg2+ | 198 | 204 | 262 | 120 | 135 | 187 | 110 | 130 | 165 | 190 | 275 | 250 |
| Cd2+ | 530 | 652 | 765 | 515 | 630 | 717 | 525 | 566 | 635 | 427 | 523 | 555 |
2.5. Characterization of PIn-CVP nanocomposite ion exchanger and its membrane
The nanocomposite ion exchanger and the heterogeneous ion exchange membrane were characterized by various instrumentation techniques. To observe the surface microstructure and chemical composition of the materials, the SEM with EDX (LEO 435–VF, JEOL, Japan) was used with accelerating voltage of 5 kV in SEI (secondary electron imaging) mode at working distance (WD) ̴6 mm. The particle size of the material was observed by TEM (JEOL JEM-2100) by coating the sample with gold and using higher accelerating voltage of 200.0 kV at 40000 resolutions. The x-ray diffraction studies were done by Rigaku x-ray powder diffractometer (PW 1148/89, Phillips, Holland) with Cu anode (Kαλ = 1.541 86 Å) in the range of 0° ⩽ 2Ɵ ⩽ 80° at 30 kV at scan rate of 5° min−1 to determine the molecular structure and degree of crystallinity. The thermal stability of the samples was checked by thermal analyzer (DTA)-2.2A (DuPont 9900, USA), by heating the samples at 20 °C min−1 from 0 °C to 600 °C at in nitrogen atmosphere. The functional groups present in the sample were identified by using FTIR spectrophotometer (PerkinElmer) in the original form by KBr disk method in the range 400–4000 cm−1 at room temperature.
2.5.1. Physicochemical characterization of PIn-CVP ion exchange membrane
Physicochemical characters of membrane such as porosity, water content, swelling and thickness (table 5) were determined by using following procedure:
Table 5. Physicochemical characterizations of PIn-CVP heterogeneous ion exchange membrane.
| Composite ion exchange membrane | Thickness of the membrane (mm) | Water content as % weight of wet membrane | Porosity | Swelling of % weight of membrane |
|---|---|---|---|---|
| M-1 | 0.50 | 10.24 | 1.2 | 15.12 |
| M-2 | 0.48 | 12.34 | 1.4 | 12.67 |
| M-3 | 0.45 | 15.45 | 0.9 | 11.82 |
| M-4 | 0.37 | 11.56 | 1.1 | 11.34 |
| M-5 | 0.40 | 9.76 | 1.0 | 13.56 |
Firstly, the conditioned membranes were soaked in water to elute diffusible salts. Then, the membrane was weighed after removing surface moisture by blotting it with whatman filter paper and drying it in vacuum over P2O5 for 12 h.
Water Content of membrane (% total wet weight) was calculated as:

Where,  is the weight of soaked/wet membrane and
  is the weight of dry membrane.
Porosity  was determined as the volume of water incorporated in the cavities per unit membrane volume:

Where,  is the weight of dry membrane,
  is weight of soaked/wet membrane, A is the surface area of the membrane, L is the thickness of the membrane and
  is density of water.
Average thickness of the membrane was calculated by taking the mean of thicknesses measured at different points using screw gauge. Swelling was measured as the difference between the average thicknesses of the wet membrane (equilibrated with 1 M NaCl for 24 h) and the dry membrane.
2.6. Electrical conductivity measurement of PIn-CVP nanocomposite
Electrical conductivity measurements were done on PIn and PIn-CVP pellets using Four Probe Method. The pellets for analysis were prepared from 0.2 g material with the help of hydraulic pressure machine by applying 25 kN pressure for 5 min at room temperature. The conductivity (σ) was calculated using the following equations [24]:


Where 'I', 'V', 'W' and 'S' denotes current (A), voltage (V), thickness of the film (cm) and probe spacing (cm), respectively. G7 (W/S) is a correction divisor which is a function of thickness of the sample as well as probe spacing.
In the isothermal stability experiment, the pellets of PIn and PIn-CVP were heated at 30, 50, 70, 90 and 110 °C in a proportional-integral-derivative (PID)-controlled oven and at each temperature electrical conductivity was recorded after an interval of 10 min.
In the cyclic ageing experiment DC electrical conductivity was measured in temperature range 30–120 °C in five successive cycles at interval of 1 h.
2.7. Ion selective membrane electrode and its parameters
The membrane was cut in the form of a disc and attached to the lower end of a glass tube. The tube was filled with standard Cd2+ solution, and reference electrode was inserted into it. The assembly was placed in a beaker containing test solution of Cd2+ ions and another external reference electrode. When the membrane is placed between the two solutions of Cd2+ of different concentrations, the diffusion of ions takes place from one compartment to another under the influence of concentration gradient. As a result, charge sets up across the membrane and electrical potential difference is developed as described by Nernst equation:

Here, a1 and a2 are the activities of solutions in two compartments separated by membrane. The internal reference electrode and external reference electrode are immersed in the Cd2+ ions solution and potential generated across the membrane is measured with potentiometer. The potential difference depends upon the activity of Cd2+ ions which is related to its concentration. In this way, electric potential of a series of standard solutions were plotted versus the logarithm of the concentration of the Cd2+ ions to develop calibration curve. The concentration of unknown solution was calculated with the help of corresponding potential value in the calibration curve.
| Internal reference electrode (SCE) | Internal electrolyte 0.1 M Cd2+ | Ion-exchange Membrane | Sample solution | External reference electrode (SCE) |
To analyse performance of the membrane electrode, the following parameters were evaluated: selectivity coefficient, detection limit, response time, linear response range and working pH range.
The potentiometric selectivity coefficients ( ) were expressed by mixed solution method based on Nicolsky–Eisenman equation [25].

It defines the ability of an ion-selective electrode to distinguish a particular ion, i.e. primary ion from other ions (interfering ions). It is one of the most important parameters of the ISE showing the impact of the interfering ion on the potential measurement. The selectivity coefficients of some ions are given in table 6 and were calculated using the following equation:

Table 6. Selectivity coefficient of various interfering ions.
| S. No. | Interfering ions | Selectivity coefficient |
|---|---|---|
| 1 | Cd2+ | 1 |
| 2 | Cu2+ | 1.2 × 10⁻¹ |
| 3 | Hg2+ | 2.3 × 10⁻¹ |
| 4 | Cr3+ | 1.9 × 10⁻¹ |
| 5 | Ni2+ | 2.4 × 10⁻¹ |
| 6 | Al3+ | 3.1 × 10⁻¹ |
Where  and
and  are activity of primary and interfering ion respectively;
  and
and  are charges on the primary and interfering ions. The smaller value of
  indicates high preference for primary ion.
Response time is defined as the time interval needed for cell potential to become equal to its steady state or limiting value when the activity of the ion of interest in contact with ISE and reference electrode is changed [26]. It was determined by dipping electrode in a 1 × 10⁻² M of the Cd2+ ions solution and then shifting it immediately to 1 × 10⁻¹ M Cd2+ solution (10 fold higher in concentration). The potential of the solution was read at 0 s and subsequently recorded at the intervals of 5 s until it became stable. The potentials were then plotted versus the time.
The analytical utility of this membrane electrode was established by employing it as an indicator electrode in the potentiometric titration of 1 × 10⁻¹ M Cd2+ ions against EDTA. EDTA reacts with the Cd2+ ions and forms a complex; consequently, the concentration of Cd2+ ions in the sample is calculated from the volume of the EDTA used in titration. Potential values were plotted against the volume of EDTA used.
To calculate the working pH range for the electrode, various solutions of Cd2+ ions (1 × 10⁻¹ M) having pH value ranging from 4 to 8 were prepared by the addition of dilute HCl and NaOH, and the electrode potential at each pH was recorded. A graph of electrode potential versus pH was plotted.
To evaluate the performance of proposed membrane electrode as well as the results of analysis of Cd2+ ions few samples were validated against AAS spectrophotometry. Four Cd2+ solutions of known concentration were prepared and were analyzed in four replicates first by proposed membrane electrode and then by AAS spectrophotometry and the results were compared (table 7).
Table 7. Determination of Cd2+ in the samples of concentration by the proposed PIn-CVP membrane electrode and AAS spectrophotometry and comparison of the results.
| Proposed membrane electrode | AAS Spectrophotometry | ||||||||
|---|---|---|---|---|---|---|---|---|---|
| Cd2+ taken (M) | Cd2+ found (M) | SD | RSD (%) | Recovery (%) | Cd2+ taken (ppm) | Cd2+ found (ppm) | SD | RSD (%) | Recovery (%) |
| 2.5 × 10⁻⁵ | 2.2 × 10⁻⁵ | 0.10 × 10⁻⁵ | 4.45 | 88.0 | 2.81 | 2.50 | 0.135 | 5.40 | 88.96 |
| 5.0 × 10⁻⁵ | 4.7 × 10⁻⁵ | 0.13 × 10⁻⁵ | 2.75 | 93.0 | 5.62 | 5.05 | 0.06 | 1.14 | 89.8 |
| 7.5 × 10⁻⁵ | 7.2 × 10⁻⁵ | 0.10 × 10⁻⁴ | 1.40 | 95.3 | 8.43 | 7.35 | 0.129 | 1.75 | 87.8 |
| 1.5 × 10⁻⁴ | 1.3 × 10⁻⁴ | 0.08 × 10⁻⁴ | 6.66 | 86.6 | 16.86 | 14.65 | 0.405 | 2.76 | 86.8 |
3. Results and discussion
3.1. Synthesis and IEC of CVP, PIn-CVP cation exchanger and its heterogeneous membrane
The CVP was obtained as white powder, formed by mixing ammonium ceric nitrate, sodium vanadate with ortho-phosphoric acid together in various volume ratios. The IEC of CVP samples are given in table 1. The sample showing highest IEC-1.55 meqg−1 (CVP-4) was selected for the synthesis of composite of CVP with polyindole. The polyindole was obtained as the blackish lightweight fibrous material because of chemical oxidation of indole monomer. The composite PIn-CVP formed by the sol-gel method was obtained as blackish powder after adding freshly prepared white precipitate of CVP to polyindole slurry. The doped conductive state of polyindole and its chemical polymerization as well as formation of composite is shown in scheme 1. The IEC of various PIn-CVP composite samples synthesized by varying the amount of indole, CVP and FeCl3 are given in table 2. The C-5 shows better IEC (1.90 meqg−1) than other samples. The CVP particles are attached to the N atom of positively charged polymer chains through the phosphate anion. The heterogeneous membranes were obtained in the form of thin sheets. The sample M-4 (IEC-0.90 meqg−1) (table 3) was selected on the basis of IEC for further studies.

Scheme 1. Schematic representation of synthesis of PIn-CVP nanocomposite.
Download figure:
Standard image High-resolution image3.2. Distribution coefficient ( values)

The distribution coefficient values calculated for various metal ions (Cd2+, Pb2+, Cu2+, Hg2+, Ni2+, Cr3+) in different solvents (H2SO4, HCl, HNO3, Buffer pH-5.74, DMW) were found to be relatively higher for Cd2+ than the other metal ions (table 4). The highest  values for Cd2+ ions were observed in 1 × 10⁻³ M HNO3. It was observed that
  values were lower for higher concentrations of all acids. Since
  value is a direct measure of the partitioning of metal ions between solid and aqueous phase. The reaction involves the replacement of H+ ions on solid phase composite by another metal ions (Cd2+) taken from aqueous solution in contact with solid. The solid phase composite used in this process is first converted into H+ form by keeping it in 1 M HNO3 for 24 h. The previously sorbed H+ ions of weaker affinity are exchanged for metal ions (Cd2+) in aqueous solution as shown in the equation (11):

Here (R) is ion-exchanger network.
In the above ion-exchange equilibrium reaction, the high concentration of H+ ions (strongly acidic solution) shifts the equilibrium in the backward direction and decreases the release of H+ from the exchanger, ultimately reducing the concentration of Cd2+ in aqueous phase. Therefore,  values were lower for higher concentration of all acids.
The variations in  values can be explained on the basis of ion exchange properties, ion sieve characteristics of composite exchanger, and stability constants of metal ion exchanger complexes. The selectivity also depends upon many factors including the formation of coordination bond between transition metal cation (Cd2+) and ionogenic groups of exchanger (PIn-CVP) in the solid phase, which is based upon the ability of the exchanger to donate electrons and capability of metal cation to accept them. Electrostatic interaction of chemical nature between counter ion and ionogenic groups may also exist, where counter ions with higher valences and small hydrated radii produce strong electrostatic attraction. The PIn-CVP composite interacts with Cd2+ ions via phosphorous atom of CVP anion as shown in scheme 2.
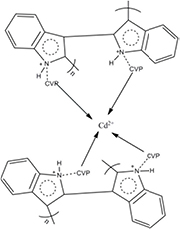
Scheme 2. Schematic representation of interaction of Cd2+ with PIn-CVP.
Download figure:
Standard image High-resolution image3.4. Characterization of PIn-CVP nanocomposite cation exchanger and membrane
3.4.1. Morphological studies
Figure 1 shows the SEM micrograph of CVP, PIn, and PIn-CVP composite and PIn-CVP membrane. The SEM image of PIn reveals the hollow microspherical morphology of polyindole particles which after aggregation have changed into small globular structures revealing its porous nature [27]. The micrograph of PIn-CVP composite shows the inorganic particles embedded into polymer matrix with uniform distribution. In SEM micrograph of small portion of PIn-CVP membrane the composite particles can be seen uniformly distributed in the polymer matrix.
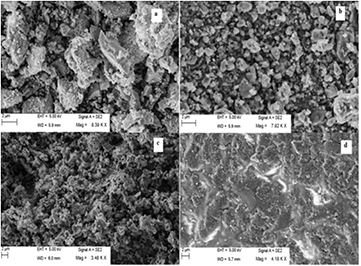
Figure 1. SEM micrographs of (a) CVP, (b) PIn, (c) PIn-CVP composite, (d) PIn-CVP membrane.
Download figure:
Standard image High-resolution imageThe TEM image of PIn-CVP composite shows the dark spotted CVP particles encapsulated in the light grey colored hollow microspherical polyindole structures (figure 2). The average particles size of composite is found to be 19.3 nm.

Figure 2. TEM image of PIn-CVP nanocomposite cation exchanger.
Download figure:
Standard image High-resolution imageThe EDX analysis result (figure 3) gives the chemical composition of PIn-CVP membrane. The relative amount of elements present are given as weight% percent C(52.99%), N(11.71%), O(18.51%), Cl(6.55%), P(2.60%), Ce(4.13%), V(3.50%).
3.4.2. FTIR analysis
The figure 4 shows the FTIR spectra of CVP, PIn, PIn-CVP nanocomposite and PIn-CVP membrane. In the FTIR of CVP, the broad peak at 3400 cm−1 corresponds to asymmetric and symmetric −OH stretching vibrations [28]. The peak at 1630 cm−1 is attributed to H–O–H bending frequency of water molecules. A broad peak at 1024 cm−1 is due to the stretching of P–O bond showing the presence of  ,
,  and
and  [29]. The characteristic peak of vanadate groups occurs at 690 cm−1. The peaks at 534 cm−1 can be due to the V–O vibrations.

Figure 3. EDX spectrum of PIn-CVP heterogeneous cation exchange membrane.
Download figure:
Standard image High-resolution image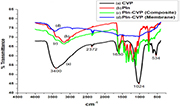
Figure 4. FTIR spectra of (a) CVP (b) PIn (c) PIn-CVP nanocomposite cation exchanger (b) PIn-CVP heterogeneous cation exchange membrane.
Download figure:
Standard image High-resolution imageWhile in the FTIR spectrum of polyindole, the broad peak around 3400 cm−1 and 2900 cm−1 indicates the N–H and O–H stretching vibrations, respectively. The peak at 1628 cm−1 and 1300 cm−1 corresponds to C=C and C=N stretching frequencies, respectively. The peak at 1450 cm−1 is assigned to the stretching of benzene ring. The band at 750 cm−1 indicates that benzene ring is not affected during the polymerization of indole.
3.4.3. Thermal analysis
In the TGA curve of CVP figure 5(a), the weight loss of approximately 20% upto 200 °C is due to the removal of external water molecules as well as internal water molecules caused by condensation of −OH groups. The gradual 5% weight loss in the temperature range 300–450 °C corresponds to the conversion of inorganic phosphate to pyrophosphate [30]. In the TGA curve of PIn figure 5(b), the weight loss of 4% upto 100 °C is due to the evaporation of physically absorbed moisture from the polymer. The gradual weight loss of approximately 6% is observed from 100 to 300 °C and polymer remains fairly stable in this temperature range. In contrast a sharp weight loss of 50% is observed after 350 °C due to the degradation of polymer chain. While in case of PIn- CVP composite figure 5(c), after the initial loss of weight (2%) upto 100 °C due removal of residual water trapped in polymer matrix, the weight of composite is almost remain unaffected until 400 °C when a 35% drop in weight is registered because of decomposition of polymer chain. The resistance to thermal degradation shows that the strong interaction is present between incorporated inorganic particles of CVP and polymer, which makes the composite thermally more stable as compared to pure indole. A similar TGA curve, figure 5(d), is observed for PIn-CVP membrane showing less stability as compared to composite. The first 20% weight loss may be attributed to removal of water crystallization from CVP and the water molecules in the porous structure of membrane upto 200 °C. The second weight loss (20%) between 250-300 °C may be due to the decomposition of PVC matrix. Another 25% weight loss is observed from 350–450 °C due to the degradation of polymeric backbone.
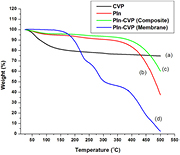
Figure 5. TGA curve of (a) CVP (b) PIn (c) PIn-CVP nanocomposite (d) PIn-CVP heterogeneous cation exchange membrane.
Download figure:
Standard image High-resolution image3.4.4. Diffraction studies
Figure 6 shows the diffraction pattern of CVP, PIn, and PIn-CVP composite. The amorphous nature of CVP is quite evident from the weak intensity peaks centered at around 2θ ~ 28°. The three broad peaks of polyindole are appearing at 2θ ~ 8°, 18° and 25° [31] also show the amorphous character of the polymer. The diffraction pattern of PIn-CVP shows peaks at 2θ ~ 8°, 19° and 27°, slightly shifted towards right confirming the formation of composite. The amorphous nature of polyindole is enhanced as result of destruction of ordered arrangement of polymer chains by integration of CVP in polymer matrix.

Figure 6. XRD Pattern of (a) CVP (b) PIn and (c) PIn-CVP nanocomposite cation exchanger.
Download figure:
Standard image High-resolution image3.5. Physicochemical characterization of PIn-CVP ion exchange membrane
The physicochemical characters such as thickness, water content, porosity, and swelling of the PIn-CVP membrane samples-M-1, M-2, M-3, M-4 and M-5 are given in table 5. Since nanocomposite material is mechanically stronger, it helps in reducing swelling process; therefore lesser amount of water is found in interstices, which provides overall mechanical strength of membrane. The low water content, low porosity and smaller thickness suggest that interstices are negligible which lead to diffusion of ions through the membrane predominantly through the exchanger sites.
3.6. DC electrical conductivity of PIn-CVP nanocomposite cation exchanger
Increase in electrical conductivity of PIn and PIn-CVP was observed with increase in temperature from 30 to 110 °C (figure 7(a)). This thermally activated behaviour [32] could be the result of efficient charge transfer between CVP and PIn-CVP as well as the effective chain alignment and molecular conformations of polymer leading to greater delocalization in the conjugated system [33]. Molecular arrangement of PIn comprises of alternate single and double bonds which stabilizes the polymer structure through resonance via delocalization of electronic states. When the dopant is introduced in the polymer chain, generally at the time of chemical polymerization, in the present case ferric chloride, it gives rise to localized positive charge in the polymer backbone. Consequently, polarons and bipolarons are created which increase the electrical conductivity of the polymer. The incorporation of CVP into the polymer matrix activates the conformational changes in the network of polymer chains from compressed to extended forms. It helps in the electronic coupling between charge centers in CVP and redox sites in the polymer chains, which in turn facilitates the charge transfer between CVP and polymer. These chemical interactions create new electron transfer pathways; thereby, increasing the electrical conductivity of the nanocomposite [34].

Figure 7. (a) Temperature dependent DC electrical conductivity of polyindole (PIn) and PIn-CVP nanocomposite (b) arrhenius plot of PIn and PIn-CVP.
Download figure:
Standard image High-resolution imageIt can be observed from figure 7(b) that the PIn-CVP nanocomposite follows Arrhenius equation from 30 to 110 °C for temperature dependence of electrical conductivity and after this deviation is observed which may be due to the degradation of nanocomposite. From figures 8(a) and (b), the isothermal stability in terms of DC electrical conductivity retention of PIn-CVP cation exchange nanocomposite was found to be better than pure PIn. Under the cycling aging conditions, the electrical conductivity of PIn and PIn-CVP recorded in five cycles at interval of 1 h decreases with each cycle as shown in figures 8(c) and (d) respectively. This may be due to the loss of moisture and polymer degradation during cyclic aging. It can be concluded that electrical conductivity of PIn-CVP is more stable than that of pure PIn.
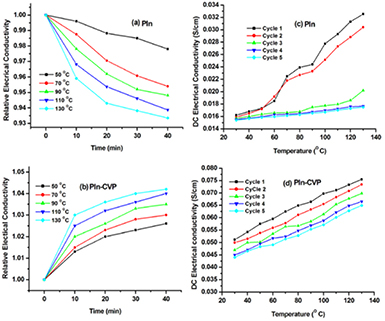
Figure 8. DC Electrical conductivity of polyindole (PIn) and PIn-CVP nanocomposite in terms of (a) and (b) isothermal aging and (c) and (d) cyclic ageing conditions.
Download figure:
Standard image High-resolution image3.7. Electronalytical studies of PIn-CVP membrane electrode
3.7.1. Linear response range
Figure 9 indicates a linear response of PIn-CVP membrane electrode over the concentration range from 3.98 × 10⁻⁷ M to 1.0 × 10⁻¹ M with Nernstian slope 25.00 mV dec−1. When the membrane is placed between the two solutions of Cd2+ ions of different concentrations, the diffusion of ions takes place from one compartment to another under the influence of concentration gradient. As a result, charge sets up across the membrane and electrical potential difference is developed as described by Nernst equation:

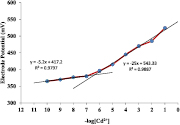
Figure 9. Calibration curve of Cd2+ selective PIn-CVP membrane electrode.
Download figure:
Standard image High-resolution imageHere, a1 and a2 are the activities of solutions in two compartments separated by membrane. The internal reference electrode and external reference electrode are immersed in the Cd2+ ions solution and potential generated across the membrane is measured with potentiometer. The potential difference depends upon the activity of Cd2+ ions which is related to its concentration. In this way, electric potential of a series of standard solutions were plotted versus the logarithm of the concentration of the Cd2+ ions to develop calibration curve (figure 9). The linear range of this calibration curve is applied to determine activity of Cd2+ ion of any unknown solution.
3.7.2. Response time
The response time indicates the quickness of the electrode to give the steady-state stable value of potential with ~95% accuracy. From figure 10, it is evident that the response time of the electrode is 25 s.
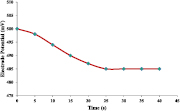
Figure 10. Response time curve of Cd2+ selective PIn-CVP membrane electrode.
Download figure:
Standard image High-resolution image3.7.3. pH range
Figure 11 shows the variation in electrode potential for a series of solution of Cd2+ ions having pH values ranging from 1 to 8. The result shows that potential does not change significantly throughout the pH range of 4–7. There is possibility of formation of precipitate of cadmium chloride salts below pH 4 and formation of cadmium hydroxides above pH 7 resulting in the reduction of free Cd2+ in the solution and thereby decreasing the electrode potential.
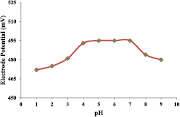
Figure 11. Effect of pH on the potential response of the Cd2+ selective PIn-CVP membrane electrode.
Download figure:
Standard image High-resolution image3.7.4. Potentiometric titration
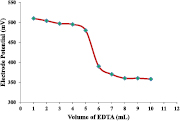
Figure 12 shows the potentiometric titration curve obtained by plotting electrode potential versus volume of EDTA used in the titration. The change in electrode potential is observed due to the complexation of Cd2+ with EDTA. The sharp end point for the potentiometric titration was observed on addition of 5 ml of EDTA. This implies that the electrode can be used as detector in potentiometric titration of Cd2+ ions with EDTA as titrant.
Figure 12. Potentiometric titration of Cd2+ against EDTA solution using PIn-CVP membrane electrode.
Download figure:
Standard image High-resolution image
3.7.5. Selectivity coefficient
The selectivity coefficients of some interfering ions, as measured by the mixed solution method, were found to be smaller than unity as given in table 6. The selectivity coefficient is one of the most important parameters of the ISE.  shows the impact of the interfering ion in the potential measurement. The smaller value of
  indicates better the selectivity with respect to the target ion. From table 6 it is implied that electrode response is not affected much by the presence of interfering ions. It also indicates the selectiveness of electrode towards Cd2+ ions for reliable measurement
3.8. Validation and comparison of PIn-CVP membrane electrode with other Cd2+ selective electrodes
The statistical comparison of results by AAS spectrophotometry and proposed membrane electrode in terms of SD (standard deviation), RSD% (relative standard deviation) and percent recovery are presented in table 7. Also, the comparative relationship with other Cd2+ selective membrane electrode has been given in table 8. The proposed membrane electrode was compared with other electrodes [16, 17, 19–20, 35, 36] based on linear response range, working pH range, response time and lifetime of electrode. The PIn-CVP membrane electrode can give potential response over a wide range of concentration from 3.98 × 10⁻⁷ M to 1.0 × 10⁻¹ M. Moreover, it can operate in pH range of 4–7 encompassing most of the cadmium solutions from slightly acidic to basic including neutral. It can give accurate results without noticeable drift in response up to 10 months period. However, its response time of 25 s may not be the quickest among other electrodes, but the chemical and thermal stability as well as wide linear response range and working pH range give it advantage over other electrodes.
Table 8. Comparison of characteristics of different selective electrodes.
| S. No. | Material of the membrane electrode | Working range (M) | Slope (mV dec−1) | Response time (s) | pH range | Lifetime (months) | Reference |
|---|---|---|---|---|---|---|---|
| 1 | Poly-o-toluidine Sn(IV) tungstate | 1 × 10⁻⁷–1 × 10⁻¹ | 26.25 | 50 | 4–7 | 18 | 19 |
| 2 | Polyaniline Sn(IV) tungstoarsenate | 1 × 10⁻⁴–1 × 10⁻¹ | 27.00 | 25 | 3–8 | — | 17 |
| 3 | Poly-o-anisidine Sn(IV) phosphate | 1 × 10⁻⁶–1 × 10⁻¹ | 26.0 | 35 | 3–8 | 6 | 20 |
| 4 | Bis-(4-hydroxyacetophenone) ethylenediamine | 1 × 10⁻⁵–1 × 10⁻¹ | 27-29 | 40 | 4–8 | 5 | 35 |
| 5 | 1-furoyl-3,3-diethyl thiourea | 1 × 10⁻⁶–1 × 10⁻³ | 28.5 | 20 | 4–9 | — | 36 |
| 6 | 5-[((4-Methyl phenyl) azo)-N-(6-amino-2-pyridin) salicyla-ldimine] | 7.5 × 10⁻⁷–1.5 × 10⁻¹ | 28.0 | 25 | 3.5–9 | — | 16 |
| 7 | Polyindole-Sn(IV) molybdophosphate | 3.98 × 10⁻⁷–1 × 10⁻¹ | 25.0 | 25 | 4–7 | 10 | Proposed membrane electrode |
4. Conclusions
The synthetic PIn-CVP nanocomposite and its heterogeneous membrane not only exhibited excellent ion exchanging properties, but also physical, chemical and thermal stabilities. The electrical conductivity of PIn-CVP was fairly good and it could be used in semiconducting devices below 130 °C under an ambient atmosphere. The fabricated Cd2+ selective membrane electrode showed linear response from 3.98 × 10⁻⁷ M to 1.0 × 10⁻¹ M with working pH range of 4–7 and response time of 25 s. It was successfully used as indicator in the potentiometric titration of Cd2+ ions.
Acknowledgment
Authors are thankful to the Department of Applied Chemistry, ZH College of Engineering and Technology, AMU. This work was supported by University Grants Commission, Government of India under grant number (42-336/2013 (SR)).