

Abstract
A novel strategy to fabricate hydrogen peroxide third generation biosensor has been developed from sol–gel of silica/chitosan (SC) organic–inorganic hybrid material assimilated with iron oxide magnetic nanoparticles (Fe3O4). The large surface area of Fe3O4 and porous morphology of the SC composite facilitates a high loading of horseradish peroxidase (HRP). Moreover, the entrapped enzyme preserves its conformation and biofunctionality. The fabrication of hydrogen peroxide biosensor has been carried out by drop casting of the SC/F/HRP nanocomposite on glassy carbon electrode (GCE) for study of direct electrochemistry. The x-ray diffraction (XRD) pattern and transmission electron microscopy (TEM) confirms the phase purity and particle size of as-synthesized Fe3O4 nanoparticles, respectively. The nanocomposite was characterized by UV–vis spectroscopy, fluorescence spectroscopy and Fourier transform infrared (FTIR) for the characteristic structure and conformation of enzyme. The surface topographies of the nanocomposite thin films were investigated by scanning electron microscopy (SEM). Dynamic light scattering (DLS) was used to determine the particle size distribution. The electrostatic interactions of the SC composite with Fe3O4 nanoparticles were studied by the zeta potential measurement. Electrochemical impedance spectroscopy (EIS) of the SC/F/HRP/GCE electrode displays Fe3O4 nanoparticles as an excellent candidate for electron transfer. The SC/F/HRP/GCE exhibited a pair of well-defined quasi reversible cyclic voltammetry peaks due to the redox couple of HRP-heme Fe (III)/Fe (II) in pH 7.0 potassium phosphate buffer. The biosensor was employed to detect H2O2 with linear range of 5 μM to 40 μM and detection limit of 5 μM. The sensor displays excellent selectivity, sensitivity, good reproducibility and long term stability.
Export citation and abstract BibTeX RIS
1. Introduction
Direct electrochemistry of redox enzymes is a promising field of research as it provides a mechanistic study of redox behavior of enzymes as well as establishing a foundation for fabrication of biosensors, bioreactors and biomedical devices [1]. The mediator free biosensors based on the direct electron transfer (DET) between redox enzymes and electrode are gaining increasing attention, as they become proficient without utilizing chemical mediators such as methylene blue, ferrocene etc. DET is a rather difficult process because the three-dimensional structure of enzyme hinders interaction with electrode leading to the subsequent passivation of electrode surface [2]. Therefore, a key issue in development of third generation biosensor is immobilization of enzyme on electrode to facilitate direct electron transfer. In this perspective, employment of nanomaterials for the construction of biosensing devices constitutes the most promising platform for direct electron transfer as it provides a favorable microenvironment for redox enzyme [3]. A wide range of nanomaterials such as magnetic nanoparticles [4], graphene [5], and biopolymers [6] have been successfully used for direct electrochemistry of HRP. Similarly, numerous efforts have been made to enhance the rate of electron transfer and obtain direct electrochemistry of redox enzyme for modification of electrode surface by methods including self-assembled monolayers SAMs [7], electrodeposition [8], layer-by-layer [9], covalent immobilization [10].
Recently, magnetic nanoparticles (MNPs) have emerged as a promising candidate for biomedical applications due to their large surface-to-volume ratio, good conductivity, strong super paramagnetic properties and good biocompatibility. MNPs have been used in various fields such as biosensors [11], bioseparation [12], drug delivery [13], and hyperthermia treatment of cancer [14] including enzyme immobilization. Metal oxide nanomaterials such as iron oxide have been found to exhibit interesting nanomorphological, non-toxic and high catalytic efficiency, along with enhanced electron-transfer kinetics, strong adsorption capability and provision of suitable microenvironments for the immobilization of biomolecules to improve biosensing characteristics [15]. Incorporating MNPs with silica composite can overcome the lack of binding sites on MNPs surface for attachment of biomolecules and creates specific sites to bind enzyme via surface silanol groups electrostatically at physiological pH [16].
Fe3O4 nanoparticles with an inverse cubic spinal structure exhibit unique electrical and magnetic properties due to the transfer of electron between Fe+2 and Fe+3 on octahedral sites and their use in biosensors has already shown attractive prospects [17]. Fe3O4 nanoparticles based biosensors include complicated enzyme immobilization techniques requiring cross-linking rather than entrapment in a matrix doped with Fe3O4 nanoparticles to avoid loss of the conformation and biofunctionality of enzymes, as widely reported [18–21]. Moreover, the integration of organic polymer with inorganic nanomaterial to yield functional hybrid nanocomposite is a favorable route to tailor physiochemical properties and enhance its biosensing ability [22]. In our previous work, silica–dextran interaction and detection of H2O2 with silica–dextran nanocomposite modified electrode was reported [23]. Chitosan, a natural polycationic polyglucosamine polymer that has been utilized for entrapment of enzymes with silica sol–gel is an attractive material having good film forming properties, chemical inertness, high mechanical strength and reactive amino and hydroxyl groups, amenable to chemical modifications [24].
The present work, demonstrates an in situ gelation process of silica sol in the presence of chitosan, generating an interpenetrating network of silica and chitosan macromolecules. The proposed strategy for fabrication of third generation biosensor is simple having a mild reaction condition with amino groups offering a convenient methodology for immobilization of enzyme. The organic-inorganic SC composite consisting of Fe3O4 nanoparticles is illustrated here using the model enzyme, horseradish peroxidase to study direct electron transfer of enzyme on electrode.
2. Experimental
2.1. Materials and reagents
HRP (EC 1.11.1.7, 150 U mg−1), tetraethyl orthosilicate (TEOS), and chitosan (low molecular weight, 85% deacetylation) were procured from Sigma. Hydrogen peroxide (30 w/v% solution), Ferrous sulfate heptahydrate (FeSO4.7H2O) and Ferric chloride hexahydrate (FeCl3.6H2O) were purchased from Hi Media, India and other analytical grade reagents were obtained from SD Fine chemical Pvt. Ltd, India and used without further purification. The potassium phosphate buffer (0.2 M KH2PO4 + 0.2 M K2HPO4 + 0.1 M KCl) was used as supporting electrolyte for electrochemical analysis. All solutions were prepared with deionized double-distilled water.
2.2. Instruments and measurements
The SC/F/HRP nanocomposites were characterized by scanning electron microcopy (JEOL JSM-6360 LA) equipped x ray microanalysis system, UV-visible spectroscopy (UV-2550, Shimadzu Co., Japan), Fourier transform infrared spectroscopy (Nicolet 510 P) and x-ray diffraction (Rigaku Miniplex). Transmission electron microscopy (TEM) images were achieved with a Model: JEM-100 CX II opened at an accelerating voltage of 100 kV. The UV-visible spectra were recorded in absorbance mode in the range of 300–600 nm using potassium phosphate buffer (pH 7.0) in quartz glass slide for SC/F/HRP nanocomposites film. Fluorescence spectroscopy was performed on a Shimadzu Spectro-fluorophotometer (RF-5301) equipped with a DR-3 data recorder.
Cyclic voltammetry (CV) and electrochemical impedance spectroscopy (EIS) were performed by using a CHI660C electrochemical workstation (CH Instruments, Shanghai, China). A three-electrode system was employed, including a working SC/F/HRP nanocomposite coated GCE electrode, an Ag/AgCl reference electrode and a platinum wire counter electrode. Prior to each experiment, the buffer solutions were purged with high-purity nitrogen for at least 30 min and a nitrogen environment was then kept over the solution in the cell during experiments. The impedance data were recorded at an open circuit voltage within 102–105 Hz frequency range in 5.0 mM K3Fe(CN)6/K4Fe(CN)6 (1:1) with 0.1 M KCl solution as supporting electrolyte. All experiments were carried out at room temperature (25 ± 2 °C).
2.3. Fabrication of hydrogen peroxide biosensor
Prior to use, a glassy carbon electrode (GCE, diameter 3.0 mm) was polished with alumina powder, washed with distilled water and dried at room temperature. The synthesis of SC composite and Fe3O4 nanoparticles were carried out as described in Supplementary No 1, available at stacks.iop.org/MRX/2/015402/mmedia. The Fe3O4 suspension (1.0 mg.mL−1) was prepared by vigorous stirring for about 2 h in potassium phosphate buffer of pH 7.0 which was subsequently dispersed in the SC sol by stirring at room temperature and sonicated for 1 h to obtain viscous SC sol with highly dispersed Fe3O4 nanoparticles. The HRP solution (2.0 mg mL−1) was added in the SC/F nanocomposite for entrapment of enzyme. The surface of GCE electrode was drop casted with the 3 μL of the SC/F/HRP nanocomposite. A small beaker was kept for slow evaporation of solvent for uniform film formation and dried at 4 °C for 12 h. The stepwise fabrication process of hydrogen peroxide biosensor is shown in the schematic representation in figure 1.
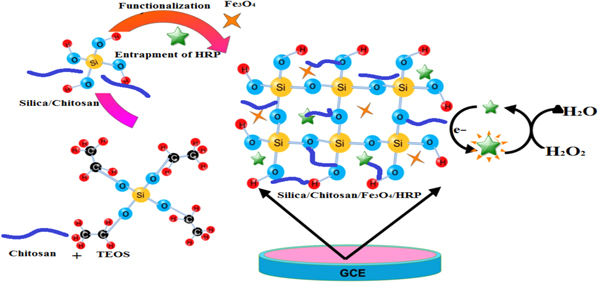
Figure 1. Schematic representation of SC/F/HRP nanocomposite synthesis and fabrication of hydrogen peroxide biosensor.
Download figure:
Standard image High-resolution image2.4. Optimization of electrode preparation
The inorganic silica sol–gel film exhibits cracking and shrinkage of matrix during ageing which can lead to a reduced response of biosensor and in extreme conditions removal of the matrix from the electrode surface was also observed. On the other hand, swelling property is a major obstacle for hydrogel or a natural polymer such as chitosan. While uniform matrix of SC nanocomposite is applied for fabrication of biosensor it shows a high response for biosensor [25]. Herein, the effect of the thickness of the enzyme entrapped film was studied by first varying chitosan in the stock SC solution. Obviously, when the amount of chitosan was more and the film formed on electrode was thicker, this led to a greater diffusion barrier for the substrate and product resulting in low biosensor response. Although, the electrode prepared without chitosan (sample S) or least amount (sample SC1) of chitosan offered the highest response, the electrode fabricated was prone to cracking which hampered biosensor stability. Chitosan (sample SC2 and SC3) in the stock solution has a better linear range with slightly inferior sensitivity with enhanced stability. This might be because micro-porous structure of silica using chitosan as template was dependent on the chitosan concentration and the deacetylation degree of chitosan [26]. Hence, the presence of chitosan in entrapment matrix was favorable for fabrication of biosensor. The optimum parameters for fabrication of biosensor are described in supplementary No 2. When the Fe3O4 nanoparticles are employed for biosensor, the meditation of electron transfer takes place through the following reaction [27],


It is noteworthy that the Fe3O4 nanoparticles concentration plays a significant role in the sensitivity of the proposed biosensor. The current response of biosensor with HRP immobilized in the SC/F shows that current increases gradually with increasing Fe3O4 nanoparticles content in the nanocomposite, due to an increased conductivity and reaches maximum at 1.0 mg.mL−1. Further increasing the amount of Fe3O4 led to a decrease in response, probably because the conglomerate of nanoparticles increases the interfacial resistance.
3. Results and discussion
3.1. Phase confirmation and particle size analysis
The XRD pattern of silica (a), silica–chitosan composite (b), chitosan (c), SC-Fe3O4 nanocomposite (d) and Fe3O4 nanoparticles (e) are illustrated in figure 2(A). The XRD pattern of silica (a) prepared with TEOS shows peak of low intensity and expressive width indicating amorphous structure, with halo centered peak on 23° [28]. The pristine chitosan (b) are arranged in semi-crystalline form which is represented by peaks on 9.7°, 20°, and 28.3°. The disappearance of these peaks in SC composite (c) is attributed to prominence of silica amorphous structure. The aforementioned suggests that silica and chitosan polymeric chains were integrated at a molecular level. The XRD pattern of Fe3O4 (e) shows diffraction peaks at 30.16°, 35.37°, 42.89°, 57.28° and 62.66° which are assigned to the (220), (311), (400), (511) and (440) crystallographic phases of Fe3O4; found to be in good agreement with the standard pattern (JCPDS Card no. 79-0419). However, the broad reflection peaks were owing to the particle size at nano domain. The average crystallite size of Fe3O4 was calculated to be 7.2 nm from the lower FWHM using Debye–Scherrer formula. The diffraction of the SC/F nanocomposite visibly indicates interaction of the SC composite with Fe3O4 nanoparticles displaying a decrease in intensities of peaks and a hump at 23–24° due to the incorporation of bulky polymeric chains, which validates the conjugation of silica and chitosan suppressing the crystallization to some extent.
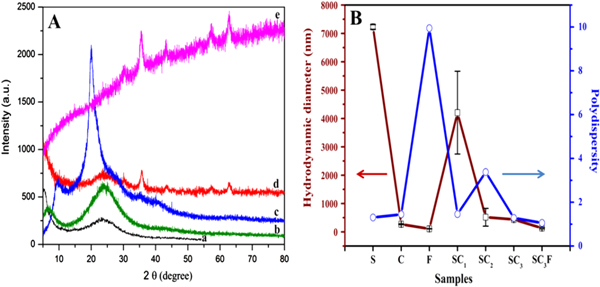
Figure 2. (A): x-ray diffraction pattern of (a) Silica, (b) SC composite, (c) Chitosan, (d) SC/F nanocomposite and (e) Fe3O4 nanoparticles; (B) hydrodynamic diameter (□) and polydispersity index (O) of (S) silica, (C) chitosan, (F) Fe3O4 nanoparticles, (SC1, SC2 and SC3) different formulation of SC composite and (SC3F) SC/F nanocomposite.
Download figure:
Standard image High-resolution imageThe particle size determined by DLS is based on the intensity of scattered light and measurement of the movement of particles undergoing Brownian motion in liquid medium. DLS was employed to determine the precise particle size for all the formulations of SC nanocomposite as well as individually for pure silica, chitosan and Fe3O4, as presented in figure 2(B). The DLS results illustrate the interactions of organic–inorganic material on the hydrodynamic diameter and polydispersity index of the nanocomposite. The hydrodynamic diameter of the silica was obtained to be 7229 nm, showing wide particle size distribution having polydispersity index 1.30. On the other hand, chitosan shows narrow (271 nm) hydrodynamic diameter with 1.44 PDI which clearly indicates the breaking of the polymer into smaller fragments as the chitosan was prepared in HCl. It was observed that in SC1 the particle size was obtained to be 4204 nm, which is larger as compared to that of SC2 and SC3 (515 nm and 437 nm), respectively, as there is the presence of a low concentration of chitosan as compared to the silica concentration. The polydispersity index values for SC3 is 1.2 which is less as compared to SC1 and SC2, i.e., 1.4 and 3.3 indicating that there might be the presence of free silica or chitosan macromolecules in the samples SC1 and SC2, respectively, due to which there is an increase in the range of PDI. Consequently, the SC3 nanocomposite was used for further analysis because of its low particle size and PDI. The Fe3O4 nanoparticles have the hydrodynamic diameter 109 nm and PDI 9.9. PDI is high because of the aggregation of the particles in the medium. It was interesting to mark that when these Fe3O4 nanoparticles interact with the SC composite (SC3) the polydispersity index is reduced to 1.0 with hydrodynamic diameter 135 nm, which suggests that SC composite is a very compatible material and helps in stabilization of the Fe3O4 nanoparticles.
The zeta potential was used to confirm the electrostatic interaction process by determining surface charge of silica, chitosan and Fe3O4, as presented in Supplementary No 3.
3.2. Surface morphological study
TEM was utilized to view particle size of as-prepared Fe3O4 nanoparticles and the selected area electronic diffraction (SAED) patterns are shown in supplementary No 4 a, b, respectively. The average particle sizes of the Fe3O4 nanoparticles estimated from TEM image and calculated from XRD pattern are very close to each other.
The panoramic surface morphologies of the as-synthesized Fe3O4 nanoparticles and SC/F nanocomposite were documented as illustrated in figure 3. The SEM micrograph of Fe3O4 (a) exhibits sphere shaped nanoparticles with a uniform distribution of sphere clusters of an average size 10 nm. An SEM image of the SC/F nanocomposite figure 3(b) indicates smooth surface and uniform structure. This confirms that silica, chitosan and Fe3O4 are incorporated uniformly with good compatibility and without phase separation. The EDAX spectra of the SC/F nanocomposite also confirm the presence of C, N, O, Si and Fe in the composite and quantitative elemental composition of nanocomposite listed in respective figures 3(c) and (d). Likewise, elemental x-ray microanalysis was conducted for confirmation of successful dispersion of reinforcement material in nanocomposite. Figure 3(e) depicts the x-ray mapping analysis of SC/F nanocomposite. The electron beam penetrates 2–3 microns below the surface of the thin film to reveal the embedded silica and iron distribution, respectively. The bright spots representing silica and iron element clearly elucidate a homogenous distribution in nanocomposite.
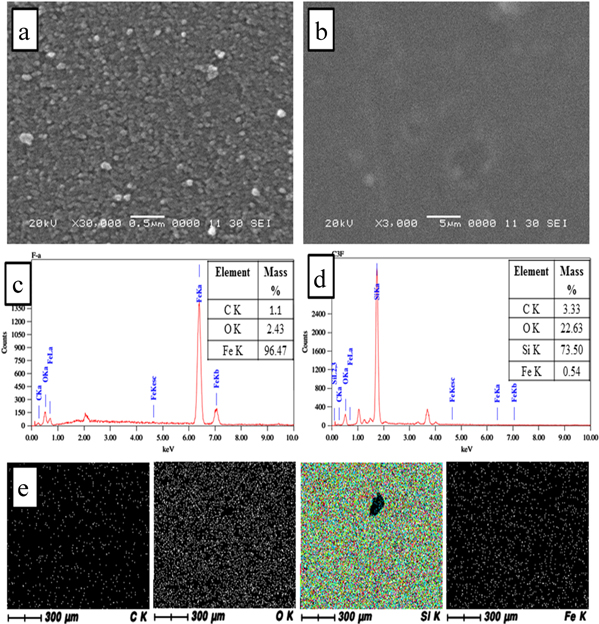
Figure 3. SEM micrograph of Fe3O4 (a), SC/F nanocomposite (b); the EDAX spectra with quantitative elemental composition of Fe3O4 (c) and SC/F nanocomposite (d); and x-ray mapping analysis of SC/F nanocomposite (e).
Download figure:
Standard image High-resolution image3.3. Conformational studies of HRP
UV-Visible spectroscopy was used to investigate the characteristic structures of heme protein; after immobilization of HRP in SC/F nanocomposite shows the soret band at 407 nm, as illustrated in supplementary No 5, which indicates that the enzyme retains its conformational structure. Fluorescence spectroscopy, a more sensitive and versatile technique as compared to UV-Visible spectroscopy is applied to investigate the effect of the sol–gel nanocomposite on the enzyme conformation. The steady state fluorescence of the single tryptophan (Trp) residue within HRP has been shown to provide useful information of the tertiary structure of enzyme including the ability to detect different scales of conformational changes, the unfolding process as well as detachment of the heme active group of entrapped protein. Tryptophan is quenched in native protein owing to its proximity with the heme group and is strongly fluorescent and red shifted upon denaturation of protein. The shape and spectra as well as fluorescence maxima of HRP presented in figure 4(A) in SC composite were similar to the spectrum of HRP in solution, which indicates that hydrophobic environment of Trp remains unaltered and close to heme group upon encapsulation. It specifies that the encapsulation of HRP in silica matrices protects the peroxidase activity. Increase in the florescence intensity without peak displacement was observed in aged gels as compared to solution, which indicates partial detachment of heme group from the active site. Furthermore, the very intense blue shifted band for Trp resulting from incubation of HRP enzyme in the SC/F nanocomposite in Gd-HCL solution and in silica sol is attributed to unfolding of enzyme. This behavior must be a consequence of the high hydration level in porosity leading to conformational changes in enzyme which is generally observed in silica sol–gel matrix.

Figure 4. (A) The fluorescence spectra of silica sol (a), SC composite (b), SC/F nanocomposite (c), the HRP enzyme in potassium phosphate buffer of pH 7.0 (d), the SC/F/HRP nanocomposite incubated in Gd-HCL (e), the HRP enzyme entrapped in the SC/F nanocomposite (f) and in silica sol (g); (B): FTIR spectra of silica (a), chitosan (b), SC1(c), SC2 (d), SC3 (e), HRP in solution (f) and HRP entrapped in SC3F.
Download figure:
Standard image High-resolution imageThe FT-IR spectra of SC hybrid with varied chitosan concentration are shown in figure 4(B). The broad peak at 3286 cm−1 is ascribed to stretching vibration of O–H and N–H in pristine chitosan; intensity decreases with addition of silica attributable to a decrease of the hydroxyl groups resulting from the condensation reaction of chitosan and silica. The spectra for pristine chitosan is shown in figure 4(B(b)) having Amide I (C=O) stretch at 1646 cm−1, C–N stretch at 1616 cm−1and bending due to Amide II (N–H) at 1575 cm−1. Decrease of intensity observed at peak at 1575 cm−1 is due to incorporation of silica which depicts hydrogen bonding of amine group with Si–O of silica. The new peak at 961 cm−1 related to Si–OH is observed owing to the formation of hydrogen bonds between silanol groups of silica and amide and hydroxyl groups of chitosan. The presence of Fe3O4 was affirmed by two strong absorption bands at 600 cm−1 and 437 cm−1, which is assigned to the vibration of the Fe–O bond of Fe3O4, shown in Supplementary No 6. Fe3O4 has extensive hydroxyl group on its surface upon contact with aqueous phase through adsorption of OH- and H+ on Fe and O, respectively, which was confirmed by the broader and more intense OH stretching band. The bands at 1010 cm−1 and 3400 cm−1 illustrate that hydroxyl group is present, which can provide a binding site for organic polymer.
3.4. Study of charge transfer resistivity
Electrochemical impedance is employed for study of impedance of modified electrodes to characterize the stepwise assembly of surface modified electrode. The semicircle part of EIS spectra relates to the electron transfer limited process and its diameter is equivalent to the electron transfer resistance (RCT), which changes the electron transfer kinetics of redox probe at the interface of the electrode. It is well identified that the high frequency region of impedance plot displays a semicircle related to the redox probe of Fe (CN)6 3−/4−, and a Warburg line in the low frequency region which relates to the diffusion of the overall process. The Nyquist plot of modified electrodes, as displayed in Supplementary No 7, reveals that bare GCE electrode exhibited an almost straight line, characteristic of a diffusion limiting process and high electronic conductivity (a). The diameter of semicircle for SC/F nanocomposite (b) is smaller which indicates that SC/F nanocomposite has the ability to transfer electron in between solution and electrode owing to the conductivity of Fe3O4. The SC/HRP nanocomposite (c) having a large diameter of semicircle exhibits the high charge transfer resistivity of material owing to the non-conducting nature of SC composite and to the hindrance of macromolecular bulky structure of HRP enzyme. However, there is obvious decrease in semicircle diameter for SC/F/HRP (d) observed when Fe3O4 nanoparticles were incorporated into the nanocomposite, which suggests that HRP was successfully entrapped in SC/F nanocomposite.
3.5. Direct electrochemistry of HRP
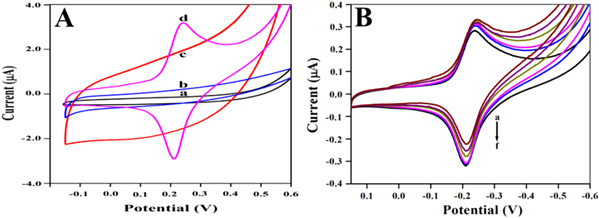
Direct electrochemical behaviors of different modified electrodes were investigated in pH 7.0 potassium phosphate buffer by cyclic voltammetry. The direct electron transfer of HRP on both SC composite and SC/F nanocomposite modified electrodes has been studied with and without HRP, as shown in figure 5(A). Evidently, no peak was observed for bare GCE (a) and SC/F/GCE (b) within the potential window, indicating no electroactive substances on the electrode. A pair of small and unsymmetrical redox peaks was observed for the SC/HRP (c) and reduction peak was greater than oxidation peak, which suggests that direct electron transfer is very slow between HRP and GCE. Inversely, well defined quasi reversible peaks were observed for the SC/F/HRP (d). After incorporation of the Fe3O4 nanoparticles, the redox peak current increases with symmetric peak shape; signifying that the presence of the Fe3O4 nanoparticles facilitates the electron transfer rate. As compared to the SC composite, the Fe3O4 nanoparticles integrated SC/F nanocomposite can provide a favorable microenvironment owing to its attractive structural, mechanical and electronic properties. The presence of Fe3O4 in nanocomposite increases loading of HRP due to its larger surface area and it favors orientation of HRP towards the electrode. Additionally, it acts as an efficient electron transfer tunnel for direct transfer of electron.
Figure 5. (A) Cyclic voltammograms of modified electrode (a) Bare GCE, (b) SC/GCE, (c) SC/HRP/GCE and (d)SC/F/HRP/GCE; (B): The cyclic voltammograms of biosensor response in pH 7.0 potassium phosphate buffer (a-f) with 5.0, 10.0, 15.0, 20.0, 25.0, and 30.0 μM H2O2 at scan rate 0.1 V · s−1.
Download figure:
Standard image High-resolution image
The influence of variable scan rates ( ) on the peak current (ipa) and (ipc) was measured in the range of 0.025 V · s−1 to 0.415 V · s−1 as displayed in supplementary No 8. With increase in scan rate, cathodic and anodic peak current increases simultaneously. Furthermore, peak potentials of HRP shifted in positive and negative directions, respectively. This indicated that electron transfer between HRP is a surface confined and quasi reversible electrochemical process.
The cyclic voltammograms of the modified GCE electrode in potassium phosphate buffer, at pH 7.0, containing different concentrations of H2O2 are shown in figure 5(B). Upon the successive addition of H2O2, the reduction peak current of the immobilized HRP increased, specifying a typical electro-catalytic behavior to the reduction of H2O2. The catalytic reduction peak current increases with the linear calibration equation y = 0.0139 x + 2.7706 [μM] (R2 = 0.9908) in the range from 5.0 to 40.0 μM of hydrogen peroxide (supplementary No 9). The sensitivity of modified electrode is 0.0139 μA μM−1 with a detection limit of 5.0 μM.
The optimum operational pH of the biosensor was also examined. The pH response of biosensor with the SC/F nanocomposite modified electrodes in the presence of a fixed concentration of the substrate H2O2 at varying pH 5–8 is shown in supplementary No 10. The highest biosensor response was observed at pH 7.0 and this was within the optimum range of this enzyme which shows that the Fe3O4 nanoparticles are compatible with HRP enzyme and do not interfere with biological reactions. The optimum pH 7.0 of potassium phosphate buffer was used in further study for the detection of H2O2. A comparison of performance of the fabricated H2O2 biosensor with that of the other reported biosensors has been made and is presented in table 1.
Table 1. Comparison of H2O2 biosensors.
| Performance of the H2O2 biosensors | |||||
|---|---|---|---|---|---|
| Materials | Immobilization Method | Limit of Detection μM | Linear Range mM | Sensitivity μA mM-1 | Ref. No. |
| Halloysite nanotubes, Chitosan | Entrapment | 0.7 | 0.0026–0.075 | 12.25 | [29] |
| Molybdenum disulfide, graphene | Self-assembly | 0.049 | 0.0002–1.103 | 679.7 | [29] |
| KNbO3 Nanoneedle, Chitosan | Adsorption | 12 | 0.04–6 | 750 | [30] |
| Silica sol–gel, CNT | Entrapment | 0.1 | 0.0005–0.3 | — | [32] |
| Silica sol–gel, Fe3 O4 | Entrapment | 5 | 0.005 to 0.04 | 13.9 | Present work |
3.6. Selectivity of hydrogen peroxide biosensor
The selectivity of enzyme electrode is also the foremost property of a biosensor in its practical application. The selectivity of the proposed biosensor was estimated by observing the influence of substances that interfere with the detection of H2O2. The interference study was carried out by using 5 μM H2O2 and 5 μM interference substance. It was found that six interfering substances, uric acid, sucrose, glucose and ascorbic acid did not interfere significantly with the resulting biosensor, indicating that biosensor has sufficient selectivity.
3.7. Reproducibility, repeatability and stability
The reproducibility of the proposed biosensor was investigated by determining 5 μM H2O2 with five biosensors which were fabricated in the same condition. The relative standard deviation (RSD) of 3.8% was achieved, which designated that the biosensor had good reproducibility. To examine the repeatability of biosensor, five biosensors made up independently under the same procedure were utilized six times constantly; RSD of 4.2% was observed. It indicated that the biosensor had good reversibility. Stability is a crucial parameter for the analytical application of the biosensor. The stability of the biosensor was examined with a prepared biosensor stored for three weeks at 4 °C which showed current response decreased by about 6%. It revealed that the developed biosensor possessed good stability.
4. Conclusion
Fe3O4 nanoparticles prepared by the co-precipitation method have been successfully incorporated in SC sol–gel matrix and HRP has been entrapped for fabrication of third generation biosensor. The large surface area and porous morphology of SC nanocomposite led to a high loading of enzyme and the immobilized enzyme could retain its biofunctionality. Furthermore, SC/F/HRP/GCE electrode exhibited an electro-catalytic activity towards H2O2 reduction without the aid of a mediator. The sensor displays excellent selectivity, sensitivity, good reproducibility and long-term stability. The proposed strategy can significantly enhance direct electron transfer and also renders great potential for fabrication of mediator-free enzyme based third generation electrochemical biosensors.