
Abstract
A single-source molecular precursor (SSP), ([Cl2Sn(μ-OtBu)2ZnCl2(bpy)]), was designed, developed, and subsequently used in a sol–gel process for the synthesis of SnO2/Zn2SnO4 nanocomposite at pH 9 adjusted by using a NaOH solution. The pre- and post-sintering IR spectra revealed the presence and absence, respectively, of the OH group. The powder XRD confirms the formation of the single crystalline ZnSn(OH)6 phase before sintering. However, the sintered product is composed of coupled oxides, i.e. the binary SnO2 and ternary Zn2SnO4. The scanning electron microscope (SEM) images taken after sonicating the SnO2/Zn2SnO4 powder show the macroporous texture of the powder. The uniformly sized particles are in two different morphological forms, i.e. cubic and spherical. The energy-dispersive x-ray (EDX) spectroscopy confirms the elemental composition of the SnO2/Zn2SnO4 nanocomposite (Zn:Sn:O = 2:2:6). The photocatalytic efficiency of the SnO2/Zn2SnO4 nanocomposite was tested by using the dye Sudan Red B a colorant used in red chilies. More than 82% of the dye degraded after 120 min of exposure to the UV light. The efficient photocatalytic activity is attributed to the better electron/hole pair separation which resulted from the coupling of Zn2SnO4 and SnO2 at the molecular level and produced efficient grain boundary interfaces.
Export citation and abstract BibTeX RIS
1. Introduction
Nanostructured materials are now of great interest to every field of science from biology to physics, chemistry, engineering, and medicine. This exponential rise in interest is due to the ubiquitous impact of particle size, shape, and architecture in the nano domain upon the physico-chemical properties of materials. It is now well proven that the transformation of particle size of a material from bulk to nano could introduce completely new and different properties. This could be well demonstrated by NiO, which is antiferromagnetic in bulk but has permanent magnetic moment (ferromagnetic) when its particle size is at the nanometer level scale [1]. The changing properties with the changing particle size from bulk to nano of the same material motivated us to consider methods for transforming the classical materials into nanomaterials as a means of obtaining more dynamic and efficient systems for practical applications.
Transparent conducting oxides (TCOs) are no exception to the change brought about by the miniaturization (in the nano domain ∼1–100 nm) of the particle size to produce the enhanced characteristics. Nanomaterials of the well-known TCOs (especially the binary oxides) have already been produced and used for practical applications in different fields. The binary TCOs which are produced in different morphological forms include, besides others, the ZnO [2], SnO2 [3], TiO2 [4], and CuO [5]. Apart from the binary TCOs, ternary oxides have also been reported and applied widely [6]. Contrary to the binary TCOs, the ternary (mixed) TCOs match better with the properties required for new applications. For example, the light-harvesting efficiency of solar cells using SnO2 as anodes could be enhanced from 13.5 to 15.8% by mixing SnO2 and ZnO to get Zn2SnO4 as anode material [7]. The mixed TCO, zinc stannate (ZTO), has shown fascinating characteristics including high electron mobility, high electrical conductivity, high optical transparency, and high resistance to acidic and basic media [8].
(Zn2SnO4 (ZTO) is a semiconductor of wide bag gap energy (Eg) in the range of 3.2–4.1 eV [9]. Mario et al [10] demonstrated that the Eg of ZTO, depends not only on factors including particle size and shape as reported elsewhere [11] but also upon the stoichiometry of the resulting compound. Owing to its tunable wide Eg, ZTO has found wide spread applications in devices like gas sensors [12], solar cells [13], Li ion batteries [14], and photocatalysis [15]. Previously, ZTO has been extensively used in photocatalysis for the photo-induced degradation of different water soluble dyes [15]. However, the efficiency of ZTO as photocatalyst is affected by the fast electron–hole pair recombination. It is reported for many photocatalysts that the electron–hole pair recombination could be successfully suppressed by coupling the different photocatalysts, and subsequently, the increase in their photocatalytic efficiency has been observed [16]. Jia et al very recently reported Zn-doped coupled SnO2/ZTO nanocomposite prepared by two-step hydrothermal synthesis [17]. They showed that due to the enhanced charge transfer, the Zn-doped SnO2/ZTO coupled system is more efficient in photodegradation of methylene blue (MB) than the pure ZTO [17]. ZTO crystallizes in the orthostable cubic spinel structure which could be obtained at high temperature. However, this method does not ensure pure ZTO but instead a mixture of compounds (ZnSnO3, Zn2SnO4 and SnO2). The literature reports ZTO nanomaterials produced in different forms including nanoparticles [6], 1D nanowires [18], 3D hierarchical nanostructures [19] and so on.
Different methods have been used to synthesize ZTO nanostructures. Wang et al [20] reported 1D nanostructures of ZTO by thermal evaporation. Although the method is simple, the processing temperature (800 °C) is very high. Mario et al [10]. Synthesized ZTO by hydrothermal method and reported upon its photoelectrochemical properties. It has been observed that the stoichiometry of the resulting ZTO is not exact and, therefore, variations in the Eg have been observed.
The hydrothermal method is highly versatile, giving different nanostructures when the processing parameters are changed. The main concerns, however, are control over stoichiometry and the emergence of relatively larger-size particles of the resulting nanomaterials. Synthesis of ZTO by solid-state heating of ZnO and SnO2 has been reported, although the method has the drawback of ZnO evaporation at higher temperatures [21]. Thermal evaporation of Zn and Sn metals or ZnO and SnO2 have been exploited in a synthesis method for the preparation of ZTO [22].
All these methods, however, have drawbacks which hinder control over the microstructure of the resulting ZTO nanomaterial. In contrast, the sol–gel method, has many advantages, including a processing setup that is simple and economical, high purity of the resulting nanomaterials, low first-step and, subsequently, sintering temperatures (∼200–600 °C), and control over particle size, shape, and distribution [23]. The advantages of sol–gel processing can be realized only if suitable precursors having high purity and controllable hydrolysis kinetics are available. The inorganic salts conventionally used as precursors present many drawbacks and problems. The sol–gel processing of inorganic salts as precursors requires complex and expensive equipment, yields nanomaterials with inhomogeneous particle sizes and shapes, and requires high processing and post-processing temperatures. Veith [24] reported that molecular single-source precursors (SSP) can be used to strategically prepare metal oxide nanomaterials with controlled particle size, shape, and structure. Molecular SSP inherited structural unit, which is also an integral part of the resulting nanomaterial, having the elemental composition in the required ratio. Consequently, it allows better control over the reaction kinetics by changing the processing parameters and yields nanostructures characterized by high purity, homogeneity in particle size and shape, and crystal structure.
It is pertinent to mention here that previously only one report has shown successful synthesis of the SSPs for ZTO nanomaterials [25]. However, it is also important to mention that the SSPs reported have not been processed by the sol–gel method to produce ZTO nanomaterials but instead have been decomposed only in a tube furnace.
In this paper we report a bimetallic SSP which is structurally characterized by spectroscopy (IR, 1H- and 13C-NMR) and elemental analysis. The structurally characterized bimetallic compound is used as a SSP in the sol–gel method to prepare ZTO nanomaterial in powder form. To the best of our knowledge, no such molecular compound has been synthesized and used in the sol–gel method for the synthesis of ZTO nanomaterial.
2. Experimental
2.1. Materials
All the synthesis work of the molecular metal organic compounds (the SSP) was carried out under a stringently controlled air- and moisture-free environment by using a standard Schlenk vacuum line in a dry nitrogen (N2) environment. The chemicals and solvents were purchased from commercial suppliers. The salts ZnCl2, SnCl4, and NaOH were purchased from Sigma-Aldrich Company and used without further purifications or treatment. The tert-butanol (HOtBu), and iso-propanol (HOiPr) were obtained from a local supplier, dried by distillation from magnesium (Mg) turnings, and stored in a N2 environment and molecular sieves. The solvent diethyl ether (Et2O) was provided by a local supplier, distilled from sodium (Na) wires, and stored in a N2 environment. 2, 2-bipyridine from Panreac Inc. was used as received. Doubly distilled water was used during the processing. We used Sudan Red B dye from Aldrich Company.
2.2. Methods
2.2.1. Characterization
The elemental compositions (CHN) of the compound(s) were determined by CHN analyzer (Leco); the chlorine contents were obtained from argentometric titrations [26, 27]. The solid-state Fourier transform infrared spectra (FT-IR) were identified by using the Nicolet 6700 from Thermo Scientific Company in ATR mode. 1H- and 13C-NMR spectral analysis were carried out in an appropriate solvent (DMSO–d6) by using the Bruker Avance Ultra-Shield 300 MHz digital NMR instrument from the with tetramethylsilane (TMS) as an internal standard. Thermogravimetricanalysis (TGA) was carried out by using a Netzsch Sta 409 TGA/DSC analyzer and heating the samples at the rate of 10 °C min−1 in a nitrogen atmosphere at temperatures ranging from 25–800 °C. The powder XRD patterns of the resulting nanomaterials were obtained by using a 3040/60 XPert PRO Diffractometer equipped with Cu-Kα radiations (λ = 1.54 Å). The UV-visible spectra of the different products and the photocatalytic study of the Sudan Red B dye was carried out by using a spectrophotometer from Schimadzu (Model Pharma Spec UV-1700) and quartz cuvettes from the same company.
The surface images of the nanoparticles were taken by means of scanning electron microscopy (SEM) using a SEM analyzer from Jeol (JSM-6490A) company in Japan. The JFC 1500 EDX analyzer from the same company Jeol (JFC 1500) was used in SEM mode to determine the elemental composition of the resulting nanomaterials.
2.3. Synthesis
2.3.1. Synthesis of SSP ([Cl2Sn(μ-OtBu)2ZnCl2(bpy)]) 1
2.482 g (4.45 mmol) of [Cl2Sn(OtBu)2]2 2, synthesized by following the reported procedure [28] in 50 mL dry tetrahydrofuran (THF) was slowly added into a THF solution (50 mL) of 1.301 g (4.45 mmol) of ZnCl2(2,2'-bipy) 3, also synthesized by following the reported procedure [29] under dry gaseousN2 and refluxed at 180 °C for 12 h. After completion of the reaction, the solution was concentrated by removing the solvent under low pressure, and stored in a freezer at low temperature. After standing overnight in the refrigerator, the solution produced clear crystals of the target compound. The crystals were separated from the solvent by cannula filtration and dried under low pressure by using a vacuum pump. The yield of separated clear crystals was very good (73%).
FT-IR (cm−1): 3107–3060 (str.; Ar-H), 2992–2908 (str.; CH3), 1595 (str.; C=N), 1472 (str.; C=C), 1311–1249 (ben.; CH3), 1158 (str.; C – O), 513 (str.; Sn – O), 502 (str.; Zn – N), 428 (str.; Zn – O), 339 (str.; Zn – Cl), 290 (str.; Sn – Cl). 1H-NMR (DMSO-d6): δ(ppm): 3.397 (CH3, bridging), 7.688 (CH, at C2), 8.219 (CH, at C1), 8.628 (CH, at C4). 13C-NMR (DMSO-d6) in δ (ppm): 122.45 (C2), 126.69 (C4), 140.65 (C3), 149.05 (C1), 150.51 (C5). Elemental composition (calculated) of C18H26Cl4N2O2SnZn: 35.01 (34.41), 4.09 (4.17), 4.37 (4.46), 22.43 (22.57).
2.3.2. Synthesis of ZTO nanoparticles
The ZTO nanoparticles were prepared by following the sol–gel protocol in a N2 environment. An appropriate amount of 1 was dissolved in iso-propanol to produce a transparent solution. To this solution we steadily and slowly added an equimolar amount of doubly distilled water. The pH of the solution was increased by using NaOH and the white precipitate was obtained at pH = 9 and filtered off by means of cannula filtration. The resulting ZTO powder was washed with ethanol and then several times with distilled water. The resulting ZTO powder was first dried under low pressure by using a vacuum pump and then dried in an oven at 80 °C for three hours. The as-prepared ZTO powder was sintered at 500 °C for four hours in a muffle furnace. The white powder obtained was stored in a dry and clean vial for further use.
2.3.3. Photocatalytic degradation of Sudan Red B
The photocatalytic efficiency of the SnO2/ZTO (nano)powder was tested by the photo-induced degradation of Sudan Red B dye under UV lamp. The photocatalytic reactor was designed as per the reported literature [30]. A stock solution of the dye was prepared by dissolving 0.38 g of Sudan Red B in 100 mL of pre-distilled chloroform. An appropriate volume was taken from the stock solution, and was diluted by adding chloroform to get 1.0 × 10⁻⁵ M resulting solution. An appropriate amount of the dye solution was taken, and was maintained at 25 ± 2 °C. To the 100 mL fraction of the dye solution was added 0.25 g of the ZTO nanomaterial, and the mixture was sonicated for 15 min, and then was stirred magnetically in dark for 30 min to establish adsorption/desorption equilibrium. A required amount was taken from this solution, filtered by milli-pore filter to remove the suspended particles of the ZTO catalyst, and was measured its UV spectrum termed as blank. Then the ZTO containing dye solution was irradiated using UV lamp (300 W high pressure Hg lamp with a maximum emission at about 365 nm). A required amount was taken from the irradiated solution after 30 min, filtered with milli-pore filter paper, and measured its UV spectrum. The required eliquates were taken after 60 min, 90 min, and 120 min from the same irradiating solution, and the UV spectra were obtained for them after filtration.
3. Results and discussion
3.1. Synthesis and characterization of 1
The synthesis of the target compound 1 was carried out by the reaction of 2 and 3 in THF, whereas the compounds 2 and 3 were synthesized by following the previously reported protocols [28, 29]. The elemental composition data of the compounds 1, 2, and 3 were obtained by using the CHN analyzer. The chlorine contents of the compounds 1, 2, and 3 were determined by argentometric titrations [26, 27]. The organic moieties of the compounds 1, 2, and 3 were confirmed by IR and NMR spectroscopies. Compound 3 has previously reported and its crystal structure has been determined [31]. The infrared (IR) spectrum of 3 has vibrational bands which match well with reported values, thus confirming its successful synthesis [32]. The IR spectrum of 2 gives stretching vibration bands at 2961 cm−1 and 2873 cm−1, 1259 cm−1, 513 cm−1, and 402 cm−1 for the C–H, C–O, Sn–O, and Sn–Cl bonds, respectively. In the IR spectrum of the 1 band for Zn–O stretching vibration has been observed, whereas the Sn–O stretching vibration band shifted to a lower value of 513 cm−1 from 552 cm−1. This indicates that dichloridotin tert-butoxide acted as a bindentate ligand to produce a bimetallic compound of zinc and tin having a central four-membered Sn(O)2Zn ring. The other vibrational bands for the bonds C–H, C–O, Sn–O, Sn–Cl, Zn–N, Zn–Cl, etc, have also been observed in the IR spectrum of 1. The organic moieties of the compounds 1, 2, and 3 were also confirmed by the 1H- and 13C-NMR spectroscopy (table 1). The 1H-NMR spectrum of 1 has peaks at 8.640 ppm, 8.616 ppm, 8.219 ppm, and 7.688 ppm for the protons at C2, C5, C4, and C3 of the 2, 2'-bipyridyl moiety, respectively. The relative integration of the 1H NMR spectrum has the exact ratio of 1:1:1:1 for the four different protons of the 2, 2'-bipyridyl moiety (figure 1). The 1H-NMR spectrum of 1 also has a peak at 3.397 ppm, which might be due to the methyl proton of the tert-butoxy moiety. Normally, the methyl proton of tert-butoxy moiety appears at the upfield. However, the shift in the peak for the methyl proton of the tert-butoxy moiety might be due to the bridging of the tert-butoxy group between the two metal centers. It has been seen in many compounds having the four membered metal(s) oxygen rings (M2O2) that the peaks shift strongly to the downfield as a result of bridging [33]. The methyl protons in the 1H NMR spectrum of 2 give two peaks at 3.911 ppm and 1.181 ppm for the bridging and terminal tert-butoxy groups, respectively [33]. However, the peak at the upfield is absent in the 1H NMR spectrum of 1, indicating the formation of a bimetallic complex in which only the bridging tert-butoxy group is present. The intense peak at 2.545 ppm in the 1H-NMR spectrum of 1 is due to the solvent DMSO. The 1H-NMR spectrum of 3 corresponds to those previously reported [34].
Table 1. 1H- and 13C-NMR data for the compounds 1, 2, and 3.
| 1H NMR (ppm) | |||||||||
|---|---|---|---|---|---|---|---|---|---|
| 1 | 8.627 | 8.599 | 8.203 | 7.677 | 2.505 | — | |||
| 2 | — | — | — | — | 3.911 | 1.181 | |||
| 3 | 8.631 | 8.603 | 8.207 | 7.679 | — | — | |||
| 13C NMR (ppm) | |||||||||
| Comp. | C1 | C2 | C3 | C4 | C5 | CH3 (bri.) | CH3 (ter.) | C (bri.) | C (ter.) |
| 1 | 122.45 | 126.69 | 140.65 | 149.05 | 150.51 | 25.14 | — | 70.41 | — |
| 2 | — | — | — | — | — | 24.99 | 24.44 | 71.87 | 69.22 |
| 3 | 122.34 | 126.56 | 140.52 | 149.12 | 150.66 | — | — | — | — |

Figure 1. 1H-NMR spectrum of compound 1.
Download figure:
Standard image High-resolution imageThe 13C-NMR spectrum of 3 produces five peaks in the range 122–50 ppm corresponding to the five chemically different carbons of the 2, 2'-bipyridyl moiety. The 13C-NMR spectrum of 2 gives two pairs of peaks at 71.87 ppm and 69.22 ppm and 24.99 and 24.44 ppm for the carbons of the alkoxy group. The different peaks for the same carbon are a clear indication of the presence of bridging and terminal alkoxy moieties. These peaks confirm that the compound 2 is dimeric in nature. The peaks at 71.87 ppm and 24.99 ppm are for the bridging α-carbon and methyl carbon, whereas the peaks at 69.22 ppm and 24.44 ppm are for the terminal α-carbon and methyl carbon, respectively. The 13C-NMR spectrum of 1 produces five peaks in the range of 120–150 ppm corresponding to the carbons of the 2.2'-bipyridyl moiety attached to the zinc metal center, whereas two other peaks appear at 70.41 ppm and 25.14 ppm. These last two peaks might be due to the α-carbon and methyl carbon, respectively, of the tert-butoxy group. Contrary to the 13C-NMR spectrum of 2, the 13C-NMR spectrum of 1 produces only two peaks at relatively low field indicating that the tert-butoxy moiety is bridged between the tin and zinc metal centers.
The thermal degradation of compound 1 was studied by using TGA. The thermogram (figure 2) shows a small weight loss at around 100 °C. This might be due to the removal of adsorbed solvent molecules. The main weight loss could be observed in the thermogram of 1 in the temperature range of 400–600 °C. Approximately 72% weight loss is observed in the thermogram of 1 in the above-mentioned temperature range. This indicates that the organic moieties and the chlorides are lost in this temperature range. The decomposition temperature range is a bit higher than for the previously reported pure alkylmetalalkoxides [35]. The higher decomposition temperature range could be attributed to the presence of chlorides, which normally are lost at higher temperatures. The relatively higher degradation temperature indicates the thermal stability of the compound 1 compared to the previously reported temperature [35].

Figure 2. TGA thermogram obtained by the thermal degradation of 1.
Download figure:
Standard image High-resolution image3.2. Preparation and characterization of ZTO nanomaterial
The structurally characterized zinc-tin (pseudo) alkoxides were hydrolyzed by using a standard sol–gel protocol to produce the resulting ZTO nanomaterial. The hydrolysis was carried out in a controlled (N2) environment by adding an equimolar amount of distilled water to the iso-propanol solution of 1. After completion of hydrolysis, condensation, and the gelation process, the ZTO gel was dried in common laboratory oven and then sintered at 500 °C temperature in a muffle furnace. The pre- and post-sintering ZTO nonmaterials were characterized by powder XRD before and after sintering. Figure 3 shows the XRD patterns of the non-sintered (above) and sintered ZTO (below).
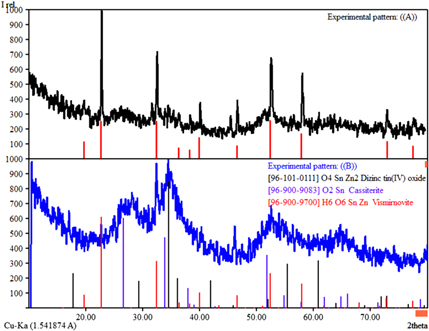
Figure 3. XRD pattern of ZTO before sintering (above), and after sintering at 500 °C (below).
Download figure:
Standard image High-resolution imageThe XRD pattern of the pre-sintering ZTO material produces peaks which match well with the XRD pattern of single crystalline cubic phase zinc–tin hydroxide (ZnSn(OH)2)[PDF: 96-900-9700]. The search and match was performed by using the match software for crystal impact (free version). The XRD pattern of the pre-sintering ZTO also corresponds to the XRD patterns reported for ZnSn(OH)2 in the literature [36]. However, the XRD pattern of the post-sintering ZTO sample has peaks corresponding to those for SnO2 [PDF: 96-900-9083], and Zn2SnO4 [PDF: 96-101-0111]. The peaks are relatively broader, which indicates the incomplete crystallization of SnO2 and Zn2SnO4. The crystallization could be significantly improved by increasing the sintering temperature and/or heating time. That study is underway and the results will be disseminated latter.
The formation of ZnSn(OH)2 as a result of hydrolyzing
1 in a controlled environment (N2) could be attributed to the basic structural unit inherited by the molecular compound
1 and retained by the resulting ZTO material (scheme

Scheme 1. Illustration of the synthesis of ZnSn(OH)6 and SnO2/Zn2SnO4 by the sol–gel technique.
Download figure:
Standard image High-resolution imageThe pre- and post-sintering ZTO nanomaterials were studied by IR spectroscopy. The IR spectra are given in figure 4. The IR spectrum of the as-synthesized ZTO material has a broad peak around 3060 cm−1 due to the O–H stretching vibration [37]. The inset in figure 3 shows the region of 1000–400 cm−1, which is peculiar for the M–O, M–O–M and O–M–O vibrations. The peaks appearing in this region are due to the vibration of Sn–O, Zn–O, O–Sn–O, O–Zn–O, and Zn–O–Sn [38]. The O–H vibrational peaks are absent in the post-sintering sample, indicating that the hydroxides have been converted into oxides. A new and broad peak appears at 661 cm−1 in the IR spectrum of the sintered sample. This peak corresponds to the individual SnO2 as per the reported literature [39]. The peaks in the range of 550–400 cm−1 are those of Sn–O, Zn–O, Zn–O–Sn, and O–Sn–O and O–Zn–O [38]. The peaks in this region are more intense for the sintered sample than for the pre-sintering sample. The IR results are in accordance with the XRD results which predict the formation of SnO2/Zn2SnO4 nanocomposite.

Figure 4. IR spectra of ZTO nanomaterials before sintering (NS; red), and after sintering at 500 °C (S; black).
Download figure:
Standard image High-resolution imageThe morphology of the resulting ZTO materials was investigated by using SEM. The SEM micrographs are given in figures 5(a), (b) for the ZTO material before and after sintering, respectively. The SEM micrograph of the as-synthesized sample gives inhomogeneous (in size and shape) nanoparticles of the ZTO. Although some larger-size monolithic particles could be seen in the SEM image of as-synthesized ZTO, most of the particles were smaller in size than 20 nm (figure 5(a)). ZTO after sintering had larger particles as shown in the SEM images (figure 5(b)). The increase in particle size upon sintering is evident because the particles grow in size upon heating. The particles are nearly uniform in size and have oval (elongated) shapes. However, a very few cubic particles could also be observed. The cubic particles are considerably larger in size than the deformed spherical particles (figure 5(b)).
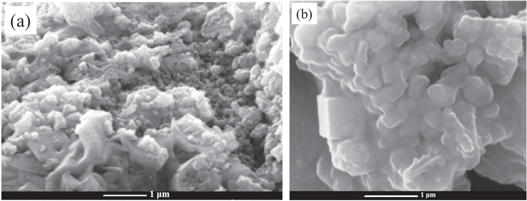
Figure 5. SEM images of ZTO before (a), and after sintering (b).
Download figure:
Standard image High-resolution imageThe elemental compositions of the ZTO samples before and after sintering were determined by using EDX spectroscopy; the spectra are given in figures 6(a) and (b), respectively. Besides the basic elements Zn, Sn, and O of ZTO, the EDX spectrum of the pre-sintering sample shows peaks for the carbon as impurity. Since we know that the ZTO material is derived from a metal–organic molecular complex, the existence of carbon as an impurity in the pre-sintering ZTO sample is inevitable. However, the percent concentration of carbon in the resulting ZTO sample is very low. The EDX spectrum of the post-sintering ZTO sample gives peaks only for the essential elements, i.e. Zn, Sn, and O (figure 6(b)). The chemical composition of the post-sintering sample was determined from the atom percent and the mass percent obtained from the EDX spectrum.

Figure 6. EDX spectra of ZTO before (a), and after (b) sintering.
Download figure:
Standard image High-resolution imageThe Zn, Sn, and O are present in the ratio of 1, 1, and 3, respectively. The atom percent composition of the post-sintering samples determined by EDX confirms the formation of SnO2/Zn2SnO4 nanocomposite.
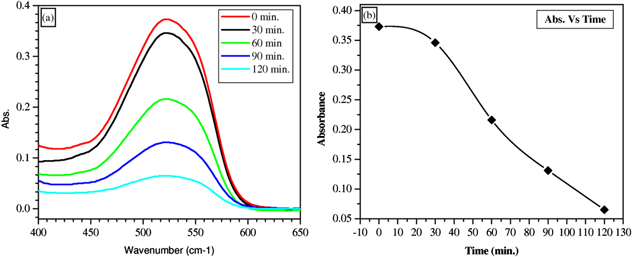
The post-sintering SnO2/ZTO material was tested as a heterogeneous photocatalyst for the photo-induced degradation of Sudan Red B dye. The Sudan Red B dye was selected for the study because of its increasing illegal use as a colorant in chilies, powder, and solutions due to its low cost, although it is highly carcinogenic as per the EU standards [40]. Figure 7(a) shows the photodegradation of Sudan Red B using the post-sintering ZTO sample. As can be seen in figure 7(a), after 120 min the dye is nearly decomposed. It has been determined that more than 82% of Sudan Red B dye decomposes after 120 min of exposure to UV light. The decrease in dye absorbance as a function of time is plotted and shown in figure 7(b). From figure 7(b) it is clear that the degradation is faster in the time range of 30–0 min whereas it is comparatively slow in the very beginning and at the end of the photo-induced degradation process. This could be due to the high and very low concentrations of dye in the beginning and at the end, respectively, of the process.
Figure 7. Photodegradation of Sudan Red B dye by using post-sintering ZTO (a); absorbance as function of time (b).
Download figure:
Standard image High-resolution image
4. Conclusion
It is a well-accepted fact that the microstructure of the resulting nanomaterials could be controlled at the atomic level by using a suitable SSP, which is highly desirable. A molecular compound, [Cl2Sn(μ-OtBu)2ZnCl2(bpy)] 1 was synthesized by employing state-of-the-art Schlenk vacuum-line technique. The structural characterizations of the compound revealed that the two metal centers, i.e. Zn and Sn, are associated through oxygen bridging, forming a skeleton in the form of a four-membered ring, Zn(O2)Sn. The TGA revealed that the compound undergoes decomposition upon heating in the temperature range of 400–600 °C. The sol–gel processing of 1 produces a single crystalline ZnSn(OH)6 which upon sintering at 500 °C decomposes to a two-phase ZTO nanomaterial, a binary SnO2 and ternary Zn2SnO4. The conversion of ZnSn(OH)6 upon sintering to SnO2/Zn2SnO4 nanocomposite was confirmed by using IR spectroscopy and powder XRD. The morphology of the pre-sintering sample (ZnSn(OH)6) is different from that of the post-sintering sample (SnO2/Zn2SnO4). The transformation in morphology as a result of sintering is evident since the composition of the material changed, and the crystal structures changed as well. The elemental composition of the pre- and post-sintering samples revealed the compositions of the ZnSn(OH)6 and SnO2/Zn2SnO4 nanomaterials. The SnO2/Zn2SnO4 nanomaterial was used as the photocatalyst for photo-induced degradation of Sudan Red B dye. It has been observed that more than 84% of the dye is degraded in 120 min when using the indigenously synthesized SnO2/Zn2SnO4 photocatalyst. Furthermore, it has been observed that the degradation rate is faster beyond 30 min This might be due to the depleting concentration of the dye with time. In summary, a biphasic SnO2/Zn2SnO4 nanocomposite was synthesized, characterized, and applied as a photocatalyst from a structurally characterized molecular SSP in a simple sol–gel process.