

Abstract
We have investigated the interlayer shear and breathing phonon modes in MoS2 with pure 3R and 2H stacking order by using polarization-dependent ultralow-frequency Raman spectroscopy. We observe up to three shear branches and four breathing branches in MoS2 with thickness from 2 to 13 layers. The breathing modes show the same Raman activity behavior for both polytypes, but the 2H breathing frequencies are consistently several wavenumbers higher than the 3R breathing frequencies, signifying that 2H MoS2 has slightly stronger interlayer lattice coupling than 3R MoS2. In contrast, the shear-mode Raman spectra are strikingly different for 2H and 3R MoS2. While the strongest shear mode corresponds to the highest-frequency branch in the 2H structure, it corresponds to the lowest-frequency branch in the 3R structure. Such distinct and complementary Raman spectra of the 3R and 2H polytypes allow us to survey a broad range of shear modes in MoS2, from the highest to lowest branch. By combining the linear chain model, group theory, effective bond polarizability model and first-principles calculations, we can account for all the major observations in our experiment.
Export citation and abstract BibTeX RIS
1. Introduction
Molybdenum disulfide (MoS2) is the most commonly studied two-dimensional (2D) transition metal dichalcogenide (TMD). Monolayer MoS2 exhibits a S–Mo–S trigonal prismatic (1H) structure with a lack of inversion symmetry (figure 1). The non-centrosymmetric crystalline structure, combined with 2D quantum confinement and strong spin–orbit coupling, produce many remarkable properties in monolayer MoS2, including the direct band gap [1, 2], spin-valley coupling [3], optical harmonic generation [4, 5], magnetoelectricity [6], and piezoelectricity [7]. Beyond monolayer, MoS2 commonly exhibits the hexagonal 2H stacking order, in which the adjacent layers are rotated by 180° and stack directly upon one another (figure 1). For even numbers of layers, 2H MoS2 restores the inversion symmetry and hence loses many interesting valleytronic, piezoelectric and nonlinear optical properties [4, 5, 7–9]. This greatly limits the applications of MoS2. Fortunately, MoS2 hosts another stable polytype with the rhombohedral 3R stacking order, in which the adjacent layers displace slightly from each other without any rotation [10, 11] (figure 1). This distinct polytype can break the inversion symmetry, and hence retain excellent valleytronic, piezoelectric and nonlinear optical properties, for all layer numbers [10–14]. In addition, 3R MoS2 shows superior catalytic properties to 2H MoS2 [15] and can possibly host distinctive excitonic states [16]. These recent developments have stimulated much scientific interest in 3R MoS2.
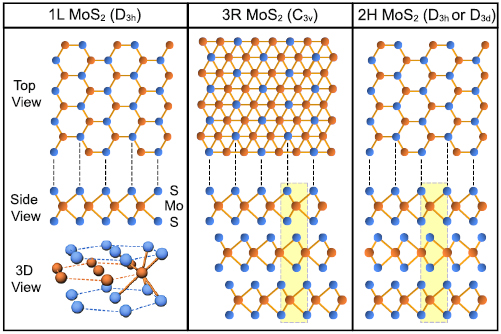
Figure 1. The crystalline structure of monolayer MoS2, few-layer 3R and 2H MoS2 polytypes. The top (bottom) column shows the top (side) view of the crystals. The dashed boxes highlight the interlayer atomic alignment. 3R MoS2 has the non-centrosymmetric point group C3v for all layer numbers. 2H MoS2 has the D3h (D3d) point group for odd (even) layer numbers.
Download figure:
Standard image High-resolution imageAlthough 3R MoS2 atomic crystals exhibit attractive properties, there is a lack of efficient and reliable methods to characterize their layer number and stacking order. Conventional methods such as transmission electron microscopy, x-ray diffraction, and scanning probe measurements cannot determine both the layer number and stacking order accurately for multi-layer crystals; they are also difficult to apply to microscale samples. In this respect, Raman spectroscopy of interlayer phonons can provide rapid and nondestructive identification of the layer number and stacking sequence. 2D materials generally exhibit two types of interlayer phonon modes, namely the shear (S) and breathing (B) modes, which arise from interlayer vibrations with tangential and vertical layer displacement, respectively. As they are generated entirely by interlayer coupling, the interlayer phonons are highly sensitive to the layer thickness [17], stacking order [18], and surface environment [19]. Therefore, ultralow-frequency Raman spectroscopy of interlayer phonons has been widely applied to characterize the interlayer coupling and stacking structure in many 2D materials, including graphene [17–26], TMDs [27–61], boron nitride [62, 63], and black phosphorene [64–68]. Researchers have just recently studied the interlayer Raman modes in 3R TMD atomic crystals [56–61]; however, the results are ambiguous because they used either natural crystals or samples grown by chemical vapor deposition (CVD), both of which contain random mixture of different stacking sequences. To this point, a comprehensive investigation of interlayer phonons in pure 3R MoS2 atomic crystals is still lacking.
Here, we report a comparative Raman study of interlayer phonon modes in pure 3R and 2H MoS2 atomic crystals with thickness from 2 to 13 layers. We observe up to four breathing branches and three shear branches in the low-frequency Raman spectra. The interlayer shear modes exhibit distinct layer-number dependence and branch dependence between the 3R and 2H polytypes. While 2H MoS2 exhibits the strongest Raman signal in the highest-frequency shear branch, 3R MoS2 exhibits the strongest Raman response in the lowest-frequency shear branch. Such opposite Raman behavior reflects the different crystal structure in the 3R and 2H phases. On the other hand, the breathing modes exhibit similar layer-number and branch dependence for both polytypes, but the 2H breathing modes are consistently higher in frequency (~3 cm−1) than the 3R breathing modes. This result indicates a small but detectable difference in the interlayer coupling strength between the 3R and 2H stacking order. We can explain all major observations by a combined analysis of the linear chain model, group theory, effective bond polarizability model and first-principles calculations.
2. Experimental methods
We fabricated 2H and 3R MoS2 samples with layer number N = 1 to 13 (labeled as 1L–13L) by mechanical exfoliation of bulk crystals onto Si/SiO2 substrates. We used natural 2H MoS2 crystals from HQ Graphene Inc, and grew 3R MoS2 single crystals by the chemical vapor transport (CVT) method [11]. In the synthesis of 3R MoS2 crystals, we used MoCl5 as the transport agent. The stoichiometric amount of Mo:S:MoCl5 is 9:20:1 and the total mass is 450 mg. They were sealed in an evacuated 20 cm-long quartz tube under vacuum of 10–6 Torr. The tube was placed in a three-zone furnace. The reaction zone was pretreated at 850 °C for 30 h with the grown zone at 900 °C. The reaction zone was then programed at a higher temperature 1060 °C with the growth zone at a lower temperature 920 °C for six days to provide a temperature gradient for the crystal growth. Finally, the furnace was naturally cooled down to room temperature and the 3R MoS2 single crystals were collected in the growth zone. Our crystals show uniform 3R stacking order with almost no mixture of other phases. Such high-quality 3R MoS2 crystals enable us to exfoliate atomically thin layers with pure 3R stacking order.
We measure the Raman spectra of MoS2 samples using a commercial Horiba LabRam HR Raman microscope in the back-scattering geometry at room temperature. The excitation light source is a 532 nm continuous laser. The incident laser power on the samples was below 1 mW, with a spot diameter of ~1 µm. We measure both unpolarized and polarized Raman spectra. In the former case, we collect Raman signals of all polarizations. In the latter case, we excite the samples with either horizontally (H) or vertically (V) polarized laser and collect the Raman signals at only the vertical (V) polarization. Correspondingly, we obtain the parallel-polarized (VV) and cross-polarized (HV) Raman spectra. The shear modes in MoS2, being doubly-degenerate, have 2D group representations with finite diagonal and off-diagonal elements in their Raman tensors; they are therefore observed in both the VV and HV geometries. But the breathing modes, being non-degenerate, have 1D group representations with only diagonal elements in the Raman tensors; they only appear in the VV geometry.
3. Experimental results
We first present the unpolarized Raman spectra of 3R and 2H MoS2 bilayers, the simplest pair to compare the two polytypes (figures 2(a) and (c)). Both polytypes exhibit a shear mode and a breathing mode, but their spectra show two different features. First, while the frequencies of their shear modes are nearly the same (22 cm−1), the 3R breathing mode (37 cm−1) is lower in frequency than the 2H breathing mode (40 cm−1). This implies that the 3R layers are less strongly bound than the 2H layers. Second, the intensity ratio between the breathing and shear modes is much higher in 3R MoS2 than in 2H MoS2. The breathing-mode peak intensity is ~70% (~25%) of the shear-mode intensity for the 3R (2H) MoS2 bilayers.
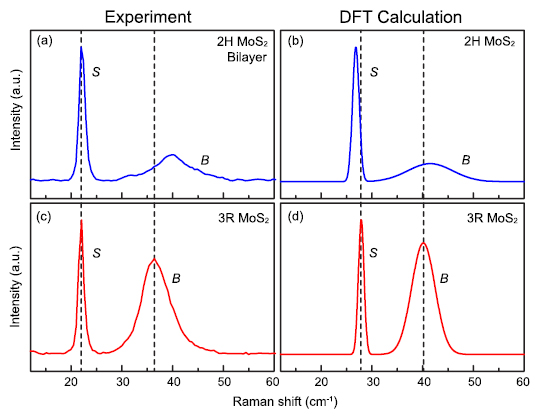
Figure 2. Measured (a, c) and calculated (b, d) Raman spectra of the interlayer shear (S) and breathing (B) modes for 2H (a, b) and 3R (c, d) MoS2 bilayer. The theoretical spectra are obtained by first-principle calculations based on density functional theory (DFT); they are presented as Gaussian functions of the same line width as the experimental spectra. The dashed lines highlight the different frequency separation between the shear and breathing modes in the 2H and 3R polytypes.
Download figure:
Standard image High-resolution imageWe have calculated the unpolarized Raman spectra of the shear and breathing modes for both 3R and 2H MoS2 bilayers by density functional theory (DFT) (figures 2(b) and (d); see supplementary material (stacks.iop.org/TDM/6/025022/mmedia)). Our calculations reproduce the two spectral features discussed above. First, the separation between the shear and breathing modes is 3 cm−1 smaller in 3R MoS2 than in 2H MoS2 in our simulated spectra. This result matches the observed 3 cm−1 red shift of the 3R breathing mode relative to the 2H breathing mode. Second, the intensity ratio between the calculated breathing and shear modes agrees well with the experimental ratio. Our experiment and calculation therefore consistently show that 3R and 2H MoS2 have noticeable difference in the interlayer coupling strength and Raman response. We can use the above two major spectral features to distinguish the two types of MoS2 bilayers.
Thicker MoS2 samples display more interlayer Raman modes. Figure 3 displays the logarithmic parallel-polarized (VV) and cross-polarized (HV) Raman spectra for both 3R and 2H MoS2 with layer numbers N = 1–13. We have subtracted the broad Raman background to display the weak interlayer modes (see supplementary material for details). We observe up to three branches of shear modes and four branches of breathing modes in thick MoS2 samples. The 3R and 2H breathing modes have similar thickness dependence. For both polytypes, the strongest breathing Raman peak redshifts as the layer number increases (blue squares in figures 3(a) and (c)). In contrast, the 3R and 2H shear modes show strikingly different spectra as the layer thickness increases. Figures 3(b) and (d) display the shear-mode spectra in the HV geometry, in which all breathing modes are suppressed. For the 2H polytype, the shear Raman peaks blueshift as the layer number increases. But for the 3R polytype, the shear Raman peaks redshift as the layer number increases. Therefore, the 2H and 3R shear Raman modes evolve oppositely with the layer number.

Figure 3. (a)–(d) Parallel-polarized (VV) and cross-polarized (HV) Raman spectra of the shear modes (S; red dots) and breathing modes (B; blue squares) for 3R MoS2 (solid symbols) and 2H MoS2 (open symbols) with layer number N = 1–13. The breathing modes appear only in the VV geometry, whereas the shear modes appear in both the VV and HV geometries. We have subtracted the broad Raman background and plot the spectra in the logarithmic scale to display the weak interlayer modes.
Download figure:
Standard image High-resolution image4. Theoretical discussion and analysis
4.1. Linear chain model
We can describe the frequencies of the breathing (shear) modes by a simple linear chain model in which adjacent layers are coupled harmonically with the same force constant [17]. An N-layer system hosts N − 1 breathing modes and N − 1 doubly-degenerate shear modes. Their mode frequencies are:
Here j = 1, 2, ... N − 1 is the branch index, counting from the highest-frequency to the lowest-frequency branch;  (
( ) is the frequency of the highest breathing (shear) branch in the bulk limit. These two bulk frequencies are the only fitting parameters in the linear chain model.
Figure 4 compares the observed breathing and shear mode frequencies (symbols) with the prediction of the linear chain model (lines). The observed breathing modes in 3R and 2H MoS2 can be fit well with a bulk breathing-mode frequency of  = 53.85 cm−1 and 57.40 cm−1, respectively. The strongest breathing Raman mode corresponds to the lowest breathing branch (j = N − 1), and other weaker breathing Raman modes correspond to higher branches with j = N − 3, N − 5, N − 7 ... (solid blue lines in figure 4). Other breathing branches with j = N − 2, N − 4, N − 6 ... are Raman inactive (dashed blue lines in figure 4).
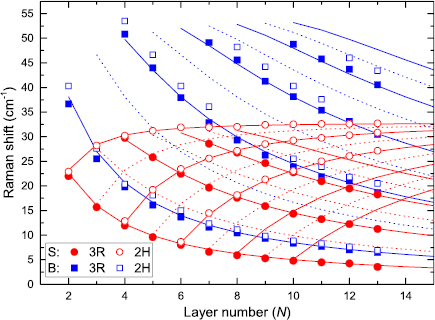
Figure 4. Frequencies of the observed shear modes (S; red) and breathing modes (B; blue) in figure 3 as a function of MoS2 layer number. The solid (open) symbols are experimental data for 3R (2H) MoS2. The blue (red) lines are the predicted frequencies of the breathing (shear) modes by the linear chain model, as described in the text. The solid (dashed) lines denote the Raman active (inactive) branches. The 2H breathing modes are consistently higher in frequency than the 3R breathing modes, whereas the shear modes have almost the same frequencies for both polytypes.
Download figure:
Standard image High-resolution imageFor the shear modes, the observed Raman frequencies in 3R and 2H MoS2 can be fit well with a bulk frequency  = 31.85 cm−1 and 32.85 cm−1, respectively. Both values match closely the measured shear frequency (32.9 cm−1) of bulk 2H MoS2 (the top spectrum in figures 3(c) and (d)). The linear chain model shows that the observed shear modes in 2H MoS2 correspond to high-frequency shear branches with j = 1, 3, 5 (red open dots and solid lines in figure 4). The branches with j = 2, 4, 6 ... are Raman inactive (red dashed lines). In contrast, the observed shear modes in 3R MoS2 correspond to low-frequency shear branches with j = N − 1, N − 3, N − 5 (red solid dots). The branches with j = N − 2, N − 4, N − 6 ... are Raman inactive (red dashed lines). The observed 2H and 3R shear modes therefore cover the high and low shear branches, respectively. For MoS2 with odd layer numbers, the observable 2H and 3R shear modes complement each other. By combining the 2H and 3R data, we can reveal all the shear branches (j = 1 to N − 1) in MoS2 with odd layer numbers N = 3, 5, 7.
4.2. Interlayer force constants and elastic moduli
Our measured interlayer mode frequencies allow us to calculate the interlayer force constants and elastic moduli of 3R and 2H MoS2 (table 1). The interlayer force constant (K) is related to the bulk interlayer vibration frequency ( ) as
) as  , where c is the speed of light and
  = 3.068 × 10⁻⁶ kg m−2 is the mass per unit area of MoS2 monolayer [17, 31]. By using the extracted 3R and 2H bulk shear mode frequencies, we obtain the interlayer shear force constants: Kx = 2.76 × 10¹⁹ Nm−3 for 3R MoS2 and Kx = 2.94 × 10¹⁹ Nm−3 (Kx and Ky are the same because MoS2 is isotropic in the xy plane). Similarly, by using the extracted bulk breathing mode frequencies, we obtain the interlayer compressive force constants: Kz = 7.89 × 10¹⁹ Nm−3 for 3R MoS2 and Kz = 8.98 × 10¹⁹ Nm−3 for 2H MoS2. The elastic modulus (C) is related to the force constant as C = Kt, where t is the interlayer separation. 2H and 3R MoS2 have slightly different interlayer distance: t = 6.148 Å for 2H MoS2 and t = 6.123 Å for 3R MoS2. Correspondingly, we obtain the shear modulus C44 = Kxt = 16.90 GPa (18.08 GPa) for 3R (2H) MoS2 and the compressive modulus C33 = Kzt = 48.32 GPa (55.19 GPa) for 3R (2H) MoS2 (table 1). Our 2H results agree with prior works [30, 31]. Notably, the 2H compressive modulus is 14% higher than the 3R modulus; this ratio matches roughly the prediction of recent first-principles calculations [69].
Table 1. Elastic parameters of 2H and 3R MoS2 calculated from the interlayer phonon frequencies.
| Elastic parameters | 3R MoS2 | 2H MoS2 | |
|---|---|---|---|
| Shear properties |  (cm−1) (cm−1) |
31.85 | 32.85 |
 (1019 Nm−3) (1019 Nm−3) |
2.76 | 2.94 | |
 (GPa) (GPa) |
16.90 | 18.08 | |
| Compressive properties |  (cm−1) (cm−1) |
53.85 | 57.40 |
 (1019 Nm−3) (1019 Nm−3) |
7.89 | 8.98 | |
 (GPa) (GPa) |
48.32 | 55.19 | |
4.3. Group-theory analysis
After calculating the elastic parameters, we examine the Raman properties of interlayer phonons. The interlayer phonon modes in 2H MoS2 have been well studied in the literature [28, 31, 70, 71]. Their Raman activity behavior can be understood from their point group symmetry. 2H MoS2 with even (odd) layer numbers have the D3d (D3h) point group. From the representations of the shear (breathing) modes, we can easily deduce that they are Raman active in every other branch, counting from the highest (lowest) branch, while being Raman inactive in other branches (see the supplementary material for a summary of group-theory analysis for 2H MoS2). However, the point-group analysis is not applicable in the 3R structure, which has lower symmetry than the 2H structure. 3R MoS2 has the C3v point group for all the layer numbers, with no inversion nor mirror symmetry. All breathing modes have the A1 representation and all shear modes have the E representation. They are all Raman active in the group-theory analysis. Therefore, a simple point-group symmetry analysis cannot explain the observed alternating appearance of the interlayer branches in the 3R Raman spectra.
4.4. Qualitative description of Raman activity
To reveal the underlying physics of interlayer Raman modes in the 3R structure, we directly examine the influence of stacking order on the Raman tensor of the phonon modes. For a vibration mode k, its Raman intensity (Ik) is proportional to [72, 73]:
Here  is the phonon frequency;
  is the phonon occupation according to the Bose–Einstein distribution;
  and
and  are the polarization unit vectors of the incident and scattered light, respectively;
  is the Raman tensor. In a classical picture,
  can be expressed as:
Here  is the polarizability tensor;
  is the normal coordinate of the vibration normal mode;
  is the derivative of the polarizability tensor at the equilibrium lattice position (
 = 0).
= 0).
To determine the Raman activity of a phonon mode, we can directly examine the atomic configuration during the vibration. As an illustration, figure 5(a) shows the interlayer atomic configurations of the two shear modes  and
and  in 3L MoS2 at positive (Q > 0) and negative (Q < 0) normal displacement. The 3R and 2H structures have distinct atomic configurations during the vibration. For the 3R
  mode, the interlayer atomic configurations are the same for Q > 0 and Q < 0. The differential polarizability
  is thus zero; this mode is Raman inactive. But the
  mode in the 2H structure has distinct atomic configurations for Q > 0 and Q < 0. This mode thus has non-zero
  and is Raman active. In contrast, the lower
  mode has opposite stacking dependence. The 3R
  mode exhibits different interlayer atomic configurations for Q > 0 and Q < 0, leading to finite
  and Raman response. However, the 2H
  mode has the same atomic configurations for Q > 0 and Q < 0, leading to zero
  and no Raman response. This simple analysis illustrates why the high and low shear branches appear exclusively in the Raman spectra from 3L MoS2 of 2H and 3R phases, respectively (figure 5(b)). The above pictorial analysis can be applied to explain the Raman activity of shear and breathing modes in 2H and 3R structures with any number of layers (e.g. see the analysis of 5L MoS2 in the Supplementary Material). Similar stacking-dependent shear modes are also observed in few-layer graphene with ABA and ABC stacking order [18, 26].
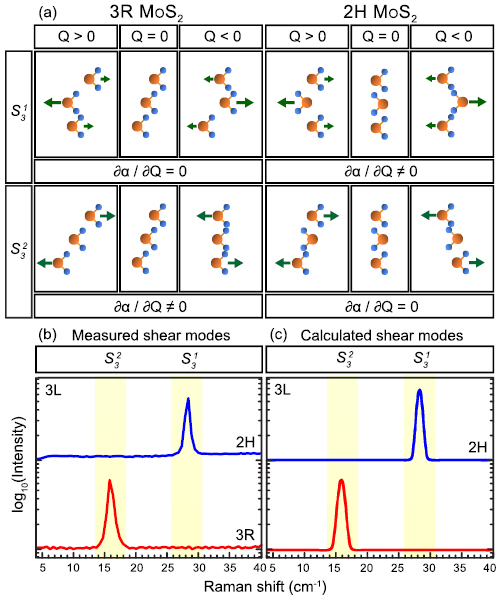
Figure 5. (a) Layer displacement of the two shear modes in 3R and 2H MoS2 trilayers. By comparing the atomic configuration at opposite normal displacements (Q > 0 and Q < 0) near the equilibrium position (Q = 0), we can deduce whether the differential polarizability ( ) (hence, the Raman tensor) is zero or finite. (b) and (c) The experimental and simulated cross-polarized Raman shear modes for trilayer 2H and 3R MoS2. In the simulation, the shear-mode frequency is predicted by the linear chain model (highlighted by the yellow bars) and the relative mode intensity is determined by the bond polarizability model. The high and low shear modes appear exclusively in the 2H and 3R trilayer, respectively.
Download figure:
Standard image High-resolution image4.5. Quantitative bond polarizability model
Our qualitative analysis above can be quantified in an effective bond polarizability model [72, 73], which predicts the relative Raman intensity of different shear modes. This model considers the distortion of interlayer bonds by the interlayer vibration. The Raman tensor  is the sum of contributions from each interlayer bond. The diagonal element
  is responsible for parallel-polarized Raman response; the off-diagonal element
  is responsible for cross-polarized Raman response. For a shear mode k with x-direction layer displacement in an N-layer structure, the tensor element
  (
( ) may be expressed as:
Here  denotes the layer index;
  is the lateral displacement of layer l from the equilibrium position;
  is the
  -element of the polarizability tensor of the interlayer bond between layers l and l + 1.
  is the derivative of
  with respect to
  . For a shear mode
  with branch index j in an N-layer structure, the displacement of layer l is: [17]
The 3R and 2H structure have the same layer displacement pattern in vibration, but different configurations of interlayer bonds. In 3R MoS2, all the layers have the same orientation and identical interlayer bonds, and hence the same  (figure 6(a)). We may thus remove the l index and name it as
  . By equation (5), the 3R Raman tensor element is:
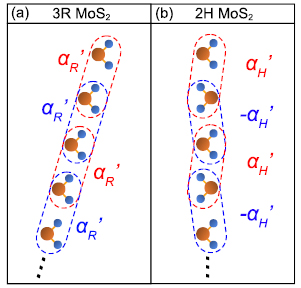
Figure 6. Schematic representation of interlayer bonds for (a) 3R and (b) 2H MoS2. The interlayer bonds have the same lateral orientation for 3R stacking, but alternate lateral orientation for 2H stacking, resulting in their distinct shear-mode Raman response. The blue/red dashed lines highlight the interactions between adjacent layers.
Download figure:
Standard image High-resolution imageIt depends only on the displacement of the top and bottom layers.
In contrast, the adjacent layers in 2H MoS2 have opposite orientation. The interlayer bonds thus exhibit alternate lateral orientation for successive layer pairs, leading to opposite signs of  (figure 6(b)). By setting
  , the other
  would be
  . By equation (5), the 2H Raman tensor element is:
We can combine equation (3), (6)–(8) to obtain the Raman intensity. After some algebraic derivation (see supplementary material), the Raman intensities of the 3R and 2H shear modes  show the following analytic forms:


In equation (9), the factor  is zero when
  is an even number; the 3R shear mode is non-zero only when the branch index j = N − 1, N − 3, N − 5, .... In equation (10), the factor
  is zero when j is an even number; the 2H shear mode is non-zero only when j = 1, 3, 5, .... Such stacking-dependent Raman activity exactly matches our experimental results (figures 3 and 4).
In addition to accounting for the Raman activity, the above analytical theory enables us to quantitatively simulate the Raman spectra of shear modes for each layer number and stacking order. In the simulation, we use the linear chain model (equations (1) and (2)) to determine the mode frequencies and the bond polarizability model (equations (9) and (10)) to determine the Raman intensity ratio of different branches. The calculation gives the same results for parallel and cross polarizations. For comparison with experiment, we plot the theoretical Raman modes as Gaussian functions with the same width as the experimental peaks. Figures 5 and 7 compare our simulations with experiment for 3L, 5L and 9L MoS2, which exhibit one, two and three shear modes, respectively, for both the 3R and 2H phases in our observed Raman spectra. Our calculated spectra show reasonably accurate intensity ratio between different shear branches (see supplementary material for simulations for other layer numbers).
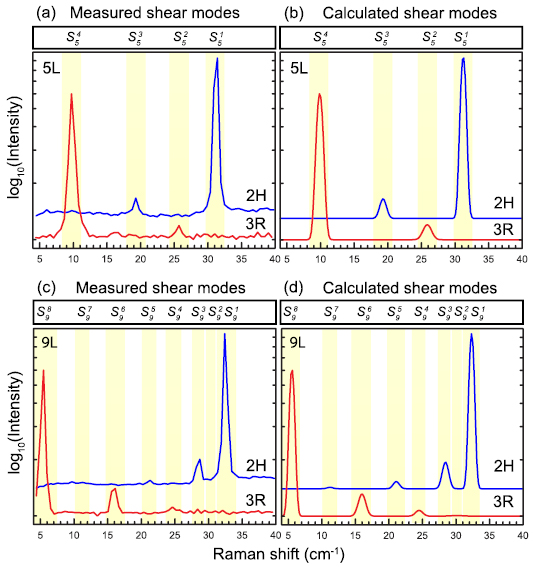
Figure 7. Comparison of the cross-polarized (HV) experimental and simulated shear-mode Raman spectra for 5L and 9L MoS2 in both 3R and 2H phases. In the simulation, the shear-mode frequency is predicted by the linear chain model (highlighted by the yellow bars) and the relative mode intensity is determined by the bond polarizability model.
Download figure:
Standard image High-resolution imageOur model can be readily extended to explain the breathing modes by redefining  , where
  is the vertical displacement of layer l. In this case,
  does not depend on the lateral orientation of the interlayer bonds, so
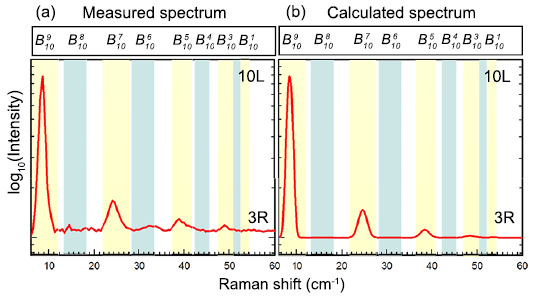
  is the same for all layer indices l in either stacking order. As a result, for both 2H and 3R breathing modes, their Raman tensor and intensity follow the same forms as those of 3R shear modes in equations (7) and (9). For instance, figure 8 displays our calculated breathing-mode Raman spectrum for 10L MoS2 (the same for 2H and 3R phases), in comparison with the measured parallel-polarized (VV) spectrum of 10L 3R MoS2. Our calculation quantitatively reproduces the experimental spectrum, which exhibits four breathing modes (
 ,
,  ,
,  ,
,  ) from low to high frequency and strong to weak intensity.
Figure 8. (a) The experimental parallel-polarized spectrum of 10L 3R MoS2. The four major peaks are the breathing modes. (b) The simulated breathing-mode spectrum for 10L MoS2 by the linear chain model and the bond polarizability model. The yellow (blue) bars denote the Raman active (inactive) breathing modes.
Download figure:
Standard image High-resolution image
5. Conclusion
We have carried out a comprehensive experimental and theoretical investigation of the interlayer Raman modes in 3R and 2H MoS2 atomic layers. The 3R and 2H polytypes exhibit similar breathing-mode spectra but distinct shear-mode spectra. Prior research has measured the interlayer Raman modes in various 2D materials with different stacking order, such as few-layer graphene with ABA and ABC stacking order [18, 26, 74], TMDs with 2H structure [27–31], TiSe2 with 3R stacking order [51], etc. Nonetheless, due to the difficulties in sample preparation and Raman experiment, no prior work could systematically measure both the shear and breathing modes in the same material at two distinct stacking orders and all layer numbers. Our comparative analysis of 3R and 2H MoS2 of layer number N = 1–13 thus represents a key Raman study to address the role of stacking order and layer number in 2D materials. In addition, our results serve to facilitate the research of 3R TMD materials, whose general lack of inversion symmetry may enable many novel valleytronic, piezoelectric, and nonlinear optical applications.
Acknowledgment
Work at TTU (GY, ZY, RH) is supported by NSF CAREER Grant No. DMR-1760668. The DFT calculations of this work used the Extreme Science and Engineering Discovery Environment (XSEDE) Comet at the SDSC through allocation TG-DMR160101 and TG-DMR160088. JAY acknowledges support from the NSF grant DMR 1709781, the Fisher General Endowment, and SET grants from the Jess and Mildred Fisher College of Science and Mathematics at Towson University. PY and ZL acknowledge support from the Singapore National Research Foundation under NRF Award Nos. NRF-RF2013-08.
Competing interests
The authors declare no competing interests.