

Abstract
A laboratory-built high-sensitivity flow cytometer (HSFCM) was employed for the rapid and accurate detection of lactic acid bacteria (LAB) and their viability in probiotic products. LAB were stained with both the cell membrane-permeable SYTO 9 green-fluorescent nucleic acid stain and the red-fluorescent nucleic acid stain, propidium iodide, which penetrates only bacteria with compromised membranes. The side scatter and dual-color fluorescence signals of single bacteria were detected simultaneously by the HSFCM. Ultra-high temperature processing milk and skim milk spiked with Lactobacillus casei were used as the model systems for the optimization of sample pretreatment and staining. The viable LAB counts measured by the HSFCM were in good agreement with those of the plate count method, and the measured ratios between the live and dead LAB matched well with the theoretical ratios. The established method was successfully applied to the rapid quantification of live/dead LAB in yogurts and fermented milk beverages of different brands. Moreover, the concentration and viability status of LAB in ambient yogurt, a relatively new yet popular milk product in China, are also reported.
Export citation and abstract BibTeX RIS
1. Introduction
Probiotics are live microorganisms that, when administered in adequate amounts, confer a health benefit on the host [1, 2]. More and more positive probiotic effects have been demonstrated in specific population groups, especially in patients with diseases such as the necrotizing enterocolitis, antibiotic-associated diarrhea, and acute infectious diarrhea [3]. Lactic acid bacteria (LAB), as the most common microbes employed as probiotics, are widely used in probiotic products like yogurts and fermented milk beverages, to endow them with beneficial effects on intestinal health. To exert beneficial health effects, probiotic bacteria need to be viable and available at a high cell count (at least 106 cfu ml−1) [4]. Therefore, probiotic products sold with claimed health benefits should meet this minimum viable count of bacteria. Thus, rapid and accurate quantification of viable LAB is of great importance for the quality assurance of probiotic products.
The most frequently used method in the dairy industry to assess bacterial viability is plate counting, which is labor-intensive, time-consuming, and fails to detect bacteria that do not form colonies but are nevertheless metabolically active. These active but nonculturable LAB are also believed to have a probiotic effect, and are capable of growth when they are given a suitable environment [5, 6]. In addition, dead LAB can provide information if the probiotic product has gone bad during storage. Therefore, obtaining an accurate count of both live and dead LAB in probiotic products is relevant.
Recently culture-independent methods, such as enzyme-linked immunosorbent assay [7], real-time quantitative polymerase chain reaction (qPCR) [8, 9], and flow cytometry (FCM) [10] have been developed for the quantification of bacteria. Among these alternatives, although qPCR exhibits the potential to replace the conventional plate count method due to its rapidness, sensitivity, and culture-independence, it does not enable the discrimination between DNA arising from live or dead bacteria. By offering high-throughput, quantitative, and multiparameter analysis of bacteria at the single-cell level, FCM has gained increased popularity in microbiological research, clinical diagnosis, and food safety inspection. Although there are reports on the use of FCM for LAB detection [11–15], unfortunately, FCM analysis of bacteria has been hindered by their small size and the minute content of structural molecules [11]. Counting bacteria by conventional FCM is not an easy task due to its limited sensitivity in distinguishing single bacteria from background signal and the unavoidable detection of a large number of impurity particles in the sheath fluid [16–18]. For bacterial detection in milk and beverages, the presence of many impurity particles in a sample medium makes the situation even worse [19].
In order to enhance the detection capability of FCM for bacterial analysis, both the sensitivity improvement and reduction of the interference from impurity particles in the sheath fluid are needed. During the past decade, our laboratory has been working on the development of high-sensitivity flow cytometry (HSFCM) by reducing the detection volume for the background reduction and extending the particle transit time through the laser beam for increased photon generation [20, 21]. Depending on whether or not an avalanche photodiode detector for photon burst detection has been employed, the instrument can be hundreds to tens of thousands of times more sensitive than the conventional FCM in the light-scattering detection of single nanoparticles [22–24]. Due to the much larger sheath-flow rate than that of the sample fluid, the number of background particles detected by a flow-cytometric system per unit time is mainly determined by the interrogation region of the sheath stream (the region that is illuminated by the laser beam and sensed by the detector), the velocity of the sheath flow, and the concentration of impurity particles in the sheath fluid. Thus, the significantly reduced probe area of the sheath fluid in HSFCM and the much slower sheath-flow velocity (approximately 20 mm s−1) for HSFCM versus approximately 6 m s−1 for conventional FCM) result in a significant reduction in the detected event rate of impurity particles in the sheath fluid by three to four orders of magnitude [23]. The configurations of the HSFCM instrument have been tailored to meet different applications in bacterial detection and characterization [25–30], including the counting of specific pathogenic strain and total bacteria, quantification of bacterial autofluorescence, analysis of low copy number β-galactosidase, screening of antibiotic resistance via fluoregenic substrate or immunofluorescent labeling of β-lactamase, and the enumeration of total bacteria in drinking water and tea beverages. In the present study, we attempt to apply the HSFCM for the rapid quantification of live/dead lactic acid bacteria in probiotic products via nucleic acid staining using the combination of SYTO 9 and propidium iodide (PI). A good sample treatment method was developed for the removal of cream and protein particles in milk and yogurt. Accurate enumeration of LAB spiked in ultra-high temperature processed (UHT) milk and skim milk was demonstrated through a good correlation with the plate count method. The established method was successfully applied to the LAB detection in yogurts, fermented milk beverages, and ambient yogurts of different brands in the market.
2. Methods and materials
2.1. Reagents and bacterial strain
Nucleic stains SYTO 9 and PI were obtained from Molecular Probes (Eugene, OR, USA) and Sigma-Aldrich (St Louis, MO, USA), respectively. Bacterial strain Lactobacillus casei (ATCC344) was purchased from Jieshun Biological Technology (Wuxi, Jiangsu, China). The strain was cultured at 37 °C and 200 rpm min−1 in de Man, Rogosa, and Sharpe (MRS) broth (Baisi Biotechnology, Hangzhou, Zhejiang, China). For the plate counting of viable bacteria, the MRS agar plates were incubated at 37 °C. Other reagents were purchased from Sinopharm Chemical Reagent (Shanghai, China). Distilled, deionized water, supplied by a Milli-Q RG unit, was filtered through a 0.22 μm filter and used for buffer preparation.
2.2. Preparation of LAB-spiked milk samples
Lactobacillus casei was cultured in MRS broth and harvested at an optical density at 600 nm (OD600) of 0.6–0.7 by centrifugation at 8000 rpm for 5 min. The cells were washed with PBS and resuspended to an OD600 of 0.8–0.9 (containing approximately 1 × 10⁹ cfu ml−1). One milliliter of the above cell suspension was re-centrifuged and resuspended in 1 ml of UHT milk or skim milk solution (containing 3.5 g skim milk powder per 100 ml). To permeabilize cell membranes and cause cell death, the suspensions were heated at 80 °C for 10 min. Different proportions of live and dead cells were mixed to obtain LAB suspensions of different ratios.
2.3. Pretreatment and staining of milk samples
UHT milk or yogurt was diluted 100 times with PBS, and vortexed for 1 min. Then 1 ml dilution was pipetted into a 1.5 ml Eppendorf tube, and centrifuged at 12 000 rpm for 5 min to separate the cream from the LAB and protein particles. The cream on the top and in the supernatant was removed, and the pellet along with 100 μl supernatant were left in the tube. After cleaning the cream adsorbed on the tube wall with a Q-tip cotton swab, 895 μl PBS and 5 μl proteinase K (Solarbio Life Sciences, Beijing, China, 20 mg ml−1) were added and the tube was vortexed to mix well. The tube was incubated at 37 °C for 20 min to digest the protein particles, and then re-centrifuged to remove the cream again, as mentioned above. The pellet was mixed with the residual 100 μl supernatant in the tube to obtain 100 μl purified LAB suspension. The purified LAB suspension was subjected to fluorescence staining by incubating with 1 μM SYTO 9 and 14 μg ml−1 PI at room temperature for 10 min. Skim milk solution or fermented milk beverage was diluted 10–20 times with PBS and then directly subjected to double staining, as mentioned above.
2.4. Plate counting of LAB
Appropriate decimal dilutions of the LAB-spiked milk samples were directly plated into the MRS agar with three replications, and the plates were incubated for 72 h.
2.5. HSFCM measurement
A laboratory-built HSFCM was used for LAB detection and enumeration. The HSFCM and its parameter setting were described previously [22, 29]. Briefly, a solid-state 488 nm laser was used as the excitation source, and three photomultiplier tubes (PMTs) were used for the simultaneous detection of the side scatter, green fluorescence (bandpass filter FB520/35, Semorock), and red fluorescence (bandpass filter FB700/40, Thorlabs), respectively. For each sample, 60 s of data acquisition was carried out. The same detection was repeated three times. Fluospheres of known particle concentration (Invitrogen, CA, USA), with a diameter of 200 ± 9 nm, were employed as an external standard for the determination of LAB concentraion via the equation Cl = (Nl/Nf) × Cf, where Cl, Cf, Nl, and Nf represent LAB concentration, fluosphere concentration, the event number of LAB counted in 1 min, and the event number of fluosphere counted in 1 min, respectively.
3. Results and discussion
3.1. Principle for the detection of live and dead LAB in probiotic products
Membrane integrity is the most important criterion for distinguishing viable cells from irreversibly damaged ones. Live cells with intact membranes are able to exclude some DNA-binding dyes that easily penetrate dead or membrane-compromised cells [14]. By this principle, a double-labeling approach involving the staining of intact cells with one membrane-permeable nucleic acid stain along with the counterstaining of membrane-compromised cells with another impermeable stain is commonly used [31, 32]. In the present work, SYTO 9 green-fluorescent nucleic acid stain and red-fluorescent nucleic acid stain PI were combined to stain LAB. SYTO 9 is a cell membrane-permeable dye, which labels all bacteria green regardless of their membrane status, whereas PI penetrates only bacteria with compromised membranes and its binding to dsDNA is stronger than that of SYTO 9 [33]. As depicted in scheme

Scheme 1. Schematic diagram of the detection principle for live/dead LAB counting in probiotic products using the laboratory-built HSFCM.
Download figure:
Standard image High-resolution image3.2. Pretreatment of milk and yogurt samples
Yogurt is a food product of the bacterial fermentation of milk. Fermentation of lactose by LAB produces lactic acid, which acts on milk protein to give yogurt its texture and characteristic tang. Because milk is a colloid of butterfat globules and protein micelles within a water-based fluid, caution needs to be taken for the flow-cytometric analysis of milk or milk products to prevent clogging of the flow system and avoid the scattering interference generated by these particles [34]. On the other hand, milk proteins and lipids are also well known for binding staining molecules and interfering with sample detection [34]. Therefore, milk samples must be pretreated before HSFCM analysis. The most commonly adopted method for milk sample pretreatment was developed by Gunasekera et al [35]. In their method, lipids were removed by centrifugation and protein globules were removed or digested by protease containing surfactant. Similarly, commercial milk clearing solutions have also been developed [36]. However, for such a method, it is difficult to remove lipids thoroughly as some cream could remain on the tube wall during the removal process. Furthermore, the loss of bacteria could occur due to disturbing the pelleted bacteria. In the present study, we used a Q-tip cotton swab to wipe off the remaining cream from the wall of the tube, as described by Bunthof and Abee [19]. In addition, when removing the supernatant and cream, 100 μl supernatant was intentionally left in the tube to avoid disturbing the bacteria pellet. Thus, most of the butterfat globules and protein micelles in the milk sample were removed without the loss of bacteria. The above pretreatment method was also applied to yogurt samples.
3.3. LAB detection in UHT milk and skim milk
The aim of the present study is to develop an HSFCM-based method for rapid quantification of live and dead LAB in yogurt and fermented milk beverage. Based on their composition and production process, UHT milk and skim milk solution were artificially spiked with LAB (Lactobacillus casei as a model of LAB) to mimic yogurt and fermented milk beverage, respectively. These two model systems were used to establish the method as a proof-of-concept.
The feasibility and accuracy of the method were investigated first. LAB was cultured to the logarithmic phase to ensure that all the LAB cells were alive and culturable in RMS agar, and SYTO 9 was used for total LAB staining. In this way, the accuracy of the HSFCM analysis can be verified by comparison with the conventional plate count method. Figures 1(A) and (B) show the representative side scatter and fluorescence burst trace data of UHT milk and UHT milk spiked with live LAB. Clearly, there exist some impurity particles in the milk sample after the pretreatment, yet their intensities were relatively low and no concurrent fluorescence peaks were detected (figure 1(A)). The absence of peaks on the fluorescence channel in figure 1(A) also indicates that the UHT milk is free of bacteria. Compared with impurity particles detected in UHT milk, the spiked Lactobacillus casei scattered much stronger laser light and concurrent peaks were detected on the fluorescence channel (figure 1(B)). The green fluorescence bursts generated from individual Lactobacillus casei cells were bright enough to distinguish them from the background. The bivariate dot-plot of the side scatter burst area versus the green fluorescence burst area is shown in figure 1(C). UHT milk spiked with Lactobacillus casei at a concentration ranging from 5 × 10⁶ to 10 × 109 cfu ml−1 was tested to evaluate the quantification capability of the developed method. Good correlation between the results measured by the HSFCM and the plate count method was obtained, as shown in figure 1(D) with R2 of 0.9904 and a slope of 1.0151. Because the LAB concentration in probiotic products should be more than 107 cfu ml−1, the lowest LAB concentration tested in the present study was 5 × 10⁶ cfu ml−1. It is worth noting that bacterial concentration as low as 2 × 10⁵ cells ml−1 can be quantified by the HSFCM [25]. To test the reproducibility of the method, five independent samplings and detection of the same prepared UHT milk sample were performed by HSFCM (figure 1(E)) and the plate count method (figure 1(F)). For the replicate analysis of a single sample, the error bar of HSFCM analysis upon sample pretreatment was smaller than that of the plate count method, which can be ascribed to the simple injection and analysis procedure of HSFCM. However, the relative standard deviation of HSFCM detection (4.7%) for the five samplings (including sample pretreatment and instrument analysis) was slightly higher than that of the plate count method (1.8%), which can attributed to the milk sample pretreatment prior to the instrument analysis, whereas no treatment is needed for the plate count method.
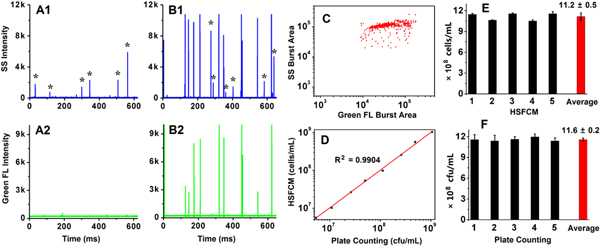
Figure 1. HSFCM analysis of UHT milk spiked with live LAB upon SYTO 9 staining. (A), (B) Representative side scatter and green fluorescence burst traces for UHT milk (A) and UHT milk spiked with LAB (B) at a concentration of 11.6 × 10⁸ cfu ml−1 (asterisks represent impurity particles). (C) Bivariate dot-plot of side scatter burst area versus green fluorescence burst area for sample B upon 60 s of data acquisition. (D) Relationship between HSFCM enumeration and plate counting for LAB spiked in UHT milk; data are represented as mean ± SD (n = 3). (E) and (F) Reproducible test of the HSFCM and plate count methods for the analysis of LAB spiked in UHT milk, respectively. Five independent sample treatments and analysis were carried out for each method.
Download figure:
Standard image High-resolution imageFor the detection of LAB in skim milk, HSFCM analysis could be performed without sample pretreatment, provided that the sample was diluted more than 10 times before staining. This is due to the fact that skim milk or fermented milk beverage contains no lipids and less protein micelles compared with milk or yogurt. Compared with the spiked LAB, the impurity particles in skim milk emit much weaker scattering signal and no concurrent fluorescence signal was detected upon nucleic acid staining (figure S1 is available at stacks.iop.org/MAF/5/024002/mmedia). These results indicate that the as-developed method is feasible for the quantitative detection of LAB in dairy products.
3.4. Proof-of-concept demonstration of live/dead LAB detection in milk
The as-developed HSFCM-based method was further tested for the analysis of live/dead LAB in both the UHT milk and skim milk. UHT milk samples spiked with live and dead LAB of different ratios were pretreated, stained with SYTO 9 and PI, and analyzed by HSFCM. Figures 2(A) and (B) show the representative side scatter, green fluorescence, and red fluorescence burst traces of UHT milk spiked with live LAB (A) and dead LAB (B), respectively. Nearly all of the live bacterial cells were intact and thus could not be stained by PI (no red fluorescence can be detected, as can be seen in figures 2(A3) and (C)), which indicates that the membrane integrity of the bacteria was not affected by the pretreatment of the milk sample. When the live LAB was killed via heating at 80 °C for 10 min, all the cells were permeabilized and thus stained by PI as can be seen by the strong red fluorescence signals (figures 2(B3) and (D)). Figures 2(E)–(G) show the dot-plots of the red fluorescence burst area versus the green fluorescence burst area for UHT milk spiked with the live/dead LAB mixture containing 5%, 10%, and 50% of dead LAB, respectively. An excellent correlation between the HSFCM-measured ratios of dead LAB and the theoretical ratios was obtained with R2 of 0.9996 (figure 2(H)). Quantitative detection of live and dead LAB in skim milk was also carried out (figure S2), and a squared coefficient of correlation R2 of 0.9939 was obtained.

Figure 2. HSFCM analysis of UHT milk spiked with live/dead LAB upon SYTO 9 and PI staining. (A), (B) Representative side scatter, green fluorescence, and red fluorescence burst traces for UHT milk spiked with live LAB (A) and dead LAB (B). (C), (D) Bivariate dot-plots of red fluorescence burst area versus green fluorescence burst area for UHT milk spiked with live LAB (C) and dead LAB (D). (E)–(G) Bivariate dot-plots of red fluorescence burst area versus green fluorescence burst area for UHT milk spiked with live/dead LAB mixture containing 5%, 10%, and 50% of dead LAB, respectively. (H) Plot of the detected ratios of dead LAB versus the theoretical ratios along with the linear regression curve.
Download figure:
Standard image High-resolution image3.5. Applicability evaluation of HSFCM analysis of LAB in yogurts and fermented milk beverages
In Walmart and other supermarkets in China, there are various yogurts and fermented milk beverages that claim to contain active LAB with related health benefits. Yogurt is a fermented milk product that contains the characteristic bacterial cultures of LAB (Lactobacillus casei, Lactobacillus bulgaricus, Streptococcus thermophilus, and Bifidobacterium species, etc, may vary with brands), and their production in China should meet the standard (GB 19302-2010, China). The fermented milk beverages are mainly composed of skim milk, soluble carbohydrate, and LAB (Lactobacillus casei or Lactobacillus paracasei, may vary with brands), and their production in China should meet the standard (GB 16321-2003, China). The lactic acid bacteria count should be higher than 1 × 10⁶ cfu ml−1. The developed HSFCM-based method was tested for LAB detection and live/dead differentiation in yogurts and fermented milk beverages purchased from the supermarket.
Figures 3(A) and (B) show the representative burst traces obtained on the side scatter, green fluorescence, and red fluorescence channels for LAB in yogurt (A) and fermented milk beverage (B) upon SYTO 9 and PI staining. A bacterial event exhibiting both side scatter and green fluorescence peaks was recognized as live LAB, whereas an event having an additional red fluorescence peak was recognized as dead LAB. As expected, many impurity particles were detected in both the pretreated yogurt and diluted fermented milk beverage. Yet LAB can be easily differentiated from impurity particles upon nucleic acid staining, and dead LAB can be clearly distinguished from live ones as can be seen in the bivariate dot-plot of the red fluorescence burst area versus the green fluorescence burst area (figures 3(C), (D)). Five independent sample treatments and analysis of the same bottle of yogurt and fermented milk beverage demonstrated good reproducibility of the method for the detection of practical samples (figure 3(E)). Compared with the plate counting of live LAB in the beverage (5.7 ± 0.2 × 10⁸ cfu ml−1), the viable count of LAB measured by HSFCM was much higher (7.3 ± 0.2 × 10⁸ cells ml−1). Based on the two-tailed Student's t-test, a significant difference was obtained (P < 0.05). Although the comparison between HSFCM and plate counting for live LAB in yogurt was not carried out due to the fact that the cultivation of some LAB in yogurt was beyond our experimental conditions, it was believed that the measured number of live LAB in yogurt by HSFCM should be higher than that of plate counting. This can be explained by the fact that there exist some bacterial populations in probiotic products that are metabolically active but nonculturable [19]. It has been reported that these metabolically active but nonculturable LAB also confer health benefits, and are capable of growth when they are given a suitable environment [5, 6]. Therefore, compared with the conventional tedious and labor-intensive plate count method, the HSFCM-based culture-independent method offers not only more rapid speed but higher accuracy for the detection of viable LAB.
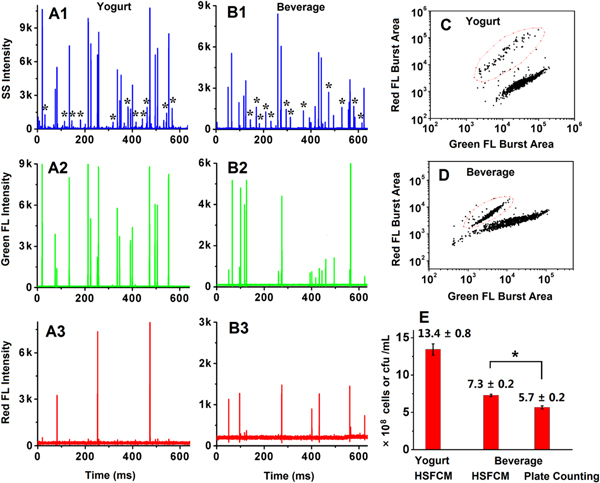
Figure 3. HSFCM analysis of LAB in yogurt and fermented milk beverage. (A), (B) Representative side scatter, green fluorescence, and red fluorescence burst traces for Menniu yogurt (A, a Chinese brand) and Yakult beverage (B, a Japanese brand). (C), (D) Bivariate dot-plots of red fluorescence burst area versus green fluorescence burst area for yogurt and beverage. (E) Reproducibility test of the HSFCM and plate count methods for the analysis of live LAB in a single bottle of yogurt (Menniu) and beverage (Yakult). Five independent sample treatments and analysis were carried out for each method.
Download figure:
Standard image High-resolution image3.6. Quantitative detection of LAB in yogurts and fermented milk beverages of different brands
The as-developed method was applied for the detection of LAB in yogurts and fermented milk beverages of different brands, and the results are shown in figure 4. According to the manufacturers, the yogurt or beverage contains at least 1 × 10⁸ live LAB per ml. The measured live LAB concentration ranges from 8–27 × 108 LAB per ml for yogurts (figure 4(A)) and 5–10 × 108 LAB per ml for beverages (figure 4(B)). Although there exists a relatively large variation among different batches, the viable count of LAB in all the tested samples is higher than claimed by the manufacturers. In every probiotic product, the vast majority of LAB cells are alive. It is interesting to find out that a high concentration of LAB in yogurts or beverages was usually accompanied by an increased fraction of dead LAB (particularly demonstrated by yogurt Chang Fu and beverage Yakult). Further study is needed to investigate whether cell death occurred during production or in the process of storage and distribution. In general, the LAB counts in yogurts are slightly higher than that of beverages.

Figure 4. HSFCM analysis of LAB in yogurts (A) and fermented milk beverages (B) of different brands. For each brand, three batches were detected and 3–5 bottles of yogurt or beverages from the same batch were sampled for detection.
Download figure:
Standard image High-resolution image3.7. Quantitative detection of LAB concentration and viability in ambient yogurt
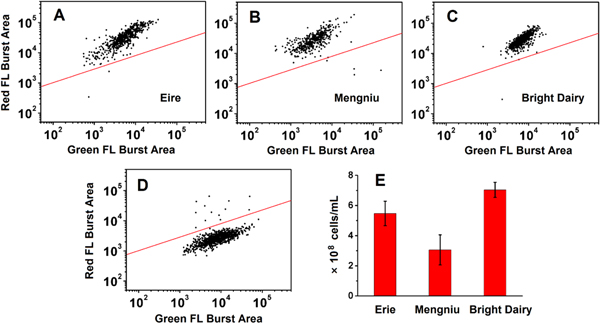
Ambient yogurt recently emerged as a popular dairy product in China due to its tasty nature and extended shelf life (120 days at room temperature). Although the heating treatment at 70 ∘C–85 °C upon fermentation would kill most of the bacteria in yogurt, it has been speculated that some LAB may still be alive. Because there has been no national standard issued regarding the heat treatment temperature and duration for ambient yogurt, it would be interesting to find out whether the ambient yogurts still contain enough live LAB to elicit health benefits. On the other hand, the concentration of total LAB can at least imply the successful fermentation process prior to heat treatment. However, the conventional plate count method cannot measure dead or nonculturable bacteria and it is too slow to yield rapid inspection. The as-developed HSFCM-based method was applied for the quantitative analysis of live and dead LAB in ambient yogurt. Figure 5 shows the bivariate dot-plots of the red fluorescence burst area versus the green fluorescence burst area for ambient yogurts of three different Chinese brands, Eire, Mengniu, and Bright Dairy. We can see that for every brand, nearly all the bacteria in ambient yogurt are dead and can be stained red by PI. Therefore, these ambient yogurts should not be considered as probiotic products. To the best of our knowledge, this is the first report about the total count and viability of LAB in ambient yogurt, which can provide evidence to protect consumers and health providers from misleading claims. The total counts, which also represent dead counts of LAB in ambient yogurts were all over 108 per ml as shown in figure 5. This implies that the ambient yogurts might meet the standard of probiotic products before heat treatment.
Figure 5. (A)–(C) HSFCM analysis of LAB in ambient yogurts of brands (A) Eire, (B) Mengniu, and (C) Bright Dairy. (D) HSFCM analysis of LAB in yogurt as a control. (E) Total LAB concentration (both live and dead) in ambient yogurts measured by HSFCM. Three to five bottles of ambient yogurt from the same brand were sampled for detection.
Download figure:
Standard image High-resolution image
4. Conclusion
In summary, we have developed an HSFCM-based rapid method for the quantitative detection of live/dead LAB in probiotic products upon SYTO 9 and PI nucleic acid staining. To optimize the conditions for sample treatment and HSFCM analysis, Lactobacillus casei harvested in the exponential growth phase were spiked in UHT milk and skim milk to mimic the situations of yogurt and fermented milk beverage, respectively. The assay, including sample pretreatment, staining, and instrument analysis, can be accomplished in one hour, which is far more efficient than the conventional plate count method (needs several days). For live Lactobacillus casei, the LAB concentrations measured by HSFCM were in good agreement with those of the plate count methods, and the ratios of dead to live Lactobacillus casei agreed well with the theoretical values. The as-developed method was successfully applied to the analysis of live/dead LAB in yogurts, fermented milk beverages, and ambient yogurt of various brands in the market. It is believed that HSFCM has many potential applications in monitoring the fermentation process, assessing the quality, and studying the effect of prolonged storage of probiotic products.
Acknowledgments
This research was supported by the National Natural Science Foundation of China (21225523, 91313302, 21475112, 21472158, and 21627811), the Program for Changjiang Scholars and Innovative Research Team in University (IRT13036), the National Fund for Fostering Talents of Basic Science (J1310024), the Fundamental Research Funds for the Central Universities (20720160028), and the Natural Science Foundation of Fujian Province, China (2016J01076), for which we are most grateful. All these funders had no role in the study design, data collection and analysis, decision to publish, or preparation of the manuscript.
Conflict of interests
The authors declare no competing financial interests.