

Abstract
Superconductor samples of YBa2Cu3O7−δ (YBCO) + x where x = 0.1, 0.2, 0.3, 0.4 and 0.5 wt% of nano metal oxides namely Cr2O3, Co3O4 and Mn3O4 namely are synthesized by the solid-state reaction route. Both x-ray diffraction and electron microscopy have been employed to study the phase identification and the microstructure of these samples. Transition temperature of the samples has been determined by four probe resistivity measurements. The x-ray diffraction patterns indicate that the gross structure of YBCO does not change with the substitution of three types of nano metal oxides with different doping level. The critical transition temperature (Tc) is found to decrease with the increases of doping level. Mn3O4 has highest Tc value which may be due to flux pinning from some defects and the rapid suppression in Tc with increasing concentration of Mn3O4 may be due to the cooper pair breaking and the hole filling in the CuO2 planes.
Export citation and abstract BibTeX RIS

Original content from this work may be used under the terms of the Creative Commons Attribution 3.0 licence. Any further distribution of this work must maintain attribution to the author(s) and the title of the work, journal citation and DOI.
1. Introduction
An important characteristic of the copper-oxide superconductors is the close relation between magnetism and superconductivity. Nano doping in bulk high superconducting critical transition temperature (Tc) superconductors has generated great interest because they represent easily controlled and efficient tools for improving superconducting properties. It is known that the oxygen content affects the crystal structure, electron/hole transport and superconducting properties in YBCO. It is also realized that the superconducting transition temperature sensitively depends on both the hole concentration in the CuO2 planes and the relative concentration of the oxygen within the planes. The level of this concentration can be controlled either by manipulating the oxygen stoichiometry in the Cu-O chains, by application of pressure or by ionic substitution [1]. Elemental substitutions play an important role in understanding the nature of superconductivity in high Tc superconductors. Substitutions of Cu by X ions in RBCXO system, where R is a rare earth and X is Mn, Cr, Fe, Co, Ni, Al, and Ga, have been studied [2–12]. In the YBa2Cu3O7−δ (YBCO) system, the existence of two kinds of Cu sites (planes and chains) as well as the sensitivity of Tc to the oxidation state complicates the experimental results [13, 14].
In the first part of this work [15] we study the effect of doping YBCO with 0.2 wt% of nonmagnetic and magnetic nano metal oxides (Mn3O4, Co3O4, Cr2O3, CuO and SnO2). We concluded that the doping with nonmagnetic nano metal oxides (CuO and SnO2) severely depressed the value of Tc while doping with Cr2O3 (3.8 μB) and Co3O4 (3.2 μB) slightly depressed Tc. Furthermore, doping with high magnetic moment Mn3O4 (5.27 μB) increased Tc significantly which is attributed to the inclusion of Mn In YBCO structure reduced the formation of other YBCO phases and enhanced the formation of YBCO with high orthorhombicity and high superconducting properties.
In this work we investigate the effect of magnetic nano metal oxides doping to YBCO superconductor with different magnetic moments and different concentrations. The influence of this difference in magnetic moment and concentration on the microstructure and its critical temperature are studied in details.
2. Experimental details
2.1. Preparing nano metal oxides
Nano metal oxides have been prepared by the co-precipitation method [15–17]. The chemicals used were of analytical grade and used without further purification. Manganese chloride (MnCl2 · 4H2O), cobalt chloride (CoCl2 · 6H2O), chromium chloride (CrCl3 · 6H2O) and oxalic acid (C2H2O4 · 2H2O) with purity 99.5% are used. Oxalic acid and each metal chloride were dissolved in water separately to a concentration of 0.1 M. The aqueous metal chloride solution was put in a 100 ml burette and is allowed to drip in the flask containing the oxalic acid solution. The dripping process was completed in 30 min. After which, 5 ml ammonia solution (NH4OH) was added drop by drop in the solution to increase the pH value of the prepared solution and then the two solutions interact and the corresponding metal oxalate precipitate in water. During precipitation the solution is subjected to magnetic stirring at the rate of 550 rpm. The resultant precipitated oxalate solution has been kept in an oven for drying over night at 90 °C then the dried product is grinded in powder form and put in furnace at 700 °C for 5 h to obtain nano metal oxide powder except of manganese oxalate which calcinated at 1100 °C for 2 h to obtain Mn3O4 phase.
2.2. Doping YBCO with nano metal oxides
YBCO powder is prepared by the solid state reaction route by mixing stochiometric amount of Y2O3, BaCO3, CuO followed by grinding, calcinations and sintering as previously described in details in our previous work [18].
A series of polycrystalline composite samples of YBCO + x where x = 0.1, 0.2, 0.3, 0.4 and 0.5 wt% of each metal oxide namely Cr2O3, Mn3O4 or Co3O4 were mixed separately and pressed into pellets. The pellets were sintered according to the same curve of heat treatment as in reference [18]. XRD was done for phase conformation and structural analysis using x-ray diffractograms provided with computer controlled formally made by the PHILIPS®MPDX´PERT x-ray diffratometer equipped with Cu radiation CuKα (λ = 1.540 56 Å). The x´pert diffractometer has the Bragg-Brentano geometry. The x-ray tube used was a copper tube operating at 40 KV and 30 mA. The scanning range (2θ) was 20–80° with step size of 0.02° and counting time of 3 s/step. Quartz was used as the standard material to correct for the instrumental broadening. The transmission electron microscope (TEM) images were taken for the prepared metal oxides using a JEDL model 1230. Scanning electron microscope (SEM) was used for microstructural analysis using Philips XL 30 equipped with EDX unit, accelerating voltage of 30 kV, magnification up to 400 000×, and resolution for W (3.5 nm). Temperature dependent resistivity ρ(T) was measured using the standard four-probe techniques with a 182‐Keithley nanovoltmeter and constant current source (224‐Keithley), with the voltage resolution of 10–8 V of the nanovoltmeter, a constant current source of 1 mA flowing through the samples. A closed cycle helium refrigerator consists of cryo‐compressor (model 531‐120‐IBARA), cooled head (model CCS‐100EB‐JAUS RESEARCH Co.), supplied with a suitable holder, vacuum pump (model RVB‐EDWARDS) and a temperature controller (321‐autotuning temperature controller‐LAKESKORE) having a temperature resolution of ±0.1 K was used for temperature variation.
3. Results and discussion
3.1. TEM images of prepared nano metal oxides
The metal oxides of Mn3O4, Cr2O3 and Co3O4 are investigated by transmission electron microscope and its results are shown in figure 1. In our previous study [18], x-ray powder diffraction was done to obtain the particle size of the prepared metal oxides. The particle size is in the nano scale range (75–82 nm).

Figure 1. TEM images of oxides (a) Co3O4, (b) Mn3O4 and (c) Cr2O3.
Download figure:
Standard image High-resolution imageFrom TEM measurement, all the prepared samples are in the nano scale and show spherical shape with 75–82 nm size range in agreement with the particle size calculated from the XRD patterns of the all prepared metal oxide samples.
3.2. XRD analysis of YBCO samples
Figure 2 shows the powder x-ray diffraction patterns of the YBCO samples doped with different nano metal oxides. The analysis of the data indicates a predominantly single phase perovskite structure YBCO with orthorhombic Pmmm symmetry and small quantities of secondary phases.

Figure 2. XRD of YBCO doped different oxides (a) Co3O4, (b) Mn3O4 and (c) Cr2O3 at different concentration x: YBCO + x wt% with x = 0.0, 0.1, 0.2, 0.3, 0.3, 0.4 and 0.5.
Download figure:
Standard image High-resolution imageThe lattice parameters of YBCO with orthorhombic structure are a0 = 3.823 Å, b0 = 3.885 Å, c0 = 11.7 Å. It should be mentioned that no peaks corresponding to any other compounds were detected by x-ray diffraction. Unit cell volumes and the lattice parameters of these samples are presented in table 1. It may be noticed that the lattice constants a, b and c changes slightly with doping with different nano metal oxides as shown from table 1. Generally, the addition of nano metal oxides slightly decrease the difference between a and b parameters and thus reduces the orthorhombicity (δ). The high value of orthorhombicity of undoped YBCO sample is the result of a high oxygen content of the undoped YBCO sample with fully occupied O(1) sites in the CuO chains along the b-axis as shown from the O7−δ value which increased with nano metal oxide content indicate that the orthorhombicity of the system decreases. The low variation in the a-axis and changes in the unit cell volume with increasing nano metal oxide (Mn+2, Mn+3, Co+2, Co+3 and Cr+3) doping level most probably indicate that metal ions are incorporated into crystal structure.
Table 1. The doped samples of YBCO with different proportions of various oxides.
| Samples of YBCO + x (wt%) | a (Å) | b (Å) | C (Å) | V (Å3) | δ = (b − a)/(b + a) | O7−δ |
|---|---|---|---|---|---|---|
| YBCO | 3.823 | 3.885 | 11.68 | 173.4755 | 0.008 043 591 | 6.8519 |
| YBCO + 0.1 Co3O4 | 3.841 18 | 3.884 35 | 11.688 33 | 174.3956 | 0.005 587 966 | 6.803 1395 |
| YBCO + 0.2 Co3O4 | 3.8459 | 3.8796 | 11.6894 | 174.4123 | 0.004 362 177 | 6.796 8736 |
| YBCO + 0.3 Co3O4 | 3.850 259 | 3.869 809 | 11.676 39 | 173.9755 | 0.002 532 348 | 6.873 0602 |
| YBCO + 0.4 Co3O4 | 3.812 788 | 3.939 62 | 11.611 29 | 174.4124 | 0.016 360 336 | 7.254 2858 |
| YBCO + 0.5 Co3O4 | 3.858 127 | 3.880 718 | 11.728 98 | 175.6098 | 0.002 919 169 | 6.565 0931 |
| YBCO + 0.1 Mn3O4 | 3.834 756 | 3.884 79 | 11.689 47 | 174.1406 | 0.006 481 469 | 6.796 4637 |
| YBCO + 0.2 Mn3O4 | 3.8277 | 3.8866 | 11.662 | 173.4925 | 0.007 635 171 | 6.957 328 |
| YBCO + 0.3 Mn3O4 | 3.8549 | 3.865 079 | 11.728 98 | 174.7559 | 0.001 318 527 | 6.565 0931 |
| YBCO + 0.4 Mn3O4 | 3.823 697 | 3.903 938 | 11.689 47 | 174.4943 | 0.010 383 643 | 6.796 4637 |
| YBCO + 0.5 Mn3O4 | 3.833 687 | 3.894 56 | 11.666 52 | 174.1873 | 0.007 876 689 | 6.930 8589 |
| YBCO + 0.1 Cr2O3 | 3.814 336 | 3.892 39 | 11.611 29 | 172.3915 | 0.010 128 036 | 7.254 2858 |
| YBCO + 0.2 Cr2O3 | 3.853 | 3.8693 | 11.7346 | 174.9443 | 0.002 110 77 | 6.532 1824 |
| YBCO + 0.3 Cr2O3 | 3.848 597 | 3.874 925 | 11.734 62 | 174.9987 | 0.003 408 808 | 6.532 0653 |
| YBCO + 0.4 Cr2O3 | 3.840 856 | 3.877 13 | 11.684 79 | 174.004 | 0.004 699 931 | 6.823 8698 |
| YBCO + 0.5 Cr2O3 | 3.834 05 | 3.887 428 | 11.671 14 | 173.9536 | 0.006 912 925 | 6.903 8042 |
Table 2. EDX analysis of some YBCO samples doped with different nano oxides.
| Elemental analysis | Y (wt%) | Ba (wt%) | Cu (wt%) | O (wt%) | Co (wt%) | Mn (wt%) | Cr (wt%) |
|---|---|---|---|---|---|---|---|
| YBCO + 0.4 wt% Co3O4 | 10.07 | 47.14 | 30.46 | 11.33 | 1.01 | ||
| YBCO + 0.5 wt% Mn3O4 | 9.88 | 47.95 | 30.00 | 11.63 | 0.55 | ||
| YBCO + 0.5 wt% Cr2O3 | 7.92 | 49.19 | 27.19 | 13.30 | 2.58 |
3.3. Microstructural study
The scanning electron microscopic (SEM) images of YBCO doped 0.2, 0.4 and 0.5 wt% of Co3O4, Mn3O4 and Cr2O3 samples are presented in figures 3, 4 and 5, respectively. These pictures depict that the average grain size in all samples mostly does not change in most samples and the YBCO samples exhibits large grains randomly oriented in all directions with the presence of pores between the grains. For each doping of nano oxides, it is shown that nanodots are distributed randomly over the YBCO grains mostly. From graphs it is obvious that the grains of all samples are in the same range 1–4 μm.
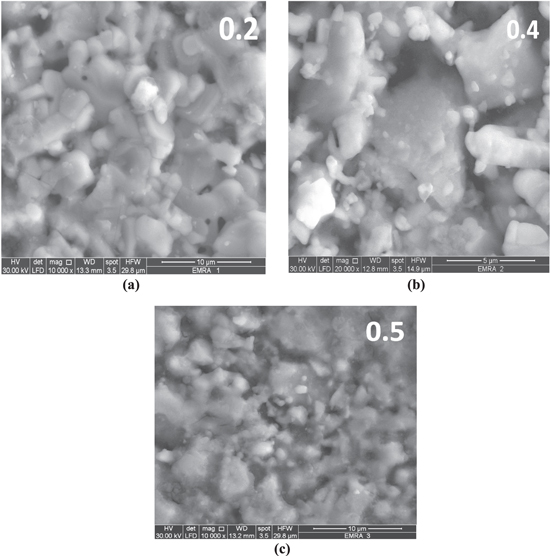
Figure 3. SEM photographs of YBCO doped (a) 0.2 wt%, (b) 0.4 wt% and (c) 0.5 wt% nano cobalt oxide (Co3O4).
Download figure:
Standard image High-resolution image
Figure 4. SEM photograph of YBCO doped (a) 0.2 wt%, (b) 0.4 wt% and (c) 0.5 wt% nano manganese oxide (Mn3O4).
Download figure:
Standard image High-resolution image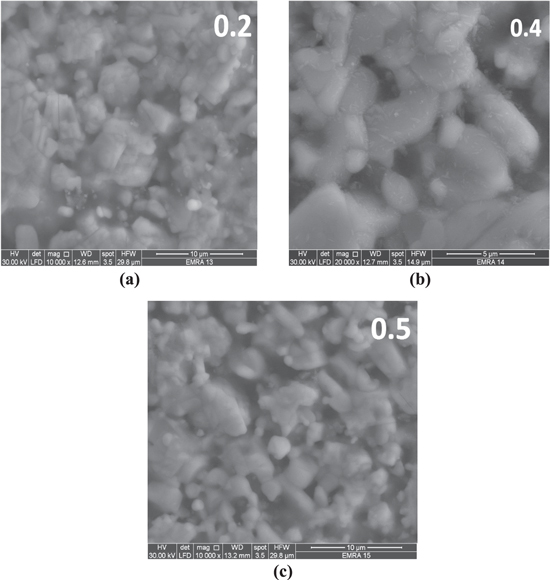
Figure 5. SEM photograph of YBCO doped (a) 0.2 wt%, (b) 0.4 wt% and (c) 0.5 wt% nano chromium oxide (Cr2O3).
Download figure:
Standard image High-resolution imageThe EDX analysis of 0.4 wt% Co3O4 and 0.5 wt% of Mn3O4, Cr2O3 samples are represented in table 2, one can note that each of Mn3O4 and Co3O4 is distributed over the entire surface of the granules as points in the nanosize range, conversely Cr2O3 tends to merges through the structure between or covering the YBCO grains (as shown in figures 3, 4 and 5).
Table 3. Variation of normal state and superconducting parameters in different samples.
| Samples |
 (K) (K) |
Tc (K) | ΔT (K) | ρ0 (mΩ.cm) |
|---|---|---|---|---|
| YBCO | 87 | 92 | 5 | 2.18 |
| YBCO + 0.1 wt% Co3O4 | 83 | 92 | 9 | 2.1 |
| YBCO + 0.2 wt% Co3O4 | 71 | 81 | 10 | 3.13 |
| YBCO + 0.3 wt%Co3O4 | 60 | 74 | 14 | 30 |
| YBCO + 0.4 wt%Co3O4 | 43 | 60 | 17 | 27 |
| YBCO + 0.5 wt% Co3O4 | 62 | 83 | 21 | 15 |
| YBCO + 0.1 wt% Mn3O4 | 110 | 119 | 9 | 5.3 |
| YBCO + 0.2 wt%Mn3O4 | 106 | 112 | 6 | 5.8 |
| YBCO + 0.3 wt% Mn3O4 | 78 | 89 | 11 | 6.4 |
| YBCO + 0.4 wt% Mn3O4 | 62 | 71 | 9 | 7.6 |
| YBCO + 0.5 wt%Mn3O4 | 90 | 100 | 10 | 10 |
| YBCO + 0.1 wt%Cr2O3 | 70 | 78 | 8 | 6.1 |
| YBCO + 0.2 wt%Cr2O3 | 68 | 80 | 12 | 4.7 |
| YBCO + 0.3 wt%Cr2O3 | 70 | 79 | 9 | 5.2 |
| YBCO + 0.4 wt%Cr2O3 | 54 | 62 | 8 | 4.5 |
| YBCO + 0.5 wt%Cr2O3 | 78 | 86 | 8 | 5.65 |
3.4. Temperature dependence of resistivity
The temperature dependence of resistivity ρ(T) for doped YBCO samples with different concentrations of Co, Mn and Cr nano oxides are shown in figure 6. Generally, all samples show metallic behavior in the normal state (dρ/dT > 0) and superconducting transition to zero resistance. At higher temperature, all samples exhibited linear temperature dependence. The resistive transition exhibits two different regimes. The first is characterized by the normal state that shows a metallic behavior (above 2Tc). The normal state resistivity is found to be linear from room temperature to a certain temperature and follows Andersom and Zou relation ρ(T) = A + BT, where ρ(T) is calculated by using the values of A and B parameters which are obtained from the linear fitting of resistivity in the temperature range 2Tc to 300 K and extrapolation to 0 K gives resistivity slope (dρ/dT) and residual resistivity ρ0 as seen from figure 6. The second region is characterized by the contribution of Cooper pairs fluctuation to the conductivity below Tc, where ρ(T) is deviated from linearity. This is mainly due to the increasing rate of Cooper pair formation on decreasing the temperature. Note that doping with Co3O4 shows degradation of Tc from 92 to 83 with increasing the doping concentration, whereas the residual resistivity ρ0 increased with the increasing the doping concentration as seen in figure 6(a). Figure 6(b) shows that doping YBCO with different concentrations of nano Mn3O4 improves Tc to 119 K and 112 K at low doping ratios and then decreases Tc with increasing concentrations (0.3 and 0.4 wt%) and, finally slightly improves again at 0.5 wt% to become 100. The residual resistivity ρ0 of YBCO samples doped with Mn3O4 increased with the increasing the doping ratio. Figure 6(c) shows that YBCO samples doped with different concentrations of Cr2O3 exhibit the decay of the resistivity at Tc for all doping ratios, and the value of the residual resistivity ρ0 oscillates, decreasing and increasing again with the increase of doping concentration. The transition width (ΔT) increases with increasing doping concentration of all the three doping nano metal oxides (Co3O4, Mn3O4 and Cr2O3) and this may be due to the gradual occurrence of non-superconducting additional phases and the effect of microscopic in-homogeneity.
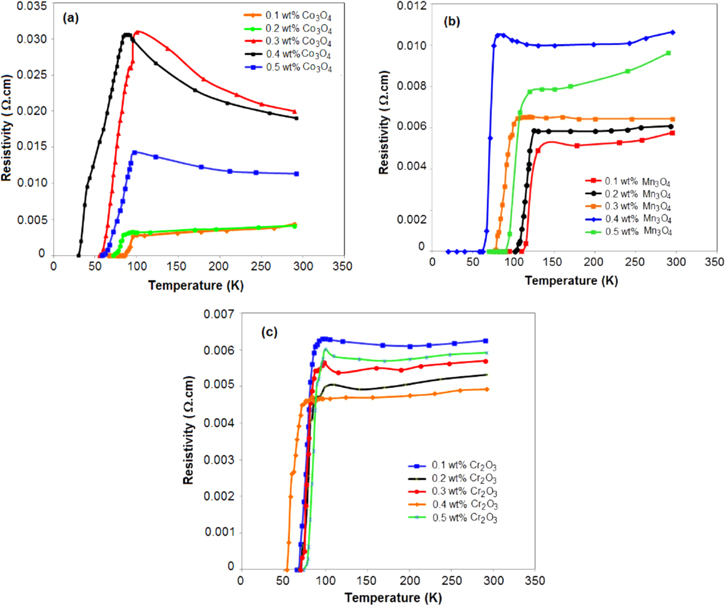
Figure 6. Resistivity dependences on the temperature for YBCO doped (a) 0.1, 0.2, 0.3, 0.4 and 0.5 wt% Co3O4 nano oxide; (b) 0.1, 0.2, 0.3, 0.4 and 0.5 wt% Mn3O4 nano oxide and (c) 0.1, 0.2, 0.3, 0.4 and 0.5 wt% Cr2O3 nano oxide.
Download figure:
Standard image High-resolution imageFigure 7 represents the variation of Tc of all the prepared samples as a function of concentration for each doping. One can note that Tc decreases with increasing magnetic moment for all nano metal oxide doping. The decrease of Tc with increasing concentration of Cr2O3, Co3O4 doping evidences substitutions in the YBCO. It was reported earlier that, the CuO2 sheet in the YBCO structure is a superconducting layer (S) whereas the CuO chain layer is a non-superconducting (N) [19]. The hopping interaction between these S-N layers leads to the suppression of Tc [20, 21]. Additionally, the decrease of Tc with doping nominal concentration confirms that Cu atoms in YBCO crystals lattice were partially substituted. Some differences in Tc decrease in comparison with undoped YBCO may be caused by solidification process as well as by the formation of secondary phases rich in doping. For Mn3O4 doping one can note that, there is the increase in transition temperature up to 0.2 wt% which may be due to the Mn inclusion which reduces the formation of other YBCO phases and enhances the formation of YBCO. However, the decrease in Tc with increasing Mn content above 0.2 wt% indicates that Mn ions have been incorporated into the YBCO structure, which results in some changes of microstructure and chemical properties of CuO2 planes. Moreover, the possible Cooper-pair breaking effect of magnetic ions is known to depress the transition temperature through the short range exchange scattering.

Figure 7. Critical temperature Tc (K) vesus doping (wt%) of YBCO doped different nano oxides with different ratios.
Download figure:
Standard image High-resolution image
Table 3 represents the variation of normal state and superconducting parameters of all samples. It indicates that the values of ρ0 depend on the type of doping. In general ρ0 increases due to the doping. When the doping ratio increases, the value of ρ0 for Co3O4-doped YBCO samples at first increases, then at 0.3 wt% it turns into a decay. Conversely, Mn3O4- and Cr2O3-doped samples show the monotone behavious: ρ0 of Mn3O4-doped samples increases and that of Cr2O3-doped ones decreases with increasing doping ratio. The increasing value of ρ0 and the decreasing trend in the value of zero-resistance critical temperature ( indicate that the connectivity between grains decreases gradually with the increasing the doping concentration of all oxides. All these effects are due to increased inhomogeneities in the intergranular regions. Point defects and chemical dopants may occupy various positions in a real crystal forming substituent or interstitial impurities.
4. Conclusion
Beside the magnetic moment, ionic charge and ionic radii are affecting the value of Tc in doped YBCO samples which may be the reason behind the conflicting results for every doping with different concentrations. It was found that the doping with Cr2O3 (3.8 μB) and Co3O4 (3.02 μB) slightly depressed Tc. Furthermore doping with high magnetic moment Mn3O4 (5.27 μB) increased Tc significantly which is attributed to the inclusion of Mn in the YBCO matrix reducing the formation of other YBCO phases and enhancing the formation of YBCO with high orthorhombicity and high superconducting properties. Mn3O4 induced nano-pinning centers which have high pinning efficiency and may be one of the main factors for improving the performance of YBCO by improving Tc.