

Abstract
In this study, we report synthesis of silver nanoparticles (RcAgNPs) from silver nitrate solution using methanolic leaf extract of Ricinus communis var. carmencita. The polyphenols present in the leaves reduce Ag++ ions to Ag0 followed by a color change. Silver nanoparticle formation was ensured by surface plasmon resonance between 400 nm to 500 nm. Crystallinity of the synthesized nanoparticles was confirmed by UHRTEM, SAED and XRD analysis. The capping of phytochemicals and thermal stability of RcAgNPs were assessed by FTIR spectra and TGA analysis, respectively. It also showed antibacterial activity against both gram positive and gram negative strains. RcAgNPs were non-toxic against normal cell line (mouse fibroblast cell line L929) at lower concentrations (80 µg ml−1).
Export citation and abstract BibTeX RIS

Original content from this work may be used under the terms of the Creative Commons Attribution 3.0 licence. Any further distribution of this work must maintain attribution to the author(s) and the title of the work, journal citation and DOI.
1. Introduction
Nanotechnology being an interdisciplinary research area imparts broad spectrum applications in medicines, biomedical sciences, drug and gene delivery, cosmetics, food and feed, mechanics, optics, electronics, energy science, optoelectronic applications, single electron transistors, space industries and chemical industries. The unique physicochemical characteristics such as size, distribution and morphology, surface plasmon resonance (SPR) of the nanoparticles have been explored to meet the current research trends. Among other metallic nanoparticles, silver nanoparticles (AgNPs) offer various applications in biomedical field. Although non-toxic to animal cells, the toxicity of silver nanoparticle to bacterial cells makes them a safe and effective bactericidal agent [1]. Apart from medicines/drugs, they are also used in household products like toothpaste, shampoo, washing machines, water purifiers, humidifiers, cloth, paints, electronics etc [2]. Considering their wide applications, synthesis of silver nanoparticles of unique size with a characteristic dispersity and composition is a key area of research [3]. The silver nanoparticles can be synthesized by physical, chemical or biological cues. Vapor condensation and arc discharge are common physical methods of AgNPs synthesis [4]. AgNPs are also chemically synthesized by reduction process, photochemical method (irradiation), electrochemical (electrolysis) and pyrolysis method. Plants and microorganisms are explored as biological source for nanoparticle synthesis which is referred as 'green synthesis' of silver nanoparticles [5]. Microorganisms trap metal ions from environment and convert them to nanoparticles by enzymatic process. Plants contain strong reducing agents such as polyphenols, terpenoids, phenolic acids, alkaloids, sugars and proteins which are key players for bio reduction of silver ions (Ag++) due to presence of several −OH groups [6]. In contrary to physical and chemical method, green synthesis of nanoparticles uses and generates minimal environmentally harmful chemicals. Thus this is an efficient, inexpensive and environment friendly method to synthesize immensely important nanoparticles [7].
Silver nanoparticles have been widely explored as antimicrobials along with other application areas such as optoelectronics, biosensors, catalysis and surface enhanced Raman scattering (SERS) [8]. Ag+ ion as an anti-bacterial agent is delimited by it's easy inactivation through complexation and precipitation, whereas silver nanoparticle possess higher bactericidal activity due to its larger surface area [9, 10]. These nanoparticles inhibit bacterial cell division causing membrane damage and increased cell permeability which finally leads to cell death [11]. Bacterial proliferation also decreases when the functional groups present on nanoparticle surface interact with bacterial membrane proteins, phospholipids, lipoproteins and lipotechoic acids and declining their colonization and surface adherence [12].
Recent reports suggest the synthesis of silver nanoparticles using Averrhoa carambola fruit extract and Solidago altissima leaf extract having antibacterial and photocatalytic properties [13, 14]. Moreover green synthesis of silver nanoparticles has also been carried out using an endophytic fungi Penicillium species of Glycosmis mauritiana [15]. The extract from Padina tetrastromaticai and carbohydrates secreted from microalgae Chlorella vulgaris has also been used to synthesize silver nanoparticles having anticancer activities [16, 17].
In this paper we have exploited Ricinus communis var. carmencita leaf extract as 'green chemical' to synthesize silver nanoparticle (RcAgNP). We further characterized its physical, optical and thermal property along with its antibacterial activity against gram positive and gram negative strains.
2. Materials and methods
2.1. Preparation of leaf extract
Ricinus communis var. carmencita leaves were collected from the IIT Guwahati campus, Guwahati, India. Leaves were cleaned, dried in shade and ground to fine powder. Methanolic extract of the leaves was prepared by cold maceration process [18]. The extract was evaporated to dryness under reduced pressure and further solubilized in methanol to a final concentration of 1.0 mg ml−1.
2.2. Estimation of antioxidant activity of leaf extract
Antioxidant activity of Ricinus communis var. carmencita leaf extract was assessed by 2, 2-diphenyl-1-picrylhydrazyl (DPPH) standard method with minor modifications [19]. Various concentrations (10–100 µg ml−1) of ascorbic acid and extract were prepared from 1 mg ml−1 concentration in methanol. 0.1 mM DPPH was mixed with extract in 9:1 (v/v) ratio and kept for 30 min in dark at room temperature. In this assay ascorbic acid was used as standard and DPPH as blank. Absorbance was measured at 517 nm in UV–Vis spectrophotometer (Tecan i-control, 1.11.1.0). The percentage inhibition was calculated using the following formula

where AC is absorbance of control and AS is absorbance of sample at 517 nm.
2.3. Estimation of total phenolic content of leaf extract
Total phenolic content was estimated using Folin–Ciocalteu reagent [20]. 0.5 ml of leaf extract (1 mg ml−1) was mixed with 2.5 ml of 10% Folin–Ciocalteu reagent. Another 2.5 ml of sodium carbonate was added followed by incubation at 45 °C for 45 min. Then absorbance was measured at 765 nm using UV–Vis spectrophotometer (Tecan i-control, 1.11.1.0). Different concentrations of gallic acid standard (10–100 µg ml−1) were prepared in methanol. The total phenolic content of the extract was determined from the linear equation obtained from gallic acid standard curve [21].
2.4. Green synthesis of silver nanoparticle using Ricinus communis var. carmencita leaf extract
In a 1 ml reaction mixture, 10 µg ml−1 leaf extract (in methanol) was added to 1 mM silver nitrate solution (in miliQ) at different ratios 1:1, 1:2 and 1:3, and the volume was made up by addition of water. The solution was mixed by gentle shaking and kept at room temperature for 24 h. Then absorbance was scanned from 300–800 nm wavelength by UV–Vis spectrophotometer (Tecan i-control, 1.11.1.0)
After 24 h, the reaction mixture was centrifuged at 13 000 rpm for 10 min to pellet down the silver nanoparticles (RcAgNPs). Then the pellet was washed with deionized water to remove leaf extract residues. This step was repeated twice and lyophilized to obtain RcAgNPs in powder form to be used for further characterization.
2.5. Characterization of RcAgNP
2.5.1. UV–Vis spectroscopy.
In a 1 ml reaction volume, varying ratio (1:1, 1:2 and 1:3) of leaf extract and silver nitrate solution were mixed and kept for 24 h at room temperature. Absorbance of synthesized silver nanoparticle was measured at UV–Vis spectrum i.e. 300 nm–800 nm wavelength using UV–Vis spectrophotometer (Tecan i-control, 1.11.1.0).
2.5.2. Transmission electron microscope (TEM) studies.
The silver nanoparticles were suspended in deionized water and sonicated. A drop of dispersed RcAgNP was placed on a copper grid and kept at 37 °C for drying. Transmission electron microscopy was performed to confirm the size of the nanoparticles (Make: JEOL, Model: JEM-100 CX II).
2.5.3. X-ray diffraction (XRD) studies.
A thin film of uniformly water suspended RcAgNP was prepared on a glass slide and kept for drying. X-ray diffraction (XRD) studies of the RcAgNP thin film was carried out in x-ray diffractometer at 2theta/theta scanning mode (operational voltage 50 kV and current 180 mA, Cu-Kα radiation λ = 1.540 Å with 20 min−1 scanning rate).
2.5.4. Fourier transform infrared (FTIR) analysis.
Leaf extract dissolved in methanol was used for FTIR analysis. RcAgNPs were suspended in water and sonicated to get a uniform suspension. FTIR analysis of leaf extract and RcAgNPs was carried out using IRAffinity-1 (Shimadzu) by ATR method in transmittance mode from 600 cm−1 to 4000 cm−1 with resolution at 4.0 cm−1.
2.5.5. Thermogravimetric analysis (TGA) and differential thermal analysis (DTA).
The STA7200 thermal analysis system, Hitachi was used to perform TGA and DTA studies. The RcAgNPs in powder form obtained after lyophilization was used for TGA and DTA analysis. An alumina crucible tied with another crucible (reference) was cleaned with acetone and kept next to the other without touching each other. 8.6 mg of RcAgNP was kept in the crucible and subjected to heating at 10 °C min−1 increasing rate from 40 °C to 900 °C with constant flow of nitrogen gas at a flow rate 40 ml min−1. Nitrogen gas level was checked regularly in between the analysis.
2.5.6. Antibacterial studies.
Antibacterial studies were carried out by resazurin method with two gram negative strains (Enterobacter aerogenes (E. aerogenes) and Escherichia coli (E. coli)) and three gram positive strains (Bacillus subtilis (B. subtilis), Streptococcus zooepidemicus (S. zooepidemicus) and Staphylococcus aureus (S. aureus)).
2.5.6.1. Antibacterial assay by resazurin method.
The antibacterial activity of RcAgNP were evaluated by resazurin method [22]. Both gram positive and gram negative strains were tested for antibacterial activity of RcAgNPs. A uniform number of bacterial cells i.e. 5 × 10⁵ cfu ml−1 was maintained in this assay. RcAgNPs were suspended in deionized water at a concentration of 1 mg ml−1. The nanoparticle suspension was sonicated to disperse nanoparticles uniformly and various dilutions were prepared from 1 mg ml−1 RcAgNP stock suspension. Resazurin solution was prepared by dissolving 270 mg resazurin in 40 ml water. Sterile 96 well plate was used for the assay. Each well contained 50 µl of the nanoparticle, 10 µl of resazurin solution, 30 µl of Luria Bertani broth and 10 µl bacterial suspensions. Positive control contained kanamycin of same concentrations as that of nanoparticles along with other components. One set without nanoparticles or antibiotic and another set without bacteria were considered as negative controls. The plates were sealed with parafilm and kept at 37 °C for 24 h in static condition.
2.5.6.2. Growth curve analysis of RcAgNP treated E. aerogenes.
Growth curve analysis of E. aerogenes treated with different concentrations of RcAgNPs (0, 20, 50 and 100 µg ml−1) was carried out to understand their growth pattern under RcAgNP treatment with time. Bacteria was inoculated in Luria Bertani broth and kept overnight at 37 °C temperature and shaking at 180 rpm. Then growth medium was inoculated to obtain 5 × 10⁵ cfu ml−1 of bacterial cells. Uniformly dispersed nanoparticle from 1 mg ml−1 stock suspension was diluted to obtain desired dilution. Bacterial culture without any treatment was considered as negative control and kept along with the treated ones at 37 °C and 180 rpm. Absorbance was measured at 600 nm for 10 h starting from the 0th hour i.e. just after the nanoparticle addition.
2.5.7. Cell viability assay.
Cytotoxicity of RcAgNP was assessed by 3-(4, 5-dimethylthiazole-2-yl)-2,5-diphenyltetrazolium bromide (MTT) assay in mouse fibroblastic cell line L929 as mentioned in [23]. In a 96 well plate, each well was seeded with 1 × 10⁴ cells in 100 µl cell culture medium (Dulbecco's modified eagle medium (DMEM)) with 10% fetal bovine serum. A series of RcAgNP dilutions (5–100 µg ml−1) were prepared in serum free culture medium from 1 mg ml−1 stock suspension for the treatment. After 24 h of seeding each well was treated with 100 µl of UV sterilized uniformly suspended RcAgNP. Negative control did not contain any test material. After 24 and 48 h incubation culture medium was discarded and 100 µl of MTT at 0.5 mg ml−1 concentration in serum free culture medium was added and kept for 4 h incubation. Blue formazan crystals formed thereafter were solubilized in 100 µl of DMSO. The absorbance was measured at 570 nm with reference wavelength at 690 nm using Elisa plate reader (Tecan i-control, 1.11.1.0). Cell viability assay was expressed with the following equation

where NT, NC are absorbance of nanoparticle treated and negative control cells, respectively.
3. Results and discussions
3.1. Reducing capacity R. communis var. carmencita leaf extract and RcAgNP synthesis
Antioxidant activity of the R. communis var. carmencita leaf extract was assessed by DPPH method. A linear curve was obtained on plotting percentage inhibition against concentration separately for standard and extract. Half maximal inhibitory concentration (IC50) was calculated using linear equation obtained from standard curve and was found to be 7.45 µg ml−1 whereas for ascorbic acid the value was 2.84 µg ml−1. The total phenolic content of the leaves was found to be 12.42 GAE mg−1.
The color change of silver nitrate solution from clear solution to golden yellow color upon addition of Ricinus communis var. carmencita leaf extract indicates the reducing potency of phytochemicals present in it which is related to the total phenolic content of the leaves.
3.2. Physical and optical properties of RcAgNPs
3.2.1. UV–Vis spectroscopic analysis.
The color change of the silver nitrate solution from transparent to golden yellow color was observed after addition of leaf extract at an optimal ratio. This color change is due to the excitation of surface plasmonic vibrations of silver nanoparticles [24]. Absorbance spectra of all the prepared solutions containing varying ratios of leaf extract (10 µg ml−1) and silver nitrate (1 mM) has been depicted in figure 1. A peak at 442 nm wavelength indicated the SPR of the synthesized silver nanoparticles in the solution containing leaf extract and silver nitrate at 1:3 ratio. The SPR peak reached its maxima at 430 nm after 24 h of addition of all the components which articulates maximum reduction of silver ions after 24 h. UV–Vis absorption spectrum of the reaction mixture was measured for 24 h at 2 h interval. From the absorbance spectra (figure 2) it has been observed that the absorbance of nanoparticles intensified with time at 430 nm. Highest absorbance was recorded at 24 h of the synthesis of nanoparticle at room temperature.
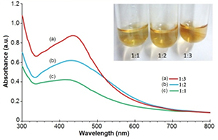
Figure 1. UV–Vis absorption spectra of nanoparticle synthesized at different ratios (1:1, 1:2 and 1:3) of leaf extract (10 µg ml−1) to AgNO3 solution (1 mM) at room temperature. Inset: silver nanoparticle synthesis showing color change with change in ratio of plant extract and AgNO3 solution.
Download figure:
Standard image High-resolution image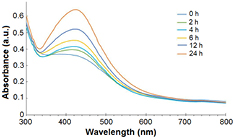
Figure 2. UV–Vis absorption spectrum of RcAgNPs at different time intervals.
Download figure:
Standard image High-resolution image3.2.2. TEM analysis.
Transmission electron microscope (TEM) study was performed to estimate the shape and size of the nanoparticles. RcAgNPs synthesized were mostly seen in spherical shape (figures 3(a) and (b)). Size varied from 30–40 nm when analyzed under TEM model JEM-2100. Lattice fringes with 0.13 nm spacing were observed on the nanoparticle surface in ultra-high resolution TEM (UHRTEM) images (figure 3(c)) which correspond to the (2 2 0) crystal planes of silver nanoparticle [25]. Selected area electron diffraction pattern image (figure 3(d)) showed concentric rings with bright spots due to Braggs reflection coming from separate crystals thereby affirming the crystallinity of the RcAgNPs [26].

Figure 3. TEM images at (a) lower magnification, (b) higher magnification; (c) UHRTEM image and (d) SAED image of RcAgNPs.
Download figure:
Standard image High-resolution image3.2.3. XRD analysis.
XRD pattern of RcAgNP is presented in figure 4. XRD analysis of RcAgNPs showed presence of Bragg's peaks at 2θ values 27.81°, 32.19°, 38.16°, 44.43°, 46.23°, 54.93°, 57.39, 64.65°, 77.61° corresponding to (2 1 0), (1 2 2), (1 1 1), (2 0 0), (2 3 1), (1 4 2), (2 4 1), (2 2 0) and (3 1 1) planes of silver metals based on face centered cubic structure as per described in [27, 28]. Thus the XRD studies confirm the crystallinity of RcAgNPs.

Figure 4. XRD pattern of RcAgNPs.
Download figure:
Standard image High-resolution image3.2.4. FTIR analysis.
Green synthesized nanoparticles are stabilized by capping with phenolic constituents of leaf extract which are responsible for the Ag++ reduction. Therefore FTIR studies of RcAgNPs and leaf extract was performed to distinguish plant phenolic compounds capping on RcAgNP surface. Figure 5 showed common absorbance at 3443 cm−1 and 1631 cm−1 corresponding to alcohol O–H stretch, and N−H bond of amine groups respectively which ensures capping of the nanoparticles with these functional groups. Absorbance at 2054 cm−1 in RcAgNP spectrum and at 2046 cm−1 in leaf extract spectrum were also observed which correspond to C = O stretch. Due to capping of the nanoparticles with these functional groups the stability of nanoparticles was maintained.
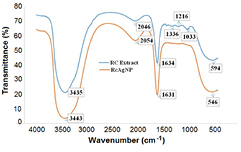
Figure 5. FTIR analysis of RcAgNPs and Ricinus communis var. carmencita leaf extract.
Download figure:
Standard image High-resolution image3.2.5. TGA and DTA analysis.
Thermal analysis was carried out to study thermal characteristics of RcAgNPs. TGA reports change in mass with temperature, which in turn indicates thermal stability, material purity and moisture content of the nanoparticles. From the thermo gravimetric curve shown in the figure 6, it is visible that loss of nanoparticle weight was two stage process. In the first stage 12% of the initial weight of nanoparticles was lost between 200 °C to 440 °C and in the second stage, 15% weight was lost between 440 °C to 900 °C. There was almost no loss of weight till 180 °C. The weight loss of RcAgNPs might be due to the presence of moisture content and organic residues sourced from leaf extract [23].
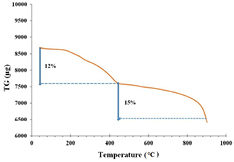
Figure 6. TGA analysis of RcAgNPs.
Download figure:
Standard image High-resolution imageAnother thermal analysis, DTA reports change in temperature of sample with respect to reference when subjected to heat. In the DTA curve (figure 7), a peak at 398 °C temperature infers that the weight loss due to decomposition of organic residues was an exothermic reaction [28]. Both TGA and DTA analysis suggests that RcAgNPs were stable up to 200 °C.
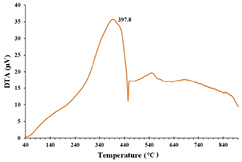
Figure 7. DTA analysis of RcAgNPs.
Download figure:
Standard image High-resolution image3.2.6. Antibacterial assay. Resazurin method.
The minimum inhibitory concentration was determined from the color of resazurin which is an indicator of the bacterial growth. Oxidoreductase enzymes present in viable cells reduce non-fluoresent and non-toxic resazurin dye to resorfurin which is pink in color. Resorufin on further reduction becomes hydroresorufin which is colorless [22]. Therefore blue color indicates no bacterial growth whereas pink color denotes presence of viable bacterial cells (figure 8). The MICs of RcAgNP and kanamycin for bacterial strains at 5 × 10⁵ cfu ml−1 were listed in table 1. Membrane damage and distorted morphology in RcAgNP treated E. aerogenes was observed in FESEM images (figure 8) whereas the untreated bacterial cells had intact cell membrane.
Table 1. List of minimum inhibitory concentrations of RcAgNP and kanamycin against bacterial strains.
| No. | Bacterial strain (5 × 10⁵ cfu ml−1) | MIC of RcAgNP (µg ml−1) | MIC of kanamycin (µg ml−1) |
|---|---|---|---|
| 1 | E. aerogenes (MTCC No. 2824) | 100 | 10 |
| 2 | E. coli (MTCC No. 443) | 20 | 10 |
| 3 | B. subtilis (BS168GW) | 10 | 10 |
| 4 | S. zooepidemicus (SZ3523) | 20 | 250 |
| 5 | S. aureus (NCIM 2901) | 10 | 10 |

Figure 8. FESEM images of (a) untreated E. aerogenes, (b) RcAgNP treated E. aerogenes; (c) antibacterial assay by Resazurin method.
Download figure:
Standard image High-resolution imageFrom the resazurin antibacterial assay, it can be inferred that RcAgNPs possess bactericidal activity against both gram positive and gram negative strains listed above. RcAgNPs has the maximum inhibition against B. subtilis and S. aureus in comparison to other strains used in this experiment. RcAgNP inhibited growth of E. aerogenes at 100 µg ml−1. However RcAgNP inhibited E. coli and S. zooepidemicus growth at a little higher concentration. Interestingly kanamycin had lesser inhibitory effect on S. zooepidemicus at 10 µg ml−1 which was the MIC value for RcAgNP. Figure 9 shows growth curve of E. aerogenes treated with RcAgNPs of different concentrations (0, 20, 50 and 100 µg ml−1) for 10 h. From the growth curve it was evident that growth of E. aerogenes increased with time in case of negative control, however E. aerogenes treated with nanoparticle had inhibited growth. Additionally E. aerogenes was not able to grow in presence of 100 µg ml−1. Absorbance at 0th hour of 100 µg ml−1 treated bacteria was higher due to the absorbance of nanoparticle suspended in the culture. It is also observed that at 50 µg ml−1 growth of E. aerogenes was inhibited similar to 100 µg ml−1 but, after 8th hour some of the viable bacteria could resist the nanoparticle treatment and started to grow.

Figure 9. Growth curve of E. aerogenes treated with RcAgNP at different concentrations.
Download figure:
Standard image High-resolution image3.2.7. Cell viability assay.
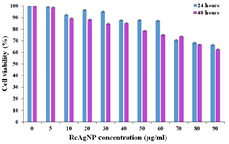
In this method, MTT is reduced to purple color formazan by mitochondrial dehydrogenase enzymes present in viable cells. This reduction reaction does not occur in the dead cells due to inactivity of mitochondrial dehydrogenase enzyme; hence no blue color is produced. After 24 h of the RcAgNP treatment at 0–60 µg ml−1 concentration, 80% mouse fibroblast cells were alive (figure 10) which shows that RcAgNPs were non-toxic to normal cells at 60 µg ml−1.
Figure 10. Cytotoxicity assay of RcAgNP in L929 cell line at 24 h and 48 h.
Download figure:
Standard image High-resolution image
4. Conclusion
Ricinus communis var carmencita is explored as a sustainable green chemical to synthesize silver nanoparticle. Essentially its phenolic elements are pivotal for silver ion reduction and antioxidant activity. The shape and size of the nanoparticle was found mostly spherical and in nanorange by TEM analysis. The crystallinity nature of the nanoparticles was confirmed by XRD and SAED analysis. FTIR analysis showed capping of the nanoparticle that ensures stability of the nanoparticles synthesized. Thermal analyses such as TGA and DTA establish their stability at higher temperature. Although the antibacterial activity of silver and silver nanoparticles are well-known but their activity depends on the size of the nanoparticles. Antibacterial activity of the RcAgNPs was evaluated against gram positive and gram negative bacteria by resazurin reduction assay and the results found to be noteworthy. Biocompatibility of the RcAgNPs were tested by MTT assay and was found to be non-toxic to normal mouse fibroblast cell lines at lower concentrations. Their activity against bacterial strains shows that RcAgNPs has the potential to be used as antimicrobial formulations.
Acknowledgment
We would like to thank Department of Biotechnology, New Delhi Government of India for providing us support and facility to carry out our research work at Institutional Biotech Hub, Centre for the Environment, IIT Guwahati (Project No. BT/04/NE/2009). SO and AS would also like to thank IITG and MHRD for the financial support in the form of fellowship. We extend our thanks to Department of Biosciences and Bioengineering, IIT Guwahati.