


ABSTRACT
Solid carbon dioxide (CO2) has long been recognized as a component of both interstellar and solar system ices, but a recent literature search has revealed significant qualitative and quantitative discrepancies in the laboratory spectra on which the abundances of extraterrestrial CO2 are based. Here we report new infrared (IR) spectra of amorphous CO2-ice along with band intensities (band strengths) of four mid-IR absorptions, the first such results in the literature. A possible thickness dependence for amorphous-CO2 IR band shapes and positions also is investigated, and the three discordant reports of amorphous CO2 spectra in the literature are addressed. Applications of our results are discussed with an emphasis on laboratory investigations and results from astronomical observations. A careful comparison with earlier work shows that the IR spectra calculated from several databases for CO2 ices, all ices being made near 10 K, are not for amorphous CO2, but rather for crystalline CO2 or crystalline-amorphous mixtures.
Export citation and abstract BibTeX RIS
1. INTRODUCTION
The analysis of astronomical spectra of interstellar and planetary ices continues to rely on laboratory spectra for the identification of molecules and ions. Such reference spectra must be accompanied by an unambiguous knowledge of ice composition, temperature, phase, history, and, to be applicable to the determination of molecular abundances, a quantitative measure of spectral intensity. As a specific case, recently we presented (Gerakines & Hudson 2015) new infrared (IR) results on solid methane (CH4), an ice that has been studied spectroscopically for many years. We showed that the relatively few IR spectra published exhibit a lab-to-lab consistency, yet most if not all spectra reported are for a wholly or partially crystalline ice, and not the amorphous phase that might be expected near 10 K in the interstellar medium (ISM).
We now find that a similar study of frozen CO2 is needed, motivated in part by the much greater interstellar abundance of CO2 ices compared to CH4 ices. In this paper we report new IR spectroscopic results on frozen CO2, one of the more-common interstellar and planetary icy solids. Despite decades of attention paid to this molecular ice, and a voluminous associated literature, our new work appears to be the first to quantitatively characterize the IR spectra of carbon dioxide's amorphous phase.
Relatively few papers have addressed explicitly the IR spectra of amorphous CO2, the first apparently being that of Falk (1987), who reported IR peaks at 2342.3 and 661.0  . The band shapes of these features lacked the sub-structure known for crystalline ices, and warming of Falk's samples generated spectra that were said, but not shown, to be for the crystalline material. In contrast to his work stands that of Escribano et al. (2013) who reported amorphous-CO2 spectra, but with IR peak positions at 2328 and 655
  , substantially different from those of Falk (1987) The thickness of the smallest ices of the former was on the order of a few nanometers compared to a few micrometers for the latter, raising the possibility that some of the spectral variations were due to different ice thicknesses. Recently, Sivaraman et al. (2013) have reported experiments in which amorphous CO2 was made at 30 K. Their peak positions for the strongest amorphous-CO2 spectral features were listed (spectra not shown) at 2342.0, 661.6, and 655.2
  which differ from those of both Falk (1987) and Escribano et al. (2013). Therefore, at present three sets of peak positions are in the literature for the same ice phase. This alone is a hindrance to applying such data to astronomical problems, but in addition none of these papers reported IR band intensities.
Adding to these uncertainties are questions surrounding the published CO2-ice optical constants and associated spectra. Figure 1 compares IR transmission spectra for the  and
and  fundamentals of a CO2 ice near 10 K as calculated for a thickness of 0.1 μm using the optical constants reported by four different research groups. Inspection of the traces in Figure 1 shows that there is both quantitative and qualitative disagreement in the results. Especially conspicuous is the splitting of the
  band (∼660
  , 15.2 μm), a CO2 vibration long and often used to study conditions and chemical evolution in cold interstellar regions (e.g., d'Hendecourt & Jourdain de Muizon 1989; Pontoppidan et al. 2008; Cook et al. 2011). Over 60 years ago, Osberg & Hornig (1952) showed that such a splitting near 660 cm
 is expected from a factor-group analysis based on the crystal structure of CO2. The implication is that each of the ices on which Figure 1 is based was partially or wholly crystalline, and so their associated optical constants provide no spectral-intensity information about amorphous CO2.
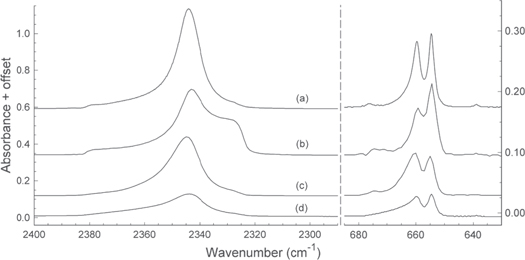
Figure 1. Infrared spectra of the  (left) and
  (right) bands of CO2 ices made near 10 K. The ice thickness was 0.10 μm in each case and the substrate chosen was KBr. Spectra were calculated (Swanepoel 1983) using the optical constants of (a) Ehrenfreund et al. (1997), (b) Hudgins et al. (1993), (c) Baratta & Palumbo (1998), and (d) Rocha & Pilling (2014). Spectra are offset for clarity.
Download figure:
Standard image High-resolution imageSimilar comments apply to IR spectra of CO2 ices presented elsewhere in the astrochemical literature (e.g., Sandford & Allamandola 1990), making it doubtful that amorphous-CO2 spectra were presented in them. In the recent papers of Rocha & Pilling (2014, 2015), CO2-ice spectra, although reported to be for a sample grown near 13 K, were said to agree with those of Hudgins et al. (1993) and Ehrenfreund et al. (1997), but those authors' ices were crystalline. In still other papers (e.g., Bennett et al. 2014), the IR reflection technique employed to acquire data, along with the small scale of the spectra presented, make an independent evaluation of phase and the extraction of band intensities for amorphous CO2 difficult.
Our conclusion is that despite the relatively high interstellar abundance of solid CO2, and an extensive associated literature, astrochemists still lack a mid-IR spectrum of amorphous CO2 accompanied by a set of band strengths. Without such information for amorphous CO2, applications to solid-state astrochemistry will be highly problematic. Therefore in this letter we describe our first results on amorphous CO2 and its IR spectrum, all based on new laboratory measurements. We present new spectra of CO2 ices whose phase can be unambiguously assigned, accompanied by newly determined band strengths. Finally, we consider some important CO2-ice publications in light of our new results and comment on how our results will be useful.
2. EXPERIMENTAL METHOD
The procedures and equipment used were similar to those of our recent CH4 investigation (Gerakines & Hudson 2015; Hudson et al. 2015). The main difference between the work reported here and that from earlier CO2 studies in other laboratories appears to be the slower rate at which our ices were grown by gas-phase condensation. The rates we used gave an increase in each sample's thickness of about 0.1 μm hr−1. Doubling this rate gave crystalline CO2 ices even at a deposition temperature of 10 K. Ice thicknesses were determined by laser interferometry using a reference index of refraction of n(670 nm) = 1.30. To calculate IR band strengths, denoted A', a density ρ = 1.28 g cm−3 was used, giving 1.751 × 10²² molecules  as the CO2 number density. Both n(670 nm) and ρ were measured three times with CO2 at 14 K in our laboratory with equipment and methods similar to those of Satorre et al. (2008), and with details to be supplied in a future paper. See also our similar measurements of n in Moore et al. (2010).
IR spectra were recorded as 100 scan accumulations with a resolution of 0.2  on a KBr substrate in a high-vacuum chamber (10−7–10−8 torr). A resolution of 1
  gave essentially the same band intensities for our amorphous samples, but with lower noise, and so sometimes was employed for quick checks on the quality of a sample. The CO2 used was obtained from Matheson Tri-Gas (Research Purity, 99.999%) Cambridge Isotope Laboratories (isotopic purity 99%). The chief contaminant seen was residual H2O from the CO2 reagents and possibly from our vacuum system. Trace amounts of H2O gave weak IR peaks (
 absorbance units in all cases) in the 3700–3500 and 1600 cm
 regions, far from the IR features of interest.
Uncertainties in our reported results are similar to those in our work on C2H2, C2H4, C2H6, and CH4 (Hudson et al. 2014a, 2014b; Gerakines & Hudson 2015; Hudson et al. 2015) and are given in the table presented later in this paper.
3. RESULTS
Experiments began with the condensation at 10 K of room-temperature CO2 gas to produce solid CO2. Spectrum (a) of Figure 2 shows expansions of such an ice's  (left) and
  (right) regions. Spectrum (b) was obtained by warming this same sample to 70 K and then recooling to 10 K. Close agreement was found between (b) and the spectra of crystalline CO2 reported by Yamada & Person (1964), and when we deposited CO2 at 60 K there was essentially perfect agreement for the band shapes and positions. Assigning spectrum (b) to crystalline CO2 suggests that its precursor, spectrum (a), is that of amorphous CO2. Supporting this assignment is the method used (slow condensation) to make the ice corresponding to (a), this spectrum's irreversible conversion to that of crystalline CO2 on warming, and spectrum (a)ʼs lack of sharp substructure for the
  and
and  features.
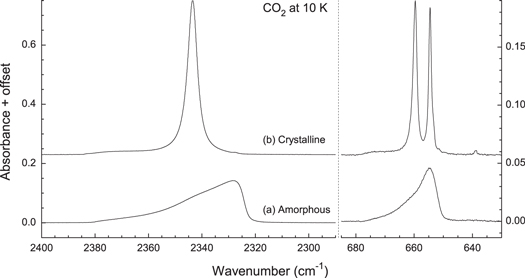
Figure 2. Infrared spectra of the  (left) and
  (right) bands of solid CO2. The CO2 ice sample was grown at 10 K to give (a) an amorphous solid that (b) crystallized on warming to 70 K and then was recooled to 10 K to give the spectrum shown. The thickness of the initial sample was about 0.03 μm. Spectra are offset for clarity.
Download figure:
Standard image High-resolution imageThe left-hand side of Figure 3 shows the result of separate, independent CO2 depositions at 10 K for four sample thicknesses. As expected, in each spectral region an increasingly intense IR band was seen for increasingly thicker ices. Expansions around 1384 and 1277  (not shown) revealed the weak
  and
and  Fermi resonance features. Since
  (symmetric stretching vibration) is IR-forbidden in the crystalline phase, its presence supports our assignment of these spectra to amorphous CO2. See Hudson et al. (2015) for the activation of forbidden transitions in other amorphous ices.

Figure 3. Left: infrared spectra of amorphous CO2 ices at 10 K at the thicknesses listed. Right: Beer's law plots of integrated optical depth as a function of ice thickness for the spectra shown at the left. Note that integrated optical depth equals 2.303 × integrated absorbance (i.e., band area) and that the slope of each graph is  for the corresponding IR band. The vertical axis of each of the two right plots has units of cm−1.
Download figure:
Standard image High-resolution imageA few measurements were carried out with  , and the results mirrored those of our
  experiments. The peak positions for the stronger fundamentals for amorphous
  at 10 K were 2263.4 and 636.3
  for
for  and
and  , respectively, giving 13C shifts of 66.4 and 18.4
  .
.
4. DISCUSSION
The CO2-ice IR spectra of Figures 2 and 3 possess many characteristics of interest, but in this paper we focus our attention on spectral profiles and intensities.
4.1. IR Spectra of Amorphous CO2
Figure 2 shows distinct differences in the band shapes, intensities, and positions for the amorphous and crystalline phases of solid CO2, and these results can be used to judge the presence or absence of crystalline material. One such difference is the splitting near 660  , which can be taken as a reliable indicator of crystallinity because no such splitting is present in purely amorphous CO2 samples. A second difference between the IR spectra of amorphous and crystalline CO2 ices is the asymmetry of the
  and
and  features. Similar band shapes have been reported in the IR spectra of other molecular solids by us and others (Ovchinnikov & Wight 1993; Hudson et al. 2014a).
Concerning the aforementioned disagreements in the amorphous-CO2 literature, our work best matches the results of Escribano et al. (2013), and it also extends them. Their amorphous CO2 ices were on the order of nanometers in thickness, whereas our results show that micrometer sizes can be reached with little degradation of the spectral band profiles. Our results disagree, however, with the band positions of both Sivaraman et al. (2013) and Falk (1987). For the former, we suspect that their ice actually was crystalline, or partly so, based on their 30 K deposition temperature and the fact that two peaks were listed near 660  , and not the single peak of our Figures 2 and 3. Since no deposition rate was stated and no spectra were shown for the crucial
  region, little more can be deduced. As already stated, the key laboratory parameter for making amorphous CO2 appears to be a slow rate of growth for the ice, a condition that is expected for many astronomical environments. Concerning the spectra of Falk (1987), the profiles of his CO2-ice features resemble ours, but his peak positions for the amorphous solid are off for both
  and
and  ices. Since his isotopic shifts and crystalline-CO2 peak positions are about the same as ours, we suspect either a calibration error or a mislabeling of his wavenumber scale for the amorphous-CO2 features.
Although this paper is focused on amorphous CO2, a few comments on the spectrum of crystalline CO2 in Figure 2 are appropriate, starting with the pronounced splitting near 660  for the crystalline ice. This sub-structure arises from the symmetry change on going from the
  point group of gas-phase CO2 molecules to the Pa3 space group of crystalline CO2, and with selection rules that are further altered in the amorphous phase. Explanations of the IR spectra observed in the crystalline case follow from a factor-group analysis and lead to an expectation of two separate features for the CO2 molecule's
  band, and Figure 2 shows that that prediction is confirmed. See Dahlke (1936) for early hints of such splitting, and full confirmation in Osberg & Hornig (1952) and many later papers. Isokoski et al. (2013) recently studied this same
  feature of crystalline CO2 and our results agree closely with theirs, even giving the same ratios that they graphed for the maximum and minimum near 660
  as a function of temperature.
4.2. IR Band Strengths of Amorphous CO2
The method of Hollenberg & Dows (1961) was used to derive IR band strengths. Rearranging their equation to give

shows that for the spectra on the left-hand side of Figure 3, a graph of 2.303 × (integrated absorbance) as a function of thickness ( will be a straight line with slope ρ
 , where ρN is the number density (molecules
  of CO2 molecules in the sample and A' is the apparent band strength. The right-hand side of the same figure shows the resulting plots for two amorphous-CO2 features. Slopes are given in Table 1 along with the resulting values of A'. Similar graphs of 2.303 × (peak height) as a function of thickness gave apparent absorption coefficients (α'), also listed in Table 1. See Hudson et al. (2014a, 2014b and references therein) for additional details, including the differences between apparent and absolute intensities.
Table 1. IR Features of Amorphous CO2 at 10 Ka
| Property |

|

|

|

|
|---|---|---|---|---|

|
3704 | 3597 | 2329 | 654.7 |
| λ/μm | 2.700 | 2.780 | 4.294 | 15.27 |
FWHM/
|
9.8 | 7.1 | 27.1 | 9.2 |
α'/
|
3890 ± 40 | 1557 ± 18 | 71,710 ± 3,016 | 30,380 ± 131 |
 / /
|
70,980 ± 1490 | 21,860 ± 372 | 2,058,000 ± 84,130 | 302,900 ± 9363 |
A'/cm 
|
4.05 ± 0.10 × 
|
1.25 ± 0.02 × 
|
1.18 ± 0.05 × 
|
1.73 ± 0.53 × 
|
Integration range/
|
3762–3645 | 3643–3577 | 2420–2290 | 680–630 |
Note.
aFWHM; α' and A' denote apparent absorption coefficient and apparent band strength taken directly from a set of IR spectra using Beer's law type plots; values of n(670 nm) = 1.30 and ρ = 1.28 g , or ρN = 1.751 × 10²² molecules
  , for CO2 were used throughout.
Download table as: ASCIITypeset image
Figure 3 also shows that the band positions and profiles of amorphous-CO2 IR spectra do not undergo significant shifts with ice thickness, unlike the case of, for example, crystalline C2H2 (Hudson et al. 2014a). This means that the band strengths (A') listed for each amorphous-CO2 IR band in Table 1 should be applicable without modification to a wide variety of interstellar and planetary-science situations.
For applications to interstellar chemistry, perhaps the most important A' in Table 1 is  = 1.18 ×
  cm
cm  . Most values now in the astrochemical literature are smaller and can be traced to older work on crystalline CO2 at higher temperatures. For example,
  values near 7.7 ×
  cm
cm  were used by Lv et al. (2012), who cited Jamieson et al. (2006) who cited Gerakines et al. (1995), who relied on the original measurement of this value by Yamada & Person (1964) for crystalline CO2 near 80 K. The
  value we are reporting for amorphous CO2 near 10 K is about 53% larger than that of Yamada & Person (1964) for crystalline CO2 near 80 K.
4.3. Astrochemical Applications and Implications
The immediate result of our work is that the mid-IR spectrum of amorphous CO2 is now available, accompanied by band strengths and a knowledge that the accompanying band profiles and positions do not change substantially over the nanometer-to-micrometer range. There are several areas where these results can be important. First, an A' value for crystalline CO2 ice has been used in many laboratory studies to calculate abundances of starting materials and of reaction products (e.g., Mennella et al. 2006; Peeters et al. 2010). Our new A' values (Table 1) will necessitate reevaluations of some of those earlier results, particularly those involving amorphous ices. Similarly, previous laboratory work in which abundance ratios, such as CO/CO2, were calculated may need reassessing (e.g., Pilling et al. 2011). Also, kinetic studies that rely on CO2 abundances, such as for a mass balance, almost certainly need revisiting (e.g., de Barros et al. 2014). Our IR spectra can be useful when comparisons might benefit from data on amorphous CO2, as opposed to crystalline CO2 (Iopollo et al. 2009, 2013; Lv et al. 2014). Edridge et al. (2013) allude to the unexpected observation of an IR feature near 2381  in work on amorphous CO2 by others, this particular band being more expected for a crystalline ice. However, Figure 7 of that earlier study (Baratta & Palumbo 1998) shows a double-peaked feature near 660
  , and so according to our Figure 2 the sample used was partially or wholly crystalline CO2, explaining the 2381
  feature (Parker & Eggers 1966).
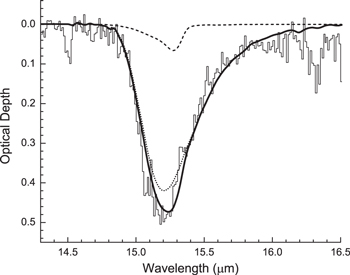
Beyond these laboratory applications, IR band profiles of solid CO2 have been used extensively in attempts to fit IR spectra of interstellar ices. Such fits, from which CO2-ice abundances are derived, may need reassessing in light of the significant differences we have found in the band profiles and intensities of amorphous and crystalline CO2 (Figure 2). As an example, Figure 4 contains a fit to the 15 μm Spitzer Space Telescope spectrum observed toward the background field star Q21-1, a line of sight that probes the dense ISM in the cold dark cloud IC 5146 (data from Whittet et al. 2009). Two laboratory components are included in roughly a 10:1 ratio, H2O + CO2 + CO = 100:20:3 at 20 K (Ehrenfreund et al. 1996) and amorphous CO2 at 10 K (this study), respectively. The resulting best-fitting combination shown in Figure 4 suggests that up to ∼9% of the solid CO2 in this line of sight may be amorphous. Previous studies using laboratory fits to interstellar quiescent-cloud CO2 spectra conclude that the non-polar component is either a CO- or CO2-dominated ice mixture.
Figure 4. The optical depth spectrum of a dark interstellar cloud toward the background field star Q21‐1. Thin solid histogram: Spitzer spectrum from Whittet et al. (2009); dotted line: laboratory spectrum of H2O + CO2 + CO (100:20:3) from Ehrenfreund et al. (1996); dashed line: laboratory spectrum of amorphous CO2 at 10 K (this work); thick solid line: sum of the laboratory spectra.
Download figure:
Standard image High-resolution image
Concerning IR band strengths, those now in widest use for amorphous CO2-containing mixtures near 10 K (Gerakines et al. 1995) derive from measurements on pure crystalline CO2 near 80 K (Yamada & Person 1964), scaled with ice composition. Our band strengths measured near 10 K for amorphous CO2 could be more appropriate to use in such cases.
5. CONCLUSION
An accurate, quantitative spectroscopic characterization of amorphous CO2 has been presented. Our new IR transmission spectra, such as in Figures 2 and 3, will help to distinguish amorphous and crystalline CO2 ice phases through band positions, widths, and shapes. However, just as important are the band intensities in our Table 1, which can be used to derive CO2 abundances in ices and, in turn, deduce evolutionary and environmental information, such as thermal histories. We also suggest that a primary reason for the confusion and disagreement among the spectra of Figure 1, and other such data (e.g., Poteet et al. 2013), is that the various ice samples used were not of a single CO2 phase, but for amorphous-crystalline mixtures. A fresh opportunity now presents itself to accurately reassess the role of frozen CO2 in planetary and interstellar ices and the information it can convey about its surroundings. Spectra are posted on our group's web site.1
NASA funding through the Astrophysics Research and Analysis, Cassini Data Analysis, and Outer Planets Research programs is acknowledged. Both authors received partial support from the NASA Astrobiology Institute through the Goddard Center for Astrobiology. Mark Loeffler is particularly acknowledged for constructing the ultra-high vacuum system with which he and Marla Moore measured n and ρ. Robert Ferrante and Tatiana Tway are thanked for assistance with IR measurements.