


ABSTRACT
We examine a sequence of two ejective eruptions from a single active region on 2012 January 23, using magnetograms and EUV images from the Solar Dynamics Observatory's (SDO) Helioseismic and Magnetic Imager (HMI) and Atmospheric and Imaging Assembly (AIA), and EUV images from STEREO/EUVI. This sequence produced two coronal mass ejections (CMEs) and a strong solar energetic particle event (SEP); here we focus on the magnetic onset of this important space weather episode. Cheng et al. showed that the first eruption's ("Eruption 1") flux rope was apparent only in "hotter" AIA channels, and that it removed overlying field that allowed the second eruption ("Eruption 2") to begin via ideal MHD instability; here we say that Eruption 2 began via a "lid removal" mechanism. We show that during Eruption 1's onset, its flux rope underwent a "tether weakening" (TW) reconnection with field that arched from the eruption-source active region to an adjacent active region. Standard flare loops from Eruption 1 developed over Eruption 2's flux rope and enclosed filament, but these overarching new loops were unable to confine that flux rope/filament. Eruption 1's flare loops, from both TW reconnection and standard-flare-model internal reconnection, were much cooler than Eruption 2's flare loops (GOES thermal temperatures of ∼7.5 MK and 9 MK, compared to ∼14 MK). The corresponding three sequential GOES flares were, respectively, due to TW reconnection plus earlier phase Eruption 1 tether-cutting reconnection, Eruption 1 later-phase tether-cutting reconnection, and Eruption 2 tether-cutting reconnection.
Export citation and abstract BibTeX RIS
1. INTRODUCTION
Various mechanisms have been examined for the onset of solar filament eruptions (e.g., Chen 2011). With the exception of breakout (Antiochos 1998), most mechanisms invoke ideal MHD instability or magnetic reconnection inside of the main bipolar field holding the filament. Recently, the importance to the eruption onset of the field outside the main bipole has been revived (e.g., Sterling et al. 2004, 2012; Liu et al. 2009; Schrijver & Title 2011; Schrijver et al. 2013; Török et al. 2011). In a specific example, Cheng et al. (2013) show that in the eruption of 2012 January 23 consisting of two sequential flux rope ejections (Li & Zhang 2013), the first removed field above the second, destabilizing the second flux rope to erupt via an ideal MHD instability. We call this initiation process a "lid removal" mechanism for the second eruption.
Each of the two flux-rope eruptions produced a coronal mass ejection (CME). The first eruption's ("Eruption 1") onset started on 2012 January 23 near 01:00 UT. The second eruption ("Eruption 2") was triggered by the first and included an erupting filament (i.e., the filament was entrained in Eruption 2's erupting field). In images from the Solar Dynamics Observatory's (SDO) Atmospheric and Imaging Assembly (AIA), which images the solar atmosphere at high (∼12 s) cadence over seven EUV wavelengths, Eruption 1's onset was only apparent in the AIA observations of the relatively hot corona, specifically in AIA 131 Å, 335 Å, and 94 Å images, which have peak log temperatures (K) of 7.0, 6.4, and 6.8, respectively (Lemen et al. 2012). (The 131 Å channel is also sensitive to cooler plasmas peaking at log Te ∼ 5.6 K.) Eruption 1's flux rope is not immediately obvious in on-disk images in the cooler channels of 304 Å, 171 Å, 193 Å, 211 Å, whose contribution functions reach peak temperatures (degrees K) of log Te ≈ 4.7, 5.8, 6.2, and 6.3, respectively. (Strong intensity "dimming" signatures of Eruption 1 do, however, occur in the cooler channels, especially in intensity difference images.)
Here we examine new aspects of this lid-removal eruption sequence. Although Eruption 1 originated in active region AR 11402, prior to its fast ejection, the flux rope underwent "tether weakening" (TW) magnetic reconnection (Moore & Roumeliotis 1992) with field linking to the neighboring AR 11401. We observe the Eruption 2 filament's motions both in cooler channel AIA images, and in supplemental EUV images from the EUVI instrument on the STEREO-A spacecraft (Howard et al. 2008), from which the eruption appeared as a limb event; it is the field carrying and enclosing this filament that erupts as Eruption 2 via the lid-removal mechanism. We address a conceivable negation of the lid removal in Eruption 2: As in the standard model for solar eruptions, Eruption 1 produced new closed flare loops over the filament via internal tether-cutting reconnection (e.g., Moore et al. 2001), which might have confined Eruption 2. We show, however, that the erupting filament-flux-rope field of Eruption 2 blew out these newly created Eruption 1 flare loops.
This event is extremely important from a space weather standpoint, as it produced an intense gradual solar energetic particle (SEP) episode (e.g., Reames 1995, 1999; Kahler & Reames 2003) that maintained a 10 MeV proton flux of >103 pfu for 43 hr as measured by the GOES spacecraft. This aspect of the eruption sequence, perhaps resulting from interaction of the two CMEs (cf. Kahler 2001; Gopalswamy et al. 2001, 2003, 2004; Li et al. 2012), was fully detailed in Joshi et al. (2013). Also, Liu et al. (2013) discuss other interplanetary aspects of this event. Here we focus on the changing magnetic field during the initiation and development of this SEP-producing eruption sequence; we show the expulsion of Eruption 1 flare loops by Eruption 2, and identify the reconnections that made each of the three GOES flares produced in the eruption sequence.
2. OBSERVATIONAL OVERVIEW
Figures 1(a)–(d) and accompanying videos show a summary of the eruption sequence from SDO/AIA. Figures in Cheng et al. (2013) and Joshi et al. (2013) show the eruption evolution in greater detail; we do not repeat that detail in Figure 1, but our animations show the full eruption sequence.
Download figure:
Video Standard image High-resolution imageDownload figure:
Video Standard image High-resolution imageDownload figure:
Video Standard image High-resolution imageDownload figure:
Video Standard image High-resolution imageDownload figure:
Video Standard image High-resolution imageFigure 1. SDO/AIA ((a)–(f)) and STEREO/EUVI ((g)–(i)) images of the erupting region at the wavelengths given in labels at tops of panels. Image in (a) is color reversed. The box in (d) shows the frame size of images in (e) and (f). Panel (a) includes an overlay of a 2013 January 23 01:00:26 UT HMI magnetogram, with red and green representing positive and negative fluxes, respectively, at contour levels of 100 and 750 G. Arrows show: (a) black: sunspots (green patches) of ARs 11402 (top) and 11401 (bottom), white: pre-TW-reconnection Eruption 1 flux rope; (b) black: "flare loops" from TW reconnection and Eruption 1 standard flare, white: post-TW-reconnection Eruption 1 flux rope; (c) black: Eruption 1 flare arcade, white: Eruption 2 flare arcade; (d) filament; (e) and (f) black: filament, white: newly formed Eruption 1 flare loops; (h) and (i) black: filament, white: expanding Eruption 1 loops. Straight lines in (b), (d), and (h) are fiducials for measuring feature locations plotted in Figure 5. North is upward and west is to the right.
(Animations (a, b, c, d, e and f) of this figure are available in the online journal.)
Download figure:
Video Standard image High-resolution imageFigure 1(a) shows an SDO Helioseismic and Magnetic Imager (HMI; Scherrer et al. 2012) magnetogram overplotted on the region. Black arrows show the locations of the sunspots of AR 11402 (north) and AR 11401 (south), as determined from AIA 1700 Å images; these spots were located, respectively, at approximately N29W21 and N17W30 at 22 UT on 2012 January 22. Both are negative polarity. Eruptions 1 and 2 both originate in AR 11402.
Figures 1(a)–(b) are 94 Å images, and show the expanding feature of Eruption 1; this feature, presumably a flux rope, is clearly apparent in all of the hotter AIA channels but not readily visible in the non-differenced cooler AIA channels. This flux rope originates from inside the closed field on the southeast side of AR 11402's sunspot (Figure 1(a), white arrows), and expands into the magnetic field linking to AR 11401 to the west. No loops of this linking field have brightened early in the flux rope's expansion (Figure 1(a)), but become illuminated (Figure 1(b), white arrows) over 01:06–01:15 UT as they are incorporated, via a version of TW reconnection, into the flux rope expanding from AR 11402. From the difference-image animation in Figure 1(a), these loops remain illuminated until ∼02:18 UT, suggesting TW-reconnection ends at that time or earlier.
Figure 1(c) is a 131 Å (also a hot channel) image showing Eruption 1 flare loops (black arrow), and also Eruption 2 flare loops (white arrows). Figure 1(d) is a 193 Å image showing the filament (arrows) that erupts as part of Eruption 2; Eruption 1 is not obvious in cooler channel images such as these (although some Eruption 1 flare loops are discernible; see the animations in the online journal). Eventually emission from the flare of Eruption 2 dominates that of Eruption 1 in all AIA channels.
Comparing with the two flux ropes identified in Cheng et al. (2013), their "FR1" is the same as our Eruption 1 flux rope. Their "FR2," which they identified in the hot AIA channels, is hot material in the filament-carrying flux rope of Eruption 2.
Since Eruption 1 features are best seen in hot AIA channels, and Eruption 2's filament is best seen in cool AIA channels, observing both concurrently is difficult. By blending 60% of a hot channel (131 Å) with 40% of a cool channel (193 Å), we are able to see the filament among the hot Eruption 1 flare loops. Figures 1(e) and (f) show such blended images, zoomed into the northern portion of the region, where the filament (black arrows) is located. These blended images and corresponding animations are useful for understanding the filament's interactions with overlying hotter flare loops (Figures 1(e) and (f) white arrows) of Eruption 1. (Animations accompanying Figures 1(c) and (d), respectively, show evolution in the unblended 131 Å and 193 Å channels.)
Figures 1(g)–(i) and the accompanying animations show STEREO-A images. Eruption 1 is obvious in the 195 Å images as an opening up of field lines viewed at the limb (white arrows in (h)), and shows a side view of the filament eruption of Eruption 2 (black arrows in (h) and (i)).
3. INTERPRETATION OF OBSERVATIONS
Figure 2(a) represents the three-dimensional field arrangement inferred from the magnetograms and coronal images at about 01:00 UT, early in the slow rise of Eruption 1. Magnetic tension and pressure from loops connecting the negative spot of AR 11401 and the positive flux of AR 11402, the "overarching" and "in-between" loops in the terminology of that panel, restrain the eruption of the filament field.
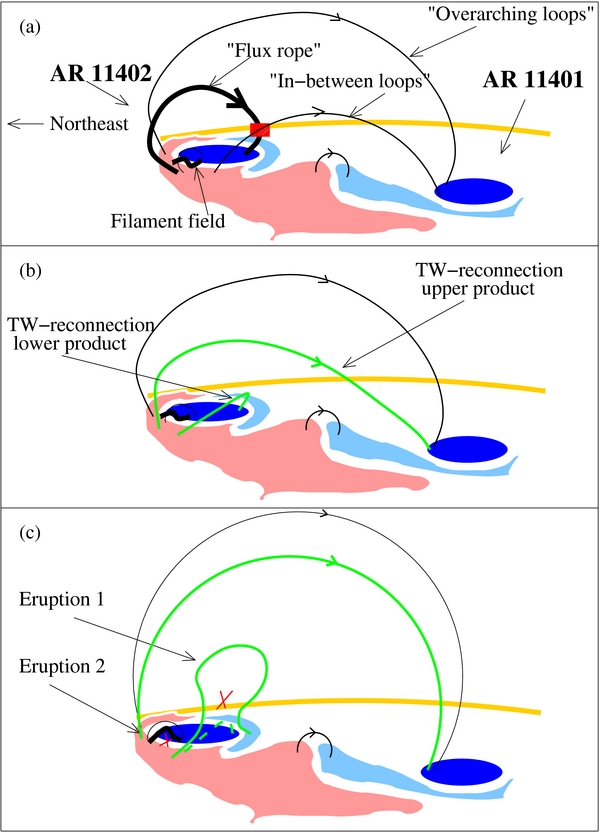
Figure 2. Schematic illustration showing interpretation of Figure 1 features. This is a sideways view, with northeast directed approximately toward the left, and the dark blue ovals representing sunspots of the regions indicated in Figure 1(a). Blue and pink shades indicate negative and positive magnetic flux, respectively. Magnetic reconnection is poised to occur at the location of a current sheet indicated in red in (a), resulting in the TW-reconnection products shown as green lines in (b). Reconnection is also occurring at the locations of the two red crosses in (c), resulting in production of the flare arcades of Eruptions 1 and 2. See the text for further details.
Download figure:
Standard image High-resolution imageIn Figure 3 we check our inferred Figure 2 schematic's magnetic topology with a potential field extrapolation of an HMI magnetogram, deduced with the Potential Field Source Surface (PFSS) model (Schrijver & DeRosa 2003) in the solarsoft software package (Freeland & Handy 1998). Potential field lines similar to those diagramed in Figure 2(a) are present, with the long-stemmed white and black arrows of Figure 3, respectively, pointing out field lines corresponding to the overarching and in-between loops of Figure 2(a).

Figure 3. PFSS model potential field extrapolation for the eruption region. The long white arrow and the black arrow, respectively, indicate field lines corresponding to the field lines labeled as "overarching" and "in-between" in the Figure 2(a) schematic. The upper and lower short-stem white arrows, respectively, point to the sunspots of AR 11402 and AR 11401 shown in Figures 1(a) and 2. North is upward and west is to the right.
Download figure:
Standard image High-resolution imageA flux rope (bold in Figure 2(a)) begins to erupt from the spot region of AR 11402 (see Section 5); the flux rope is indicated by white arrows in Figure 1(a). Eventually this expanding flux rope encounters and undergoes TW reconnection with the field connecting AR 11401 negative flux with AR 11402 positive flux ("in-between loops" in Figure 2(a)). These two loop systems are oriented favorably for this reconnection at the current sheet indicated in red in Figure 2(a). In Figure 2(b) these systems have undergone this reconnection, producing lower and upper reconnected loops/arcades as indicated by the respectively labeled green lines in Figure 2(b). In the observations, in Figure 1(b) the upper TW-reconnection product corresponds to the loop indicated by the two white arrows. The lower TW-reconnection product contributes to the bright arcade in Figure 1(b) (black arrow), but tether-cutting reconnection also contributes to this brightening, as we now discuss.
The legs of the arcade envelope of the outward-moving Eruption 1 flux rope undergo internal tether-cutting reconnection to form a flare arcade, as in the standard picture for solar eruptions (e.g., Hirayama 1974; Shibata et al. 1995; Moore et al. 2001; also see Hudson 2000); this is shown as the "Eruption 1" green loop in Figure 2(c). In the observations, this Eruption 1 internal-reconnection standard-flare arcade is difficult to differentiate from the TW-reconnection lower-product loops; the entire combined arcade is illuminated in Figure 1(b) (black arrow).
The TW-reconnection upper-product loop illustrated in Figure 2(b) and the overarching loops above it are blown out by the growing erupting flux rope of Figure 2(a) under them. At least initially (see Section 5), this "lid removal" reduces the restraining pressure and tension on the underlying filament-arcade field. That filament field then is able to start rising, then becomes unstable, and erupts, e.g., due to the torus instability, as suggested by Cheng et al. (2013).
One, however, might question (S. Antiochos 2013, private communication) whether the new closed field above the filament, i.e., the tether-cutting reconnection lower product of Eruption 1, might abort the filament's rise, so that Eruption 2 is only a confined eruption (Moore et al. 2001; Ji et al. 2003). Figures 1(e) and (f) and the accompanying animations, however, show that the filament (black arrows) distends and expels the newly formed Eruption 1 flare loops (white arrows) that are above it. Thus, the Eruption 2 flux rope ejectively erupts and opens the overlying Eruption 1 flare arcade. Figure 4 shows this process schematically.

Figure 4. Subfield of the Figure 2 schematic, showing the filament field pushing out and expelling the newly formed Eruption 1 standard-flare tether-cutting lower-product "flare loops."
Download figure:
Standard image High-resolution imageAs Eruption 2 progresses, the legs of the erupting filament-enveloping arcade collapse together, driving internal reconnection at the red X under the black erupting filament flux rope in Figures 2(c) and 4(c) to make Eruption 2 flare loops via the standard model for solar eruptions.
Figure 1(c) shows that the Eruption 2 flare loops (white arrows) add to the north end of the Eruption 1 flare loops (black arrow), forming one combined arcade visible in the hot AIA channels.
4. FILAMENT MOTIONS AND FLARE EMISSIONS
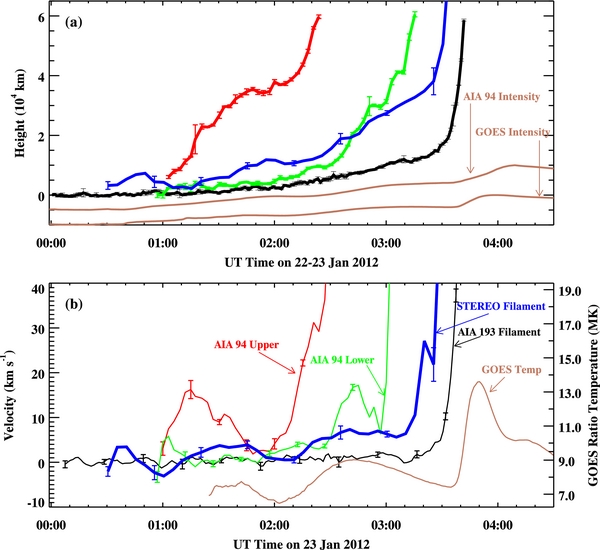
Figure 5 shows movements of the features in Figure 1 as functions of time, with trajectories in Figure 5(a) and corresponding velocities in Figure 5(b). Figure 5(a) gives the height of the filament with time from AIA (black trajectory), the rise of the Eruption 1 flux rope's outer edge (red trajectory) and the rise of the Eruption 1 flare loops expelled by Eruption 2 (green trajectory), and the filament's trajectory from STEREO-A (blue curve). The red curve shows a rise between 01:00 UT and ∼01:40 UT, a near-zero-velocity plateau at ∼02:00 UT, and then outward acceleration. The green curve mainly shows a rapid rise after ∼02:30 UT. The blue curve (and the black curve, in a more-muted fashion) shows progression similar to the red curve's, but delayed in time: rising over 01:00–02:00 UT; minimum velocity near 02:10 UT; followed by a slow rise, and then a fast rise (∼03:10 UT) after the green curve's fast rise (∼03:00 UT). Thus the filament's motion mimics that of the Eruption 1 flux rope, consistent with the filament's eruption (i.e., Eruption 2) resulting from the removal of the overlying field by Eruption 1.
Figure 5. In panel (a), the black and blue curves show the filament's trajectory as a function of time measured from AIA 193 Å images and STEREO-A 195 Å images, respectively. Red and green curves, respectively, show the top edge of Eruption 1's ejected flux rope (Eruption 1's upper reconnection product), and the location of the newly formed Eruption 1 flare loops (some of Eruption 1's internal-reconnection lower product) over the erupting filament that are being blown out by the underlying erupting filament field (Figure 4); these Eruption 1 features are measured as a function of time from AIA 94 Å images. All of these curves are measured in projection, and along the fiducial lines of Figures 1(d) (for 193 Å), 1(h) (195 Å), and 1(b) (94 Å). Error bars for the black curve are 1σ uncertainties from four independent manual measurements. (For the black curve in panel (a) the height values are a factor of two larger than measured, for plot clarity.) Error bars on the other curves are from three independent measurements, and only displayed at selected times. The two brown curves show the AIA 94 Å intensity (integrated over a region in Figure 1 images covering 290'' × 590'' in x, and 500 × 700'' in y) and the GOES 1–8 Å SXR flux as functions of time. In panel (b), the black, blue, red, and green curves show velocities (smoothed over four timesteps) obtained from the correspondingly colored curves in panel (a). The brown curve of panel (b) is temperature derived from the GOES flux-intensity ratios.
Download figure:
Standard image High-resolution image
In Figure 5(a) the AIA 94 Å and GOES 1–8 Å intensity curves show the time variations of relatively hot emissions. Figure 5(b) shows the temperature of the heated plasmas determined from the ratio of the GOES 1–8 Å and 0.5–4 Å SXR fluxes, using expressions from Thomas et al. (1985). The maximum GOES temperature of ∼14 MK occurs near 03:45 UT, when the flare emission of Eruption 2 is increasing following the filament's fast ejection. This maximum temperature in the GOES emission is similar to that measured in other M-class flares (Sterling et al. 1997; Tables 1 and 29). There are, however, two earlier peaks in temperature, one near 02:40 UT at ∼9 MK, which corresponds to the flaring of Eruption 1, and an earlier one near 01:40 UT of ∼7.5 MK, which roughly corresponds to the timing of the TW reconnections. These earlier temperature peaks correspond to the early "preflare brightenings" sometimes seen in flare events (e.g., Fárník & Savy 1998; Harra et al. 2001; Chifor et al. 2007; Wallace et al. 2010). Our present event shows a two-phase sequence of field reconnections for these two early brightenings, similar to other events (e.g., Fletcher et al. 2001; Kim et al. 2007; Kusano et al. 2012; Sterling et al. 2012; Bamba et al. 2013; Yan et al. 2013).
5. SUMMARY AND DISCUSSION
In GOES soft X-rays, the eruption sequence produced three flares, of size class C2.5, M1.1, and M8.7, respectively peaking at about 01:44 UT, 03:13 UT, and 03:59 UT (cf. Figure 1 of Joshi et al. 2013); these GOES classes and times respectively correspond to the temperature peaks just described. We can now clarify the source of each of these flares. The first corresponds to the timing of the Eruption 1 TW-reconnection, and to the time of that eruption's slow-rise onset tether-cutting reconnection (both contributing to brightening indicated by the black arrow in Figure 1(b)); the second corresponds to the extensive Eruption 1 explosive-phase standard-flare tether-cutting flare arcade; and the third corresponds to Eruption 2's standard-flare tether-cutting flare arcade (Figure 1(c), white arrows). (Joshi et al. (2013) and Cheng et al. (2013) also discuss processes occurring with the M1.1 and M8.7 flares.) We have also found that Eruption 2 occurred despite flare loops from Eruption 1 having formed above the filament field that became Eruption 2. Eruption 2's ejection was exceptionally fast (∼2000 km s−1; Joshi et al. 2013), which was likely key to SEP production. Perhaps the lid removal and/or the involvement of the Eruption 1 flare loops made the Eruption 2 CME be extra fast.
Even though Eruption 1 appears to be a preflare (or "pre-heating") event in the non-imaging GOES SXR flux data, it is nonetheless a strong-CME-producing eruption. Precursor eruptions such as Eruption 1 may be common, but rarely detected in on-disk observations prior to SDO. Indeed, such lid-removal precursor eruptions may have been missed in some previous eruption studies. Eruption 1 was much more obvious in the STEREO 195 Å images (Figure 1), where it appeared beyond the limb as an apparent opening of large-scale field, than in the cooler-filter on-disk images of AIA.
All proposed mechanisms for triggering solar eruptions necessarily require breaking down the tension-pressure balance that maintains the steady state of the pre-eruption field. The initiation mechanism for Eruption 2, i.e., that described by Cheng et al. (2013) (also see, e.g., Schrijver & Title 2011; Schrijver et al. 2013; Sterling et al. 2012) that we here call lid removal, is fundamentally different from proposed initiation mechanisms most widely discussed in recent years, in that the overlying field's downward pressure and tension restraining the filament flux rope are reduced by removal of some of the overlying field (the envelope field blown out by Eruption 1 in this case), rather than by a mechanism local to the erupting field as in, e.g.: tether cutting (reconnection internal to the erupting field), breakout (which is driven by the erupting field), or flux cancelation between adjacent or emerging fields and the erupting field (e.g., van Ballegooijen & Martens 1989; Chen & Shibata 2000).
Eruption 1 triggered Eruption 2, but what triggered Eruption 1? Eruption 1 originates from a more southern portion of the neutral line along which Eruption 2's filament erupts. At the location of Eruption 1's source along the east side of the spot of AR 11402, there were negative-polarity moving magnetic features (MMFs) flowing from the spot to the neighboring positive field, and undergoing cancelation in that neutral-line channel. These cancelations continuously occurred from the earliest time we checked, 2013 January 22 15:15 UT, and continued through the time of the eruption. Such cancelation by MMFs can trigger flares (e.g., Zhang & Wang 2002; Sterling et al. 2010), and so is a candidate for having triggered Eruption 1. Or, such cancellation could have caused the Eruption-1 flux rope to rise until it became unstable to the MHD torus instability, as suggested by Cheng et al. (2013).
We thank the referee for improving the presentation, and for an insightful suggestion regarding the speed of the second eruption. A.C.S. and R.L.M. were supported by funding from the Heliophysics Division of NASA's Science Mission Directorate through the Living With a Star Targeted Research and Technology Program, and the Hinode Project. J.M.K. was supported by NSF's Research Experience for Undergraduates Program.