


 t, B-4000 Liège, Belgium
ABSTRACT
Determination of the nitrogen isotopic ratios in different bodies of the solar system provides important information regarding the solar system's origin. We unambiguously identified emission lines in comets due to the 15NH2 radical produced by the photodissociation of 15NH3. Analysis of our data has permitted us to measure the 14N/15N isotopic ratio in comets for a molecule carrying the amine (–NH) functional group. This ratio, within the error, appears similar to that measured in comets in the HCN molecule and the CN radical, and lower than the protosolar value, suggesting that N2 and NH3 result from the separation of nitrogen into two distinct reservoirs in the solar nebula. This ratio also appears similar to that measured in Titan's atmospheric N2, supporting the hypothesis that, if the latter is representative of its primordial value in NH3, these bodies were assembled from building blocks sharing a common formation location.
Export citation and abstract BibTeX RIS
1. INTRODUCTION
The determination of nitrogen isotopic ratios in solar system objects is of primary importance to achieve a better understanding of the origins of these objects. Measurements of the 14N/15N isotopic ratio in different solar system objects and molecules have revealed great diversity. This ratio ranges from 441 ± 5 for the present-day Sun (Marty et al. 2011), considered to be representative of the protosolar nebula, to 50 in some organic materials of chondrite and interplanetary dust particles (Messenger 2000; Bonal et al. 2010). Any object of the solar system (except Jupiter) is actually enriched in 15N compared to the protosolar nebula.
Different hypotheses have been proposed to explain this enrichment. Chemical models (Rodgers & Charnley 2008) have shown that interstellar chemistry can produce 15N enrichment for both molecules carrying the nitrile (–CN) functional group and those carrying the amine (–NH) functional group. A recent work suggests that these differences would simply reflect the different interstellar N reservoirs from which N-bearing molecules originate (Hily-Blant et al. 2013). Based on observations of H13CN and HC15N in two prestellar cores, the authors suggested that the molecules carrying the nitrile functional group would be more enriched in 15N than the molecules carrying the amine functional group. Nevertheless, such a theory still requires further observations and modeling before it can be confirmed.
Comets are interesting targets with which to test this theory because they contain both HCN and NH3 molecules (leading to CN and NH2 radicals after photodissociation by solar radiation). So far, the 14N/15N ratio has only been measured in comets from HCN and CN (Jehin et al. 2009). It has been measured in about 20 bright comets through optical observations of the CN radical (Arpigny et al. 2003; Manfroid et al. 2009) and for a few comets from millimeter observations of HCN (Bockelée-Morvan et al. 2005, 2008). For both species, the measurements give the same non-terrestrial isotopic composition (14N/15N ≃ 150 in comets versus 272 in Earth's atmosphere) and do not depend on the origin of the comets (Jehin et al. 2009).
In this work our objective is to measure the 14N/15N isotopic ratio in comets for a radical bearing the amine functional group, NH2. This radical is assumed to be produced by photodissociation of the NH3 molecule since: (1) 95% of photodissociated NH3 molecules in comets produce NH2 radicals, (2) NH3 is, by far, the most abundant molecule observed in comets able to produce NH2, and (3) simultaneous measurements of NH3 and NH2 abundances in comets have provided similar values (Kawakita & Mumma 2011). We first conducted laboratory experiments to measure the wavelengths of the most intense 15NH2 lines, which were poorly known, with sufficient accuracy. In addition, we processed a large sample of high-resolution cometary spectra obtained during the last decade and coadded them in the corresponding wavelength range. We then obtained an average spectrum with a very high signal-to-noise ratio to search for the faint 15NH2 emission lines. We succeeded in detecting seven of them. From this positive detection of 15NH2 emission lines, for the first time, it was possible to derive an estimate of the 14N/15N isotopic ratio in comets for a species bearing the amine functional group.
2. DETERMINATION OF 15NH2 LINE WAVELENGTHS
Cometary spectra show emission of 14NH2 bands around 5700 Å and 6000 Å ((0, 10, 0)–(0, 0, 0) and (0, 9, 0)–(0, 0, 0) bands in linear notation, respectively). Due to the lack of precise line lists with which to identify the cometary 15NH2 lines, in the laboratory, we investigated the emission spectrum of 15NH2 in the 5550–6250 Å (16,000–18,000 cm−1) spectral range where the most intense lines are expected.
The emission spectrum has been recorded using the Fourier transform (FT) interferometer of the AILES beamline of the synchrotron SOLEIL equipped with a quartz-visible beamsplitter and an avalanche photodiode detector. The experiment was implanted on the AILES beamline as described in Yu et al. (2010) except that in the present case one plane mirror and a single 30 cm focal length lense collected the plasma emission and focused it on the entrance aperture of the FT interferometer. The 15NH2 radical was produced in a 13.5 MHz radiofrequency (RF) discharge of about 1 mbar of pure 15NH3 continuously flowing through a 100 cm length and 2 cm diameter pyrex cell placed collinear to the RF coil axis. The spectral resolution was set to 0.05 cm−1 (0.017 Å) and the final spectrum is a coaddition of 288 interferograms corresponding to a total of about 2 hr of acquisition time. Together with the weak emission lines of 15NH2, we detected numerous intense transitions of 15N2 and H2 in the spectrum. The presence of these spurious lines complicated the spectroscopic analysis of the 15NH2 optical transitions but allowed accurate calibration of their frequencies (Bailly & Vervloet 2007; Salumbides et al. 2008; Bailly et al. 2010).
The emission lines measured in this work (both from laboratory and observational spectra) correspond to rovibronic transitions between the two Renner–Teller components of NH2 which correlate to the 2Πu electronic ground state in the linear configuration. As for 14NH2, the  electronic ground state of 15NH2 is bent, whereas the
  excited state is quasilinear (Herzberg 1966). Numerous studies have been devoted to experimental and theoretical understanding of the complex Renner–Teller effect for 14NH2, and we refer to Dressler & Ramsay (1959) for the detailed description of the spectroscopic notations. In the following, we adopt the usual description of rotational quantum numbers
  for asymmetric top molecules. Due to its unpaired electron each
  level is split in two sublevels through spin-rotation interaction identified as F1 (N = J − 1/2) and F2 (N = J + 1/2). The vibrational quantum numbers are described as: (ν1, ν2, ν3).
3. OBSERVATIONAL DATA
The cometary data are high-resolution spectra obtained at the European Southern Observatory (ESO) using the 8.2 m Kueyen telescope (UT2) of the Very Large Telescope with the Ultraviolet and Visual Echelle Spectrograph (UVES) instrument (Dekker et al. 2000). This instrument is a cross-dispersed echelle spectrograph designed to operate with high efficiency from the atmospheric cut-off at 300 nm to the long-wavelength limit of the CCD detectors (about 1100 nm).
We searched for the 15NH2 emission lines in a series of high-resolution spectra collected with UVES on 12 different comets between 2002 and 2011 (resolving power λ/Δλ ≃ 80,000). The reduction procedure is detailed in Manfroid et al. (2009) and Decock et al. (2013). The UVES arc lamp wavelength calibration was corrected using the [O i] night sky emission lines. The BASS2000 solar spectrum was used to remove the absorption features of the cometary dust scattered light. Table 1 presents the detail of the 39 spectra used for our study. Because of the expected faintness of 15NH2 emission lines we combined the normalized spectra using weights proportional to the square of the signal-to-noise ratio (column "Ratio" in Table 1). We obtained a single combined spectrum with the best signal-to-noise ratio that could be obtained from all our observational data.
Table 1. Spectra of Comets Used for This Study
| Comet | UT Date | MJD | Exp. Time | r |  |
Δ |  |
Ratio |
|---|---|---|---|---|---|---|---|---|
| (s) | (au) | (km s−1) | (au) | (km s−1) | ||||
| C/2000 WM1 (LINEAR) | 2002 Mar 7 | 52340.3623 | 1550 | 1.084 | 28.258 | 1.237 | 0.258 | 359 |
| C/2000 WM1 (LINEAR) | 2002 Mar 7 | 52340.3808 | 1550 | 1.084 | 28.258 | 1.237 | 0.278 | 386 |
| C/2000 WM1 (LINEAR) | 2002 Mar 8 | 52341.3682 | 1550 | 1.100 | 28.266 | 1.237 | 0.132 | 493 |
| C/2000 WM1 (LINEAR) | 2002 Mar 8 | 52341.3867 | 1550 | 1.100 | 28.266 | 1.237 | 0.155 | 301 |
| C/2002 V1 (NEAT) | 2003 Jan 8 | 52647.0373 | 2100 | 1.222 | −36.514 | 0.833 | 7.871 | 700 |
| C/2002 V1 (NEAT) | 2003 Jan 8 | 52647.0622 | 2100 | 1.221 | −36.521 | 0.833 | 7.916 | 723 |
| C/2002 V1 (NEAT) | 2003 Jan 10 | 52649.0312 | 2100 | 1.180 | −37.105 | 0.842 | 8.272 | 741 |
| C/2002 V1 (NEAT) | 2003 Jan 10 | 52649.0562 | 1987 | 1.179 | −37.113 | 0.842 | 8.313 | 555 |
| C/2002 X5 (Kudo-Fujikawa) | 2003 Feb 19 | 52689.0132 | 2000 | 0.697 | 43.032 | 0.865 | −5.052 | 885 |
| C/2002 V1 (NEAT) | 2003 Mar 21 | 52719.9854 | 600 | 1.012 | 39.761 | 1.626 | 42.003 | 467 |
| C/2002 Y1 (Juels-Holvorcem) | 2003 May 29 | 52788.3943 | 1800 | 1.142 | 24.091 | 1.556 | −7.220 | 682 |
| C/2002 Y1 (Juels-Holvorcem) | 2003 May 29 | 52788.4157 | 1800 | 1.142 | 24.093 | 1.556 | −7.195 | 600 |
| C/2002 Y1 (Juels-Holvorcem) | 2003 May 30 | 52789.3935 | 1800 | 1.156 | 24.184 | 1.552 | −7.198 | 508 |
| C/2002 Y1 (Juels-Holvorcem) | 2003 May 30 | 52789.4149 | 1800 | 1.156 | 24.186 | 1.552 | −7.172 | 517 |
| C/2001 Q4 (NEAT) | 2003 Sep 1 | 52883.2929 | 4500 | 3.730 | −18.803 | 3.448 | −25.411 | 724 |
| 88P/Howell | 2004 May 2 | 53127.3723 | 3600 | 1.385 | 2.988 | 1.648 | −3.250 | 382 |
| 88P/Howell | 2004 May 3 | 53128.3630 | 3600 | 1.387 | 3.131 | 1.646 | −3.198 | 350 |
| 88P/Howell | 2004 May 4 | 53129.3715 | 3600 | 1.388 | 3.276 | 1.644 | −3.126 | 163 |
| C/2001 Q4 (NEAT) | 2004 May 5 | 53130.9577 | 119 | 0.978 | −5.426 | 0.322 | −4.120 | 269 |
| C/2001 Q4 (NEAT) | 2004 May 6 | 53131.0658 | 2189 | 0.977 | −5.363 | 0.322 | −3.287 | 928 |
| C/2002 T7 (LINEAR) | 2004 May 6 | 53131.4214 | 1080 | 0.680 | 15.835 | 0.607 | −65.603 | 1115 |
| C/2001 Q4 (NEAT) | 2004 May 7 | 53132.0650 | 2148 | 0.974 | −4.841 | 0.321 | 2.228 | 863 |
| C/2002 T7 (LINEAR) | 2004 May 26 | 53151.9760 | 2678 | 0.940 | 25.576 | 0.414 | 54.973 | 1922 |
| C/2002 T7 (LINEAR) | 2004 May 27 | 53152.0357 | 1800 | 0.941 | 25.585 | 0.416 | 55.188 | 1467 |
| C/2003 K4 (LINEAR) | 2004 Nov 20 | 53329.3438 | 1499 | 1.202 | 14.810 | 1.510 | −28.215 | 632 |
| 73P-C/SW 3 | 2006 May 27 | 53882.3666 | 4799 | 0.952 | −4.168 | 0.151 | 12.320 | 128 |
| 8P/Tuttle | 2008 Jan 16 | 54481.0208 | 3599 | 1.041 | −4.292 | 0.358 | 21.631 | 185 |
| 8P/Tuttle | 2008 Jan 28 | 54493.0178 | 3899 | 1.027 | 0.404 | 0.522 | 24.711 | 959 |
| 8P/Tuttle | 2008 Feb 4 | 54500.0169 | 3899 | 1.034 | 3.159 | 0.621 | 24.155 | 1033 |
| 103P/Hartley 2 | 2010 Nov 5 | 55505.3044 | 2899 | 1.065 | 2.533 | 0.159 | 7.081 | 701 |
| 103P/Hartley 2 | 2010 Nov 5 | 55505.3470 | 3199 | 1.065 | 2.546 | 0.159 | 7.194 | 500 |
| 103P/Hartley 2 | 2010 Nov 10 | 55510.3036 | 2899 | 1.074 | 4.054 | 0.181 | 7.961 | 716 |
| 103P/Hartley 2 | 2010 Nov 10 | 55510.3466 | 3199 | 1.074 | 4.067 | 0.182 | 8.072 | 807 |
| 103P/Hartley 2 | 2010 Nov 11 | 55511.2453 | 4499 | 1.076 | 4.333 | 0.186 | 7.954 | 522 |
| 103P/Hartley 2 | 2010 Nov 11 | 55511.3048 | 3599 | 1.077 | 4.351 | 0.186 | 8.088 | 506 |
| 103P/Hartley 2 | 2010 Nov 11 | 55511.3447 | 2399 | 1.077 | 4.363 | 0.186 | 8.191 | 579 |
| C/2009 P1 (Garradd) | 2011 Sep 10 | 55814.0190 | 4799 | 2.092 | −14.825 | 1.474 | 14.622 | 272 |
| C/2009 P1 (Garradd) | 2011 Sep 11 | 55815.0020 | 4799 | 2.084 | −14.769 | 1.482 | 15.126 | 330 |
| C/2009 P1 (Garradd) | 2011 Sep 12 | 55816.0102 | 4799 | 2.075 | −14.710 | 1.491 | 15.675 | 430 |
Notes. UT Date is for mid-exposure, r is the heliocentric distance,  the heliocentric velocity, Δ the geocentric distance,
  the geocentric velocity, and the ratio is the ratio between the brightest emission line in the range 3899–5695 Å range and the noise.
Download table as: ASCIITypeset image
4. SEARCH FOR 15NH2 EMISSION LINES
We used the combined spectrum to search for 15NH2 emission lines. To perform this search we established a list of all the 14NH2 emission lines having a significant intensity and searched for their equivalent 15NH2 lines for both the (0, 10, 0)–(0, 0, 0) and (0, 9, 0)–(0, 0, 0) bands. Unfortunately the spectral region corresponding to the (0, 9, 0)–(0, 0, 0) band contains numerous bright 14NH2 and C2 emission lines, preventing the detection of faint 15NH2 emission lines. In the spectral region corresponding to the (0, 10, 0)–(0, 0, 0) band it was possible to detect seven different faint emission lines corresponding exactly to the 15NH2 wavelengths resulting from the rotational analysis of the laboratory spectrum.
Table 2 presents the assignments and the wavelengths of the identified 15NH2 lines with their 14NH2 counterparts. Figure 1 shows the details of each emission line attributed to 15NH2 (two of them, at 5762.995 and 5763.076 Å being unresolved). To identify the lines due to other species we used the cometary line atlas based on spectra obtained on comet 122P/de Vico (Cochran & Cochran 2002).
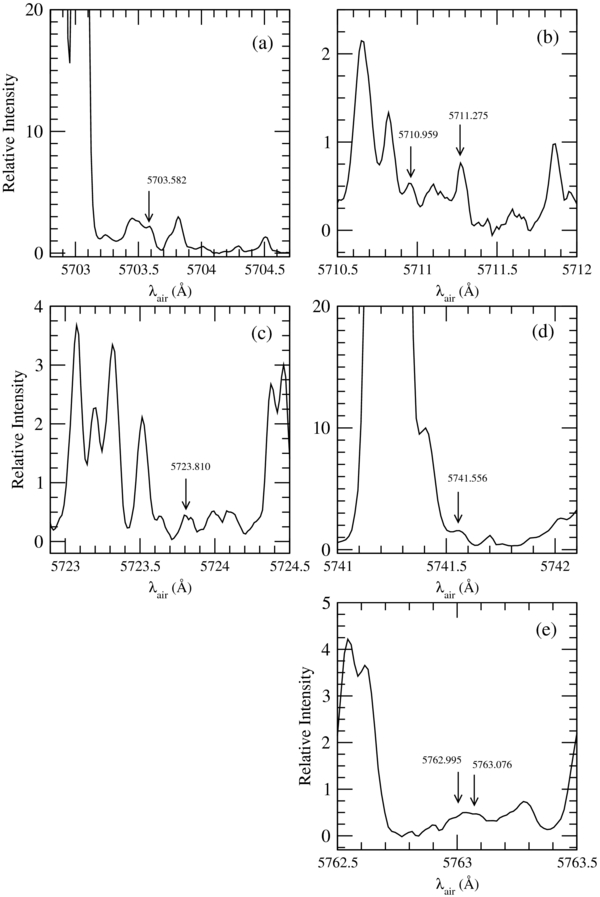
Figure 1. Emission lines of the average cometary spectrum attributed to 15NH2 in the (0, 10, 0)–(0, 0, 0) band.
Download figure:
Standard image High-resolution imageTable 2. 15NH2 Emission Lines Identified in the Average Cometary Spectrum
| Line Identification | Air Wavelength | 14NH2 Counterpart | Ratio |
|---|---|---|---|
| (Å) | Air Wavelength | ||
| (Å) | |||
| 110 − 000 (F1 − F1) | 5703.582 | 5693.594 | 91 |
| 111 − 101 (F2 − F2) | 5710.959 | 5700.747 | 101 |
| 111 − 101 (F1 − F1) | 5711.275 | 5700.996 | 137 |
| 110 − 202 (F1 − F1) | 5723.810 | 5713.790 | 118 |
| 110 − 220 (F1 − F1) | 5741.556 | 5731.683 | 180 ± 80 |
| 312 − 422 (F1 − F1) | 5762.995 | 5752.752 | 135 |
| 312 − 422 (F2 − F2) | 5763.076 | 5752.800 | 135 |
Notes. The 14NH2 wavelengths are computed from the wavenumbers given in Ross et al. (1988). The ratio is the intensity ratio of 14NH2 emission lines with the associated 15NH2 lines (note identical ratios for the last two lines which appear blended).
Download table as: ASCIITypeset image
5. DISCUSSION
From the detected 15NH2 emission lines it is possible to derive a 14N/15N ratio for NH3, the parent molecule of NH2. In fact, a rigorous calculation of this ratio requires an important work of calculations and significant complementary laboratory experiments. Nevertheless it is possible to get a good estimate of the 14N/15N ratio in NH3 by adopting reasonable assumptions. These assumptions, discussed below, are: (1) a similar photodissociation efficiency for 14NH3 and 15NH3 to produce, respectively, 14NH2 and 15NH2 radicals and (2) similar transition probabilities for both 14NH2 and 15NH2.
For the photodissociation efficiency with respect to the solar radiation it would be necessary to conduct complementary laboratory experiments for measuring the absorption cross section for both 14NH3 and 15NH3. Some results of laboratory experiments relative to this problem have, nevertheless, already been published (Suto & Lee 1983; Liang et al. 2007). These papers show that the oscillator strength f, defined by 1.13 × 10⁻⁶∫σdν (where σ is the absorption cross section in megabarns (=10−18 cm2) and ν the wavenumber (cm−1)) is only 7.3% greater for 15NH3 compared to 14NH3 (Liang et al. 2007) in the 165–220 nm range (corresponding to the main region of photodissociation for these molecules). For shorter wavelengths, especially the Lyα region, only 14NH3 absorption cross sections are available (Suto & Lee 1983). At the Lyα wavelength the 14NH3 cross section is smaller than in the 165–220 nm range (about 10 × 10−18 cm2 versus about 20 × 10−18 cm2). Even if the Lyα emission line would correspond to very different absorption cross sections for 15NH3 and 14NH3 it could not lead to a large overall difference in the photodissociation rate for these two molecules because the solar Lyα flux represents only a few percent of the total solar flux in the 165–220 nm range.4 Complementary laboratory data would be welcome to evaluate accurately the difference of photodissociation efficiency for 14NH3 and 15NH3. It is nevertheless highly probable that no significant difference exists.
Equal transition probabilities are generally adopted for the two isotopic species when measuring isotopic ratios from line intensity ratios. In the case of the 14NH2 and 15NH2 radicals, this assumption could be invalidated by the Renner–Teller effect. This effect concerns the low-lying rovibronic levels (with Ka ≠ 0) of the electronic excited state with higher rovibronic levels of the electronic ground state. In point of fact, the almost constant isotopic shift between the wavelengths of the selected transitions of Table 2 indicates that no severe perturbations resulting from a strong resonance between two interacting levels occur for the excited rovibronic levels of the subband Ka = 1 (0, 10, 0)–(0, 0, 0) of Table 2.
The intensity ratio between 14NH2 and 15NH2 emission lines was measured for each detected 15NH2 line using the 14NH2 corresponding line. In some cases, because of a blend of the 15NH2 line with another emission line (due to either 14NH2 or C2) we used an ad hoc fitting of these perturbing lines before measuring the 15NH2 line intensity by fitting it with a synthetic line convolved with the instrument response function.
Adopting a Gaussian analytical expression for the line profiles, we have simultaneously adjusted the intensities of the N lines considered in a wavelength range bracketing the line(s) of interest (i.e., for 14NH2 or 15NH2). This task was performed thanks to a classical Levenberg–Marquardt algorithm (Press et al. 1992). The FWHM, thought to be uniform, has been determined previously in applying the same technique.
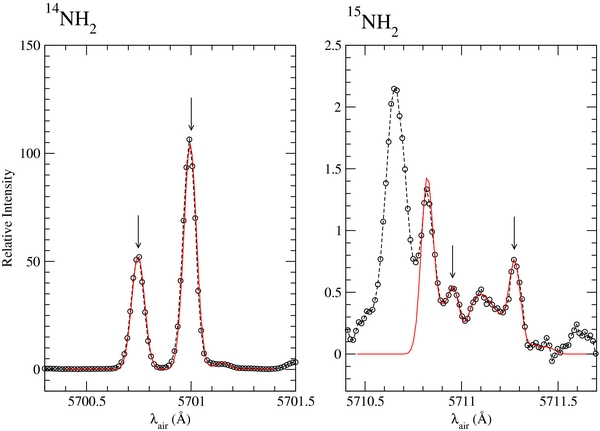
In order to maximize the signal-to-noise ratio this analysis has been applied to the combined cometary spectrum. Table 2 presents the ratios measured for each couple of 14NH2 and associated 15NH2 lines. The uncertainties cited give the deviations of the values for which acceptable fits are obtained using various procedures. From this table it can be seen that, within the error, all the intensity ratios are compatible with each other. In some cases a blend with other very weak and unidentified emission lines cannot be excluded. Such a blend could lead to an underestimation of the 14N/15N ratio in one or two lines. From Table 2 we can compute an average 14NH2/15NH2 ratio of 127. A simple computation of the standard deviation gives σ = 32 but the average of the uncertainties provides a range of values from ∼80 to ∼190. The latter range of values is probably more appropriate because of the difficulty in accurately subtracting the solar continuum for each region of interest. Figure 2 presents the modeling done for the 15NH2 lines located at 5710.959 and 5711.275 Å and their 14NH2 counterparts.
Figure 2. Modeling used to derive the 14NH2/15NH2 emission line ratio on the average cometary spectrum for the 15NH2 lines located at 5710.959 and 5711.275 Å.
Download figure:
Standard image High-resolution image
This ratio of 127 obtained with the average spectrum is probably very close to the 14N/15N ratio in the NH3 molecules, with the two reasonable assumptions mentioned above. It is close to the 14N/15N ratio measured both in HCN and in CN.
So far, the 14N/15N ratio measured in solar system objects presents variations that remain difficult to interpret. The analysis of Genesis solar wind samples (Marty et al. 2011) suggests a 14N/15N ratio of 441 ± 5, in agreement with the in situ measurements made in the ammonia of Jupiter's atmosphere (Fouchet et al. 2004) which probably comes from primordial N2 (Owen et al. 2001). In contrast, with a value of 272 in the atmospheric N2, Earth's ratio is enriched in 15N compared to Jupiter and is similar to the bulk of ratios derived from the analysis of comet 81P/wild 2 grains (Mckeegan et al. 2006). Nitrogen isotopic ratios have also been measured in Titan's atmosphere, which is dominated by N2 molecules. The two existing measurements, found to be 167.7 ± 0.6 and 143 from the Cassini GCMS and INMS data (Niemann et al. 2010; Mandt et al. 2009), respectively, are found to be lower than the Earth's value. Because of the low abundance of primordial Ar observed by Cassini-Huygens, it is generally assumed that N2 is of secondary origin in this atmosphere and was delivered in a less volatile form, probably NH3. Different mechanisms have been proposed for the conversion of NH3 to N2: photolysis (Atreya et al. 1978), atmospheric shock heating (McKay et al. 1988), endogenic production (Glein et al. 2009), and impacts during the late heavy bombardment (Sekine et al. 2011). Isotopic fractionation may have occurred for nitrogen in Titan's atmosphere, nevertheless the atmospheric model published by Mandt et al. (2009) suggests that the current 14N/15N ratio observed in N2 is close to the value acquired by the primordial ammonia of Titan. Sekine et al. (2011) also predict that 14N/15N values in NH3 in comets and Enceladus' plume would be as high as that of Titan's N2. A 14N/15N ratio in the ammonia of comets significantly lower than the "primordial" solar wind/Jupiter value, and similar to the one measured on Titan, assumed to be representative of its primordial value, favors the hypothesis that comets and Titan were assembled from building blocks sharing a common formation location in the nebula. This idea is supported by the measurement of the D/H ratio in the plumes emitted from Saturn's other moon, Enceladus, by the INMS instrument aboard the Cassini spacecraft, which is found to be similar to the values derived from Oort Cloud comets (Waite et al. 2009; Kavelaars et al. 2011).
The aforementioned measurements suggest that N2 and NH3 result from the separation of nitrogen into at least two distinct reservoirs, with distinct 15N enrichment, which never equilibrated. Ion–molecule chemistry in dense interstellar and/or protostellar material could create 15N enrichment in the ammonia ice that is produced in these environments (Charnley & Rodgers 2002). Alternatively, the 15N enrichment observed in cometary ices could result from isotopic fractionation processes that occurred in the late protosolar nebula (Aléon 2010). More observational constraints are needed to test these scenarios such as more accurate and independent measurements of the nitrogen ratio in NH2 for comets of different origins. Our work demonstrates that such measurements are now possible in the near future.
Footnotes
- 4
See data from the LASP Interactive Solar Irradiance Data Center available at http://lasp.colorado.edu/lisird/whi_ref_spectra/.