


ABSTRACT
Previous observations of Saturn's infrared aurorae have shown that a mid-latitude aurora exists significantly equatorward of the main auroral oval. Here, we present new results using data from four separate observing runs in 1998, 2003, 2008, and 2010. When combined, these provide a view of the mid-latitude aurora under a considerable range of viewing conditions, allowing the first calculation of the latitudinal position of this aurora to be made. This has shown that the mid-latitude aurora is located at the magnetic footprint of the region within the magnetosphere where the initial breakdown in corotation occurs, between 3 RS and the orbit of Enceladus (∼3.95 RS). We also confirm that this aurora is a continuous stable feature over a period of more than a decade and that an oval morphology is likely. When combined, these results indicate that the mid-latitude auroral oval is formed by currents driven by the breakdown process within the magnetosphere, in turn caused by mass loading from the torus of Enceladus, analogous with the volcanic moon Io's dominant role in the formation of Jupiter's main auroral oval.
Export citation and abstract BibTeX RIS
1. INTRODUCTION
Until recently, our understanding of Saturn's aurorae has been limited, defined largely in terms of the morphology of the main auroral oval (Grodent et al. 2005; Stallard et al. 2007). However, recent observations—both by the Cassini spacecraft and from Earth—have shown the aurorae to be highly complex, spanning the entire polar region of the planet. The main oval is strongly influenced by the solar wind (Prangé et al. 2004; Clarke et al. 2005, 2009; Crary et al. 2005; Bunce et al. 2006). During periods of relative quiescence in the solar wind, the southern oval is located at ∼75°S5 (Badman et al. 2006). However, under compression in the solar wind, the main oval contracts poleward and brightens, particularly on the dawn side (Clarke et al. 2005; Bunce et al. 2006). Further modeling has shown that the main oval is produced as a result of, at least in part, solar wind interaction with Saturn's magnetosphere (Cowley et al. 2004; Sittler et al. 2006) and measurements of the magnetic field lines that connect with the main oval strongly indicate that this aurora is strongly correlated with the open/closed field line boundary (Bunce et al. 2008).
Our understanding of the auroral emission both poleward and equatorward of the main oval is much more limited. Poleward of the main auroral oval, auroral emission strengths are highly variable, with aurora detected in both infrared (IR; Stallard et al. 2004, 2008c) and ultraviolet (UV; Pryor et al. 2009). For the majority of the time this polar aurora has relatively weak, spatially variable emission, but this is interspersed with bright polar auroral events that cover a large region across the pole with IR emission that is, at times, brighter than the main auroral oval. These are not, however, associated with compressions within the solar wind (Stallard et al. 2008c).
There is also significant IR emission seen equatorward of the main oval. A "doubling" or "splitting" of the main oval is seen predominately on the night side, resulting in secondary or multiple arcs of emission, each separated by 1°–2°, equatorward of the main oval (Stallard et al. 2008c; Pryor et al. 2009). UV emission from these auroral arcs have been seen to extend to latitudes as low as 70° (Grodent et al. 2010). In addition to this splitting of the main oval, a second distinct oval has also been detected in the infrared (Stallard et al. 2008b). This second mid-latitude auroral oval coincides with the region of breakdown in corotation in the ionosphere, determined using IR measurements of the ionospheric velocities, suggesting that it is a Saturnian equivalent of the main auroral oval at Jupiter (Hill 2001; Cowley & Bunce 2001; Stallard et al. 2001).
If the mid-latitude auroral oval is associated with the breakdown in corotation, we can relate the observed ionospheric velocities to ion velocities measured in the magnetosphere. Recent observations of particles within the equatorial magnetosphere have shown that the initial breakdown in corotation occurs at ∼3 RS (Saturn radii; 1 RS = 60,268 km), with the lag to corotation reaching a maximum at 3.95 RS, the orbital distance of Enceladus (Wilson et al. 2008). This suggests the mid-latitude aurora results from currents formed through the mass loading of the magnetosphere by Enceladus.
Measurements of the location of the secondary aurora can help to confirm this proposed mechanism, particularly if they can be mapped reliably onto the equatorial magnetosphere. A zero-order approximation to Saturn's magnetic field is a dipole with its axis co-located with the planet's rotational axis. However, there is also a centered, axial-quadrupole component that changes the relative magnetic field strength in the north and south polar regions. This can be modeled by shifting the internal dipole northward of the equator by ∼0.037 RS. Because of the change in relative field strength, the same radial distance in the magnetosphere maps to a different latitudinal location in each hemisphere.
It is thus necessary to map magnetic field lines from an equatorial location in the magnetosphere down into the planetary ionosphere. The magnetic field model employed for this purpose consists of two components: the "Cassini SOI" internal field model of Dougherty et al. (2005) and a field that results from the magnetospheric ring current appropriate to a typical magnetopause distance of 22 RS (Bunce et al. 2008). The ionosphere is taken to lie at 1100 km above the 1 bar reference spheroid of Saturn, the UV peak emission altitude (Gérard et al. 2009). This results in 3 RS in the magnetosphere mapping to 60 0N and 566S, and 3.95 RS to 643N and 615S. If the mid-latitude aurora is related to the breakdown in corotation in the magnetosphere, this is the region where the associated aurora should occur.
2. DATA ANALYSIS
All the data discussed in this Letter were taken using the long-slit spectrometer CSHELL on the NASA Infrared Telescope Facility (Greene et al. 1993), centering the wavelength measured on emission from the H+3 ν2 Q(1,0−) line at 3.953 μm. This produces a spectral image of the type shown in Figure 1. In the spectral window covered by CSHELL at this wavelength setting, Saturn's continuum emission consists of partially reflected solar infrared radiation and thermal IR from the planet's troposphere that are partially absorbed by methane in the stratosphere. The 3.953 μm line falls at a wavelength at which nearly all of this continuum is absorbed by stratospheric methane.
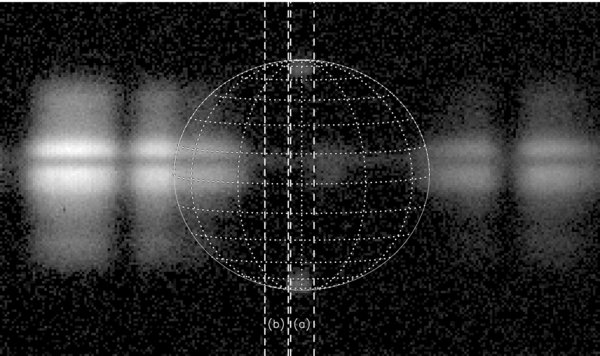
Figure 1. Combined spectral images of Saturn from 2010, with wavelength varying on the horizontal scale and spatial position along the prime meridian on the vertical scale. The H+3 aurora from the Q(1,0−) line at 3.953 μm can be seen in the center of the array (a) within the 2'' slit (dashed lines), with the background (b) used to subtract reflected sunlight from the atmosphere and rings adjacent (dot-dashed lines). Overlain is a latitude–longitude grid of the planet for scale (with latitude shown in 15° steps and longitude in 30° steps). Away from the H+3 line, on the left side of the spectra, a region of relatively low methane absorption results in bright reflected sunlight from the rings and atmosphere of Saturn; these are used to locate the planet and calculate the seeing within each individual spectra.
Download figure:
Standard image High-resolution imageIn Figure 1, bright auroral H+3 emission at the central wavelength of the spectral image is seen at the poles. At wavelengths both shortward and longward of the 3.953 μm line, the spectrum is dominated by planetary emission and reflection. At the time that this spectral image was taken (2010 February), Saturn's rings were more or less edge on as viewed from Earth, and their effect is seen as a relatively weak reflection across the entire wavelength range, most noticeable as a darker "stripe" in the planet's bright continuum. At other viewing angles, however, such as those that occurred for other data sets analyzed in this Letter, the rings, too, reflect solar IR brightly.
The original detection of the mid-latitude auroral oval, detailed in Stallard et al. (2008b), was taken on 2003 February 6, with the slit aligned perpendicular to the rotational axis, east–west on the planet, with the field of view of the slit crossing the southern auroral region. Calculating the location of this auroral oval was difficult, however, as it was not possible to determine the projection of the slit on the planet accurately. In the original Letter, the main oval was modeled using an axisymmetric model that approximated the observed, time-averaged, UV auroral oval as ∼1° wide and located at a latitude of 75°S (Badman et al. 2006). This was then convolved with an effective seeing of 1 8. As shown in Figure 2, this model oval was then subtracted from the observed intensity profile. This process resulted in three secondary auroral peaks in emission: a central peak, poleward of the main oval, that may be well associated with the "bright polar aurora" seen in some infrared Cassini-VIMS images (Stallard et al. 2008c); and two equatorward intensity peaks that constitute evidence for a "Jovian-like" auroral oval, mapping to regions of corotation breakdown in the equatorial magnetosphere.
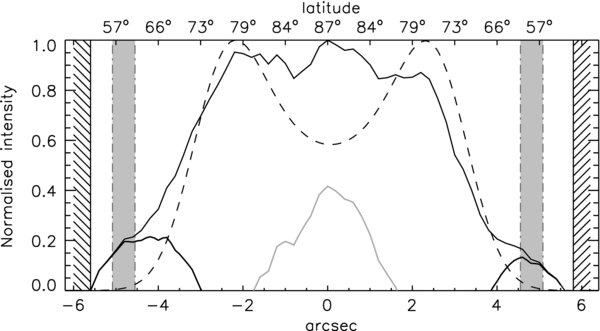
Figure 2. H+3 intensity profile, cutting across the polar region east–west on the planet, plotted against calculated latitude. The emission profile observed (solid line) is compared with a model of the main auroral oval at 75° latitude (dashed line). Latitudes are calculated based on this assumption. The residue when this model is removed from the intensity profile (bold line) consists of three peaks: a central peak that may be associated with the "bright polar aurora" seen in recent Cassini-VIMS images (Stallard et al. 2008c; gray line) and two equatorward peaks from the mid-latitude auroral oval. These lie within the projected location of breakdown in corotation within the magnetosphere, between 3 and 3.95 RS (two dot-dashed gray lines, with gray infill).
Download figure:
Standard image High-resolution imageThe latitude of the main oval varies considerably, with a standard deviation of up to 5° under rarefied solar wind conditions (Badman et al. 2006). If we assume it is located at 75° latitude, we can use this fixed position to calculate latitudes across the entire profile. This places the peak emission from the secondary oval at ∼60°S–65°S, well separated from the main auroral oval and mapping to magnetic field lines that cross the equatorial plane at the orbit of Enceladus. In order to calculate the location of this mid-latitude aurora accurately, the projection of the spectrometer slit on the planet needs to be more accurately measured. Aligning the slit north–south along the rotational axis of Saturn, as was done for the detection of Saturn's IR main oval (Stallard et al. 1999), allows reflected sunlight from the lower atmosphere and rings to be detected across the planetary disk at the same time as the auroral emission is measured, as shown in Figure 1. Using this, it is possible to properly locate the slit on the planet, and so produce an accurate measurement of the location of all the auroral emission.
Here, we collate data from three separate observing runs taken between 1998 and 2010 under a considerable range of viewing conditions as detailed in Table 1. Data were obtained over several nights within each of these data sets, during which time the instrumental settings, seeing, and guiding accuracy varied. Detailed experimentation has shown that a 4'' slit setting, used to produce emission-line images of the aurora (Stallard et al. 2008a), resulted in a spectral resolution too low to allow us to discriminate between continuum and auroral signals. Because of this, only data with a slit width of 2'' or less were included.
Table 1. The Sequence of Observations made between 1998 and 2010 with the Slit Aligned North–South along the Rotational Axis of Saturn
| Observing Run | No. of Spectra | Slit Width | Total Integration Time (minutes) | Equatorial sub-Earth Latitude | Planetary Polar Diameter |
|---|---|---|---|---|---|
| 1998 Oct | 16th: 19, 19th: 6, 23rd: 3 | 1'' | 56 | −15.3 | 2002 |
| 2008 Feb | 19th: 31 | 05 |
62 | −8.2 | 2002 |
| 2010 Feb | 9th: 1, 10th: 9 | 2'' | 20 | +4.5 | 1898 |
Download table as: ASCIITypeset image
Difficulties in guiding on Saturn also caused the planet to "drift" across the slit. This had two effects: first, in combination with the effect of seeing, this resulted in "smearing" of the resultant spectral image and second, the position of the auroral region within the slit varied from spectrum to spectrum. To compensate for these two effects, the bright equatorial continuum emission at shorter wavelengths was used to calibrate the extent of "smearing" and the variation of the slit projection on the planet. This continuum was fitted with a Gaussian for which both the peak position and half-width could be determined on a spectrum-by-spectrum basis. Spectra with a smearing >05 were rejected; those that were retained were shifted to align the continuum peak intensity and then co-added. This process resulted in the sets of spectra, detailed in Table 1.
For each spectral set, emission from the H+3 line was integrated across the width of the slit, to produce a north–south H+3 profile across the planet. The observed continuum is relatively low at 3.953 μm due to absorption by methane in the lower atmosphere. But this absorption is less efficient at lower (sub-Earth) latitudes because the column density of methane in the line of sight of an Earth-based observer is less. Moreover, at higher viewing angles, low-intensity solar IR reflected from the rings is also present. To allow for this residual continuum, we took a spectral profile just shortward of 3.953 μm. This background profile was then subtracted from the emission profile, to produce the intensity profiles shown in Figure 3. The rings obscure the planet at certain latitudes, making some regions of the profiles unreliable, and these have been marked accordingly.
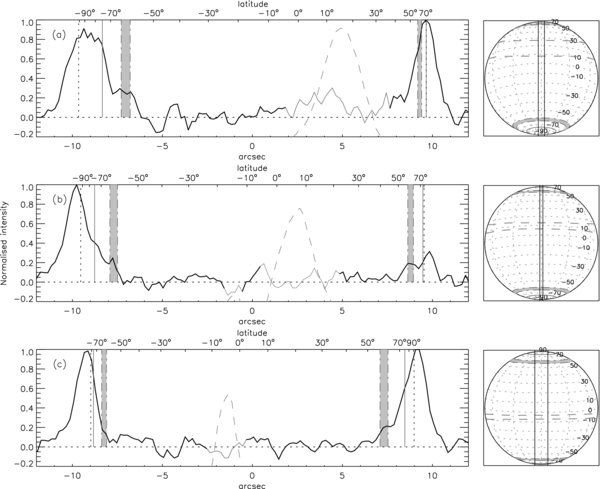
Figure 3. North–south profiles of the H+3 emission intensity for three separate sets of data from 1998 (a), 2008 (b), and 2010 (c), alongside a planetary grid showing how the planet was viewed at the time of observation, to the right. The predicted locations of auroral features are shown; the main auroral oval is defined by the statistical location in the UV (solid vertical line) and the estimated latitudes of secondary oval emission at latitudes mapping to 3 RS and Enceladus (two dot-dashed vertical lines, with gray infill). The profiles match well with these predicted positions. The limb of the planet (dotted vertical line) ∼1100 km above the 1 bar limb is aligned with the peak of the H+3 emission. Also shown is the smoothed profile of reflected sunlight, dominated by Saturn's rings (dashed line), with the region of the profile that is rendered unreliable because of light from the rings (shown in gray). The planetary grids also have latitude and longitude shown (dotted line), in steps of 10° and 30°, respectively.
Download figure:
Standard image High-resolution image
To determine the location of the various auroral emissions in our data sets, we require a reference oblate spheroid onto which our H+3 emissions may be projected. According to Gérard et al. (2009), the UV aurora are located 1100 km above the 1 bar level. Spectral analysis of the UV aurora suggests only weak methane absorption, suggesting that the majority of precipitation occurs above the homopause (Gérard et al. 2006). This means that the formation of H+3 is likely to be closely correlated with the UV aurora, and so we have assumed that the H+3 emission peak also occurs at 1100 km above the 1 bar reference oblate spheroid. This can then be used to determine the projection of Saturn's central meridian on the slit, taking into account the prevailing sub-Earth latitude, as shown in the insets in Figure 3. In the corresponding profiles, we have marked the location of the limb of the planet, as defined by our reference spheroid, by a dotted vertical line.
We have marked the projection of the Badman et al. (2006) reference UV auroral oval in Figure 3 with a solid vertical line. We have also indicated the region of the profiles that maps magnetically to the region between 3 and 3.95 RS. In 1998 and 2008, the prevailing sub-Earth latitude meant that this region can be easily distinguished from the main auroral oval in the southern hemisphere in our profiles. In 2008 and 2010, this can be done for the northern hemisphere. Where we can distinguish clearly between the location of the UV reference oval and the 3 to 3.95 RS region in our profiles, we note that there is a clear peak in the H+3 intensity in this region.
3. DISCUSSION
These observations provide us with considerable new information about a region of Saturn's ionosphere that remains poorly understood. We have shown for the first time that the mid-latitude aurora previously identified in infrared spectra is a continuous feature that appears to be stable over a period of more than a decade and confirms that an oval morphology is likely, with emission now detected at dawn, noon, and dusk. We show that this oval is located at the magnetic footprint of the region within the magnetosphere where the initial breakdown in corotation occurs, between 3 RS and the orbit of Enceladus (∼3.95 RS), a relatively broad region of emission with the peak emission at ∼62°N and ∼58°S. This, therefore, confirms that the aurora originates in the region of breakdown in corotation in the ionosphere and indicates that the oval is formed by currents that are driven by this breakdown process within the magnetosphere, caused by momentum loading within the torus formed by Enceladus, analogous with Jupiter's main auroral oval.
This shows that Enceladus is associated with two separate, potentially colocated, auroral features. An Enceladus "spot" has been identified by the Cassini spacecraft, both in UVIS images (Pryor et al. 2009) and as a high-energy field-aligned ion beam by the Cassini plasma instruments (Rymer et al. 2009) and is thought to be analogous to the Io spot at Jupiter, mapping along magnetic field lines directly to the location of the moon itself. This auroral spot has not yet been identified in infrared observations, though the spot only occurs in ∼2% of UV images that cover the correct region of the planet; with relatively few IR images having a long integration time across this region, the lack of detection is to be expected. The mid-latitude auroral oval described in this Letter is driven by the currents associated with the azimuthal non-localized breakdown in corotation within the magnetosphere of Saturn, caused by the removal of momentum from the Enceladus-related gas torus, as charge exchange allows fast neutrals to escape the torus. Thus, this aurora is analogous with the main auroral oval of Jupiter.
The reason that these two aurorae are collocated at Saturn, but found at different latitudes on Jupiter, is due to the relative strength of each planet's magnetic field. At Jupiter, ions formed at Io (5.9 RJ) are forced into corotation with the magnetosphere, with the breakdown in corotation only occurring when the weakening of the magnetic field with distance can no longer provide the torque required to maintain the rotation near the angular velocity of the planet, at around ∼20 RJ. On Saturn the magnetic field is not strong enough to enforce corotation near Enceladus, and so currents are set up in the region where this initial breakdown occurs. This initial breakdown appears to be inside of Enceladus' orbit and possibly as far planetward as 3 RS.
This mid-latitude oval is clearly distinct from even the most equatorward UV auroral oval at ∼70°S (Grodent et al. 2010) and, beyond the Enceladus spot, no Lyman-α emission has been identified in UV observations of this region of Saturn. Recent observations by the Cassini-UVIS instrument have shown H2 band emission across the body of Saturn, with an emission peak at ∼60° (Lui et al. 2010), but overall the UV auroral signature appears to be weaker in this region. The location of this mid-latitude aurora is also suggested by electron densities in Saturn's upper atmosphere, made by Cassini's Radio Science Subsystem (RSS). These have shown that the electron densities are increase from equatorial levels at latitudes ∼60°, significantly below the equatorward limit of the main auroral oval (Kliore et al. 2009).
This relative brightness in our observations may be due to the breadth of the oval, at up to 5° in width, so that the peak brightness of the oval is significantly weaker when compared with a main auroral oval unaffected by atmospheric seeing. However, infrared aurorae are also strongly affected by the temperature of the surrounding neutral atmosphere, so emission may be significantly enhanced by higher temperatures within this region. This rise in temperature could be caused either by the large Joule heating associated with the breakdown in corotation, as seen at Jupiter (Melin et al. 2006), or because the oval is formed by low-energy particles precipitating relatively high in the atmosphere, thus sampling a higher neutral atmospheric temperature.
This work was supported at Leicester by STFC grants ST/H002480/1 for S.W.H.C. and T.S., ST/G0022223/1 for T.S. and H.M., and by a RCUK Fellowship for T.S. We also thank the ISSI International Team on Saturn Aeronomy #166 for useful input.
Facilities: IRTF (CSHELL) - Infrared Telescope Facility
Footnotes
- 5
All latitudes within this Letter are given in planetographic coordinates, assuming a planetary flattening of 0.09796.