


ABSTRACT
Spectra of Triton between 1.8 and 5.5 μm, obtained in 2007 May and 2009 November, have been analyzed to determine the global surface composition. The spectra were acquired with the grism and the prism of the Infrared Camera on board AKARI with spectral resolutions of 135 and 22, respectively. The data from 4 to 5 μm are shown in this Letter and compared to the spectra of N2, CO, and CO2, i.e., all the known ices on this moon that have distinct bands in this previously unexplored wavelength range. We report the detection of a 4σ absorption band at 4.76 μm (2101 cm−1), which we attribute tentatively to the presence of solid HCN. This is the sixth ice to be identified on Triton and an expected component of its surface because it is a precipitating photochemical product of Triton's thin N2 and CH4 atmosphere. It is also formed directly by irradiation of mixtures of N2 and CH4 ices. Here we consider only pure HCN, although it might be dissolved in N2 on the surface of Triton because of the evaporation and recondensation of N2 over its seasonal cycle. The AKARI spectrum of Triton also covers the wavelengths of the fundamental (1–0) band of β-phase N2 ice (4.296 μm, 2328 cm−1), which has never been detected in an astronomical body before, and whose presence is consistent with the overtone (2–0) band previously reported. Fundamental bands of CO and CO2 ices are also present.
Export citation and abstract BibTeX RIS
1. INTRODUCTION
Triton has been studied spectroscopically in the visible and near-infrared regions to a maximum wavelength of ≈4 μm (Quirico et al. 1999; Grundy et al. 2002; Cruikshank 2005), and a fraction of its surface has been imaged in considerable detail by the Voyager 2 spacecraft during the flyby of the Neptune system in 1989 (Lunine 1990). The spectroscopic studies have revealed five different molecular ices: N2, CH4, CO, CO2 (Cruikshank & Apt 1984; Cruikshank et al. 1984; Quirico et al. 1999), and H2O (Cruikshank et al. 2000). The absorption bands of CH4 are all shifted to wavelengths shorter than the laboratory values, indicating that the methane is dissolved in the nitrogen ice (Cruikshank et al. 1993). This matrix effect results from the proximity of CH4 molecules to N2 molecules rather than other methane, thus affecting the band energy (Quirico & Schmitt 1997a). The (2–0) N2 band seen on Triton at 2.17 μm is relatively broad and represents the hexagonal crystalline β-phase, which is stable at temperatures above the α–β transition at 35.6 K (Grundy et al. 1993). The α-phase has a cubic structure.
Triton has a tenuous atmosphere, probably arising from the vapor pressure of the most volatile ices at the prevailing temperature of about 38 K, making it the coldest known object orbiting a planet. Particulate material is injected into the atmosphere by plumes originating in the subsurface and rising vertically to about 8 km altitude, where they are blown laterally by sublimation-driven winds. A number of surface streaks of relatively low-albedo material result from the fallout from plumes that were inactive at the time of the Voyager 2 flyby.
Photochemical models of Triton's atmosphere and surface ices predict the formation and deposition of several hydrocarbons in addition to CH4, as well as nitriles and other molecules (Krasnopolsky & Cruikshank 1995). With the possible exception of C2H6 (Quirico et al. 1999), whose abundance, however, amounts at most to a few percent (DeMeo et al. 2009), none of these have been reported thus far. Most of the overtone and combination bands of the other alkanes are coincident with those of CH4 in the best-studied region 1.0–2.5 μm, thus masking their possible presence. Nitriles should be most easily detected in the region around 4.8 μm where the fundamental C≡N stretch occurs. Our observations with AKARI were carried out in the hope to find HCN (hydrogen cyanide or formonitrile) or other nitriles that should be produced either in the atmosphere or in the surface itself.
2. OBSERVATIONS AND DATA REDUCTION
Disk-integrated spectra of Triton between 1.8 and 5.5 μm were recorded on 2007 May 13 (UT), using both the prism and grism modes of the Infrared Camera (IRC; Onaka et al. 2007) on board ISAS/JAXA's AKARI infrared astronomy satellite (Murakami et al. 2007), which was launched on 2006 February 21 (UT). We also acquired data at mid-infrared wavelengths, but the presence of Neptune made it impossible to detect the mid-infrared thermal emission of its largest moon. The spectra of the reflected sunlight alone, however, already allow a search for new species on Triton's surface, because ground-based spectra are adversely affected by the absorption by water vapor and carbon dioxide in Earth's atmosphere. In order to confirm our first findings, we repeated the measurements in NIR-grism mode during the warm phase of the mission on 2009 November 15 and 16 (UT). Figure 1 shows the best AKARI spectra of Triton in the region 4.0–5.0 μm.
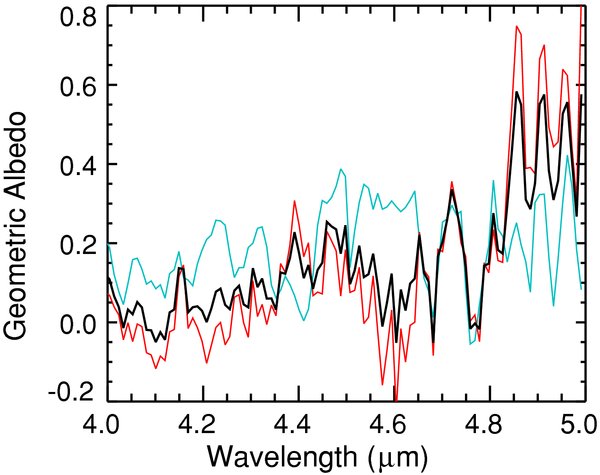
Figure 1. Grism spectra of Triton are shown in the limited region 4.0–5.0 μm. The data from 2007 May 13 are shown in red and those from 2009 November 16 in blue, and in black the average values with the data from the warm phase of the AKARI satellite given half the weight. Triton was very close to Neptune in the cross-dispersion direction during the measurement on 2009 November 15, therefore this spectrum is not shown. The negative values are probably caused by an incorrect subtraction of the dark current or stray light from Neptune.
Download figure:
Standard image High-resolution imageThe region 4.0–4.35 μm in Triton's spectrum is strongly absorbed. It contains the overlapping fundamental bands of β-N2 and CO2, and has not been previously observed. An evaluation of the relative contributions of these (and possibly other) molecules to the absorption spectrum of Triton will be undertaken in subsequent studies; in the present work we focus on the contribution of HCN to Triton's spectrum. The presence of this molecule is demonstrated by the coincidence of the ν1 stretching mode fundamental band at 4.76 μm in the spectra from both 2007 May 13 and 2009 November 16 (UT). The depth of this band on Triton is significantly greater than the random noise level in the data (±0.05 in geometric albedo). As the two spectra were obtained at different temperatures of the detectors and with different positions of the target on the detector array—the first observation was aimed at Neptune—spurious features are easily recognizable. The fact that the narrow band at 4.76 μm is observed in both sets of data suggests it is real.
A disk-averaged spectrum was also obtained in another module: the prism (NP; Table 1). NP and NG (grism) cannot observe simultaneously, therefore the two spectra were taken 15 hr apart from each other on 2007 May 13 (UT). The lower resolution near-infrared prism spectrum was found to be consistent with the grism observations (see Figure 2) if one takes the very different spectral resolving power into account. The minor differences may simply be due to an error in the flux calibration of the slitless spectrum or hint at spatial variations of Triton's surface (the apparent planetographic longitude of this moon varied by up to 71° between the observations). The sensitivity of the InSb detectors strongly decreases at wavelengths ⩾4.5 μm, i.e., a region where in addition to this the sunlight is quite weak. Hence, any error in the dark current subtraction has a bigger effect on this part of the spectrum and might have caused the slightly larger discrepancies among the different observations.
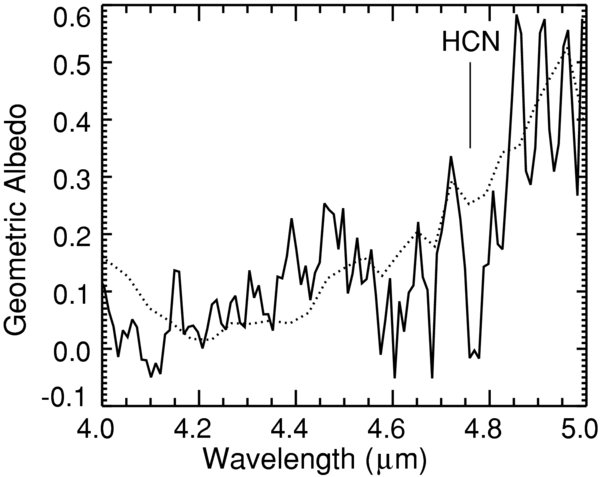
Figure 2. Average grism (solid line) and the prism (dotted line) spectrum of Triton.
Download figure:
Standard image High-resolution imageTable 1. Observations of Triton with AKARI/IRC
| Module | UT Time | Date | Longitudea | Wavelength | Resolution (λ/Δλ)b |
|---|---|---|---|---|---|
| NG | 1805–1821 | 2007 May 13 | 36° | 2.5–5.0 μm | 135 |
| NG | 1010–1037 | 2009 Nov 15 | 31° | 2.5–5.0 μm | 135 |
| NG | 0059–0127 | 2009 Nov 16 | 69° | 2.5–5.0 μm | 135 |
| NP, SG | 0310–0327 | 2007 May13 | 358° | 1.8–5.5 μm | 22 (NP) |
Notes. Triton was not detected in the nominal wavelength range of the modules SG1 and SG2. aAt half way through the observation. bAt 3.5 μm (NP) and 3.6 μm (NG).
Download table as: ASCIITypeset image
Raw data were reduced using the appropriate version of the IRC spectral reduction pipeline (Lorente et al. 2007) for each data set. The pointings consisted of eight or nine exposures, and each sub-frame was scrutinized for severe damage. It was only rarely found and never at a pixel corresponding to 4.76 μm, our wavelength of interest. In order to achieve maximum signal-to-noise ratio, we rejected therefore none of the sub-frames from the grism.
The spectrum taken on 2009 November 15 was less useful for our purpose than the others, because Triton was only 3 pixels away from Neptune in the cross-dispersion direction. As the FWHM of the point-spread function (PSF) for the IRC-NIR bands amounts to 3.2 pixels and one pixel has a size of 1 46 × 146, this means that the Neptune/Triton flux ratio is too high at certain wavelengths. Nevertheless one finds narrow absorption features at 4.68 and 4.76 μm, if one extracts a spectrum at the position of Triton, but not at the same distance from Neptune on the other side. Unfortunately larger, but spurious variations appear at the off-source position so that the lines at the wavelengths of interest cannot be considered significant. Fifteen hours later Triton was 12'' away from Neptune in the cross-dispersion direction, however, and therefore its other spectrum taken in 2009 November is free of contamination from the planet.
An intermediate case is the NG spectrum from 2007, where Neptune was included in the field of view at a distance of 6'' in the cross-dispersion direction. Its contribution to Triton's spectrum was not negligible, but could be subtracted (see Figure 3). It was obtained from off-source spectra, extracted at a similar distance from the planet as Triton, but on the other side. As this distance had to be chosen with an integer pixel number, and the center of the images of both Neptune and Triton did not fall exactly on the center or the edge of a pixel, we used two different spatial positions next to each other and averaged them. Different weights were applied in order to obtain the value for the correct in-between position. Because the change in brightness of the spectrum along the cross-dispersion direction is quite steep, we suspect that a small over-correction is one of the reasons for the negative values present in the resulting spectrum from the grism. The spectrum from the off-position was smoothed by the FWHM of image PSF, i.e., 3 pixels.
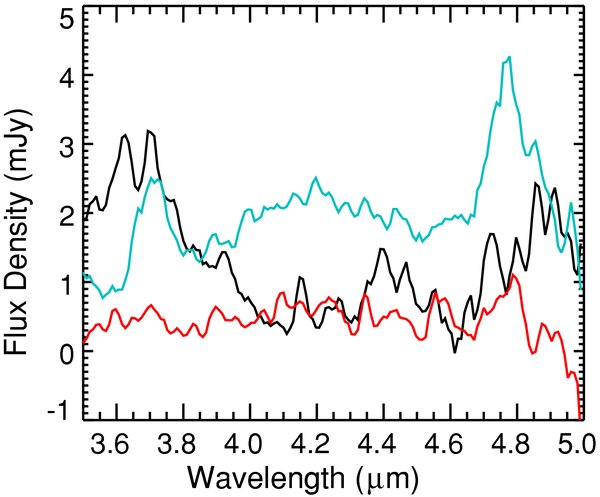
Figure 3. On-target spectrum of Triton (black) with the grism from 2007 May, together with the on-target spectrum of Neptune (blue), divided by 2, and the off-target spectrum (red), taken at the same distance from the planet as its moon, but on the other side.
Download figure:
Standard image High-resolution imageThe contribution of Neptune to Triton in prism mode was found to be smaller than in the grism mode observation from the same day, because in the slitless spectrum Neptune stood "at shorter wavelengths" relative to Triton in the dispersion direction. Therefore the "blue" part of Neptune's spectrum could not affect Triton's spectrum, and any stray light from its features would affect its moon here at other wavelengths. As a consequence, NP provides an independent check of the reality of broad features in NG. Figure 3 also proves that the features of interest in our spectrum of Triton could not have been introduced by over- or under-correction of Neptune's contribution, because there are no counterparts with the same wavelength and width in the off-spectrum. We mention, too, that the measured reflectivity, calculated by assuming the Sun to be a black body of 5800 K, agrees at 2.5 μm within 10% with measurements from the ground (Cruikshank et al. 2000, Figure 1). As Neptune's flux density is at 2.5 μm about twice as high as at 4 μm, this shows that its contribution was removed for the most part also in the wavelength region presented here.
Due to the presence of Neptune, the spectrum of Triton could not be extracted at wavelengths beyond 6 μm. But spectra were obtained outside the nominal range of the SG1 dispersion element, i.e., shortward of 5.8 μm, and an absorption feature is present at 4.8 μm. As the extended range of the SG1 is not really trustworthy, however, we cannot give an accurate signal-to-noise ratio for this line.
2.1. Field of View
Triton's disk subtended 7 × 10⁻¹⁴ steradians at the time of the observations and can therefore be considered a point source. For the extraction of its spectra, we used 2 (for the grism) or 3 pixels along the cross-dispersion axis and checked that the chosen position of the extraction rectangle produced the maximum signal. Three pixels are the default value; two pixels often give a better signal-to-noise ratio for weak sources.
2.2. Wavelength Calibration
The pipeline determines the location of the center of the source on the array. We checked by careful examination of the raw data that this processing resulted in the correct identification of the target position and changed it by a fraction of a pixel in the spectrum from 2009. As Triton stood rather close to Neptune, however, when the NG spectrum was taken in 2007, we determined the source position in this case without the pipeline and corrected the wavelength scale by 2 pixels, using the absorption line of CO at 4.68 μm as a reference. A similar inaccuracy was found with Neptune's spectrum (Fletcher et al. 2010) from the same day and in each case was corrected for by using the command change_wave_offset, which was provided as part of the toolkit for interactive data processing. All of the spectra in Figure 3 were based on the same zero wavelength reference point; i.e., Neptune's spectrum was shifted in order to take its distance from Triton in the dispersion direction into account.
2.3. Post-helium (Phase 3) Mission
Our observations in 2009 were carried out after the liquid helium in the AKARI satellite was exhausted and the quality of the data was degraded. The dark current is much higher in phase 3 than in phase 2, and a good flat field is not available at the time of writing (Y. Ohyama 2010, private communication). As a consequence, the pipeline produced a somewhat better spectrum when executed with the no_slit_flat option. Both the CO feature at 4.68 μm and the HCN feature at 4.76 μm were present, however, in the final product of the processing with and without flat field. In an additional step, we extracted a spectrum right next to Triton, further away from Neptune, normalized it to zero overall flux level, and subtracted it from Triton's spectrum. The reason for this is that most spurious features appeared in both spectra, whereas Triton's faint emission had largely disappeared in the nearby off-source spectrum. By then we had removed the obvious outliers in both spectra—about 5% of the points—and smoothed them over 3 pixels. The result is plotted in Figure 1.
3. RESULTS FROM THE NEAR-IR REFLECTANCE SPECTRUM: 4.0–5.0 μm
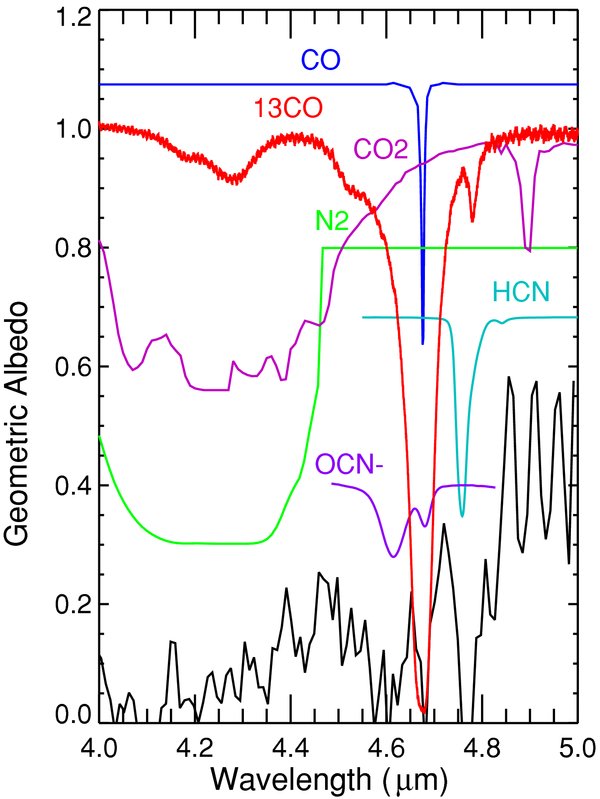
Triton's near-infrared spectrum from 1.4 to 2.5 μm has been analyzed by Quirico et al. (1999), who successfully modeled the ground-based observational data in great detail with a scattering theory incorporating the laboratory-determined optical constants of the ices of CO, CO2, CH4 dissolved in N2, and H2O. While our ultimate goal is to model the entire spectrum from 1.4–5.0 μm, we are hampered by the lack of optical constants for the critically important CH4:N2 component beyond about 2.8 μm (Quirico & Schmitt 1997a). Those data have recently become available and we will soon proceed to compute the complete model. In this Letter, we focus on the limited wavelength region 4.0–5.0 μm where CH4 has no significant band absorption, the N2 fundamental can be approximated by pure N2, and where we find a feature coinciding with the signature of the ice of HCN. In Figure 4, we compare the average grism spectrum from Figure 1 with the spectra of CO, CO2, and N2 to demonstrate their positions and approximate contributions to the strength of the absorbed region in the Triton data.
Figure 4. Grism spectrum of Triton (black line) is shown in the limited region 4.0–5.0 μm. The other spectra in the graph are plotted at arbitrary levels and vertical scales for clarity. The CO spectrum is from Hudgins et al. (1993) and N2 is a model calculated from the optical constants of Grundy et al. (1993) for a grain size of 1500 μm. The CO2 spectrum is a model calculated as an intimate mixture of 5% CO2 (constants provided by Dr. G. B. Hansen) and 95% of a spectrally neutral material (NaCl). The 13CO spectrum, merged with C18O, is from Quirico & Schmitt (1997b). The spectrum of orthorhombic crystalline HCN at T = 160 K was made available by Dr. R. Mastrapa. The spectrum of OCN− was provided by Dr. M. H. Moore.
Download figure:
Standard image High-resolution image
4. DISCUSSION
The model spectra of the various molecules in Figure 4 should be considered schematic only, presented to show the general effects of the strong N2 and CO2 bands across the range 4.0–4.5 μm, and the coincidence in wavelength of the CO fundamental at 4.68 μm and HCN fundamental at 4.76 μm with discrete bands in Triton's spectrum. Only hydrogen cyanide has a band at exactly this wavelength, and one other molecule comes close, viz., 13CO, which peaks at 4.78 μm in the α-phase, and at a slightly longer wavelength in the β-phase of N2. Its larger distance from the absorption line of CO, our reference point, means that it can only contribute to the shoulder of the band detected with AKARI. So our experimental data suggest that CO isotopes could contribute to the feature, but do not account for most of it (see Figure 4). We can also rule out the possibility that the fundamental vibrational mode of HCN is shifted on Triton, in spite of the fact that protons in HCN can establish hydrogen bonds, either in pure HCN crystals or mixed with other molecules like H2O. This phenomenon affects namely the C–H stretching fundamental mode, ν3, which is known to be shifted by 200 cm−1 in the pure HCN crystal with respect to the gas and the HCN molecule isolated in a noble gas matrix (Uyemura & Maeda 1972; Müller et al. 1993). However, because the normal vibrations are strongly decoupled in this molecule—the mass ratio between N and H atoms amounts to 14—the normal mode ν1 approximates the stretching mode of C≡N and is insensitive to the hydrogen bond. Hence, the position of this vibration mode is independent from the environment, and the peak positions reported by different authors such as Moore & Hudson (2003) and Müller et al. (1993) are actually quite similar.
There are several other discrete absorption features in the Triton spectrum that could represent still unidentified molecules but do not constitute convincing detections. We note in particular that the deep absorption structure at 4.57–4.65 μm, adjacent to the strong CO band, bears close similarity to a band in several embedded protostars and is termed "XCN" (Pendleton et al. 1999). This band is now generally regarded as arising from the OCN− anion, although as Pendleton et al. (1999) point out, isonitriles have absorption bands at exactly this wavelength as well. An isonitrile is a molecule with the functional group–N≡C, i.e., the CN functionality is here connected to the rest via the nitrogen and not, as in the proper nitriles, the carbon atom. Isonitriles were considered unlikely in astrophysical sources because of the lack of the corresponding nitrile bands, but on Triton at least the simplest nitrile HCN very likely exists, opening the possibility that the 4.57–4.65 μm band structure is due to an isonitrile. OCN−, on the other hand, is a radiolytic product of the proton irradiation of ices containing N2 and a source of carbon, such as CH4 or CO (Moore & Hudson 2003). In Figure 4, we show a spectrum of OCN− from Moore & Hudson (2003) to demonstrate its potential for the identification of the corresponding absorption structure in Triton's spectrum.
We note that other identifying bands of HCN (e.g., 3.043 μm) fall in regions of heavy absorption by other molecules, or are too weak to be seen, consistent with the conclusions of Quirico et al. (1999) in the analysis of the shorter wavelength spectrum.
Hydrogen cyanide is produced in an ice mixture of N2 + CH4 + CO (100:1:1) at temperature 12 K by 0.8 MeV proton bombardment and UV irradiation (Moore & Hudson 2003), and is stable at the temperature of Triton's surface, as well as at significantly higher temperature. The production rate in terms of the number of molecules formed per 100 eV of energy deposited was found to be 0.025 for the trinary mixture of ices noted above and about 2.6× greater for the binary mixture N2 + CH4 (100:1). HCN is also efficiently produced in Triton's thin (≈15 μ bar surface pressure) atmosphere by a cyclic process involving CH4 and N2 plus a third body, with an estimated production rate of 29 g cm−2 Gy−1, some or all of which eventually precipitates to the surface (Krasnopolsky & Cruikshank 1995). HCN has not been previously detected on a solid surface, but it was found in cometary comae (Bockelée-Morvan et al. 2004).
5. CONCLUSIONS
After having produced the first spectrum of Triton between 4 and 5 μm and tentatively identified hydrogen cyanide, we looked for the signatures of other nitriles. Compounds of this class are particularly interesting, because they can form biological molecules, such as amino acids (Hudson & Moore 2003). From five different species—ethyl cyanide (CH3CH2CN), methylcyanoacetylene (CH3C3N), dicyanoacetylene (C4N2), cyanoacetylene (HC3N), and methyl cyanide (CH3CN)—only HCCCN exhibits an absorption band that coincides with a small line, at 4.83 μm (Khanna 2005), in the measured spectrum, and we do not claim to identify this material. The strongest bands of the more complex nitriles lie sufficiently far away from 4.76 μm to make a mix up with hydrogen cyanide impossible.
Our evidence for the presence of HCN also raises the intriguing question of whether the ejecta of cryovolcanism in Triton's south polar region get their color from brown hydrogen cyanide polymers, again with possible relevance for our understanding of the origin of life (Matthews 1995). We conclude that Triton offers fascinating possibilities for the study of processed surface molecules at infrared wavelengths.
We are grateful to R. Lorente, T. Onaka, and A. Salama for helpful advice on the data reduction.
Facilities: Akari - Akari (ASTRO-F)
Footnotes
- *
This work is based on observations with AKARI, a JAXA project with the participation of ESA.