
Abstract
Materials are generally classified by a phase diagram which displays their properties as a function of external state variables, typically temperature and pressure. A new dimension that is relatively unexplored is time: a rich variety of new materials can become accessible in the transient period following laser excitation from the ground state. The timescale of nanoseconds to femtoseconds, is ripe for investigation using x-ray free-electron laser (XFEL) methods. There is no shortage of materials suitable for time-resolved materials-science exploration. Oxides alone represent most of the minerals making up the Earth's crust, catalysts, ferroelectrics, corrosion products and electronically ordered materials such as superconductors, to name a few. Some of the elements have metastable phase diagrams with predicted new phases. There are some examples known already: an oxide 'hidden phase' living only nanoseconds and an electronically ordered excited phase of fullerene C60, lasting only femtoseconds. In a completely general way, optically excited states of materials can be probed with Bragg coherent diffraction imaging, both below the damage threshold and in the destructive regime. Prospective methods for carrying out such XFEL experiments are discussed.
Export citation and abstract BibTeX RIS

Original content from this work may be used under the terms of the Creative Commons Attribution 3.0 licence. Any further distribution of this work must maintain attribution to the author(s) and the title of the work, journal citation and DOI.
The phase diagram of a material classifies its properties as a function of external state variables, typically temperature and pressure. This paper explores the possibility of generating new phases by laser excitation from the ground state. Any new phases that are discovered in the time domain might be stabilised by other means for future exploitation. The femtosecond to nanosecond timescale, is well matched to x-ray free-electron laser (XFEL) facilities, especially those that are under construction. The paper considers how XFEL-based techniques could be used to carry out materials science investigations in the time domain. For example, there exist metastable phase diagrams of the elements containing predictions of new phases. It is possible to exceed the damage thresholds of either (or both) optical-pump excitation and x-ray probe beams in the search for new phases. This pump–probe XFEL methodology is expected to see rapid expansion into all of these applications.
We can already glimpse this future in some examples: a 'hidden phase' of Nd0.5Sr0.5MnO3 has been reported using classical pump–probe methods with a plasma x-ray source [1]. This has a new crystal structure with different symmetry identified by its diffraction pattern, but lives only for nanoseconds [1]. A new transient phase of elemental gallium lasting tens of picoseconds after laser illumination has been found [2]. Transient optical coherent transport, possibly superconducting, has been observed all the way up to room temperature [3]. An electronically ordered excited phase of C60, lasting only femtoseconds, has been discovered by Abbey et al as a function of fluence during the same XFEL pulse that was used to observe it [4]; this new state can only be electronic in nature because the measurement time is too short for the atoms to move.
To explore the properties of materials in the time domain, both under familiar environments and under the extreme conditions that are only accessible with ultrafast lasers, an ultrafast version of Bragg coherent diffraction imaging (BCDI), a powerful x-ray characterisation methodology, is highly suitable. With the pump and probe both below the damage threshold at an XFEL, BCDI has shown how the structure of a single nanocrystal varies on the picosecond time scale and revealed an unexpected transient melting phenomenon.
1. Dynamics of phase transitions
Some phase transformations are classified as 'displacive' because the pathways connecting the crystal structures of the two phases involve small displacements of atomic positions. A nanometre-sized grain, such as those we plan to study with XFEL BCDI, can therefore undergo a phase transition at the speed of sound, i.e. within a few ps, depending on the size of the sample. Picosecond time-resolved experiments at the x-ray pump–probe (XPP) station of the Linac coherent light source (LCLS) XFEL have observed the transition state dynamics of the hexagonal (wurtzite)-to-cubic (rocksalt) structural phase transformation in rod-shaped cadmium sulphide nanocrystals around 100 nm in size [5]. Powder diffraction pattern of CdS nanocrystals as a function of delay time after excitation of a nearby acoustic wave generator with a Ti:Sapphire laser shows the onset of the crystal symmetry changing after 200 ps. [5]. The authors employed a thin aluminium layer and a polyvinyl alcohol (PVA) isolation layer to convert the laser drive pulse into a pressure wave, generating a shock. The delay is due to the travel time of the acoustic wave in the PVA, but the actual transformation is abrupt, indicating the whole crystal transforms collectively without multiple nucleation sites.
In some systems, it is possible to study the effects of optically driven direct electronic excitations without prior conversion into a pressure wave. In oxide superlattices, for example, depending on the laser wavelength used, excitations result in electrons localised at the superlattice interfaces due to the band mismatch between the materials. The effect becomes visible via the inevitable electrostriction of the lattice surrounding the ions whose charge state will be modified. These excitations are expected to live into the picosecond time scale, long enough to be visualised with the sub-100 fs pulses of an XFEL. A full structural analysis of the time dependence of the positions of each atomic plane in the structure is possible in principle for each time delay value. Pump–probe experiments, this time using a plasma x-ray source, were used to measure a superlattice of lead–zirconate–titanate (PZT) and strontium–ruthanate (SRO). It was found by detailed modelling that two different superlattice peaks showed different sensitivities to the relative strain in the crystal and the tetragonality of the unit cells [6]. In this way two relative intensity measurements could be diagonalised into the two structural parameters for observation by pump–probe. It was also found that the peaks did not change position significantly for up to 10 ps delay times when the heating effects presumably set in [7]. Similar effects have been seen in the multiferroic BiFeO3 [8].
Picosecond timescales are well-provided by XFEL facilities, and can go down below 0.1 ps when needed. The 100 nm sample size scale is also ideal because it is large enough to record a BCDI diffraction pattern in a single shot and small enough that the mechanical changes in the structure can propagate right through within a few tens of picoseconds. The BCDI methods employ 3D imaging to resolve the structural changes with a spatial resolution down to 20 nm and a temporal resolution below 1 ps, which is perfect to watch the conversion of electronic excitation into mechanical structure changes.
2. Laser excitation of nanoparticles
Over the last ten years, studies of the laser excitation of nanostructures have been carried out by a number of groups, including Hartland [9], Sokolowski-Tinten [10] and Nielsen [11]. The results are roughly divided into two categories, one for free standing nanoparticles, the other for thin films. Both systems demonstrate shape-dependent material vibration response due to the propagation of acoustic waves within the solid with open boundary conditions at its free surfaces. This leads to oscillations of the whole structure which represent the mechanical response to the excitation. Complex shapes have more frequencies, three [11] or seven [12] for InAs and GaAs nanowires, while deviations from the classical Newtonian response can be attributed to changes in the thermodynamic response functions, which are thereby investigated.
Hartland's experiments were conducted on colloidal suspensions of nanoparticles using a second laser pulse to probe the structure of the excited state [9]. Careful prior calibrations of the probed absorption spectrum allowed the nanoparticle lattice constant to be extracted from the peak shift. Oscillatory behaviour was found due to the radial 'breathing mode' of the spherical particles. This was explained in the language of the 'two temperature model' (2TM) [13, 14] in which the femtosecond exciting laser pulse heats the electrons to a very high temperature which subsequently transfer their energy to the crystal lattice. According to the 2TM, rapid laser excitation of a material is followed by slower coupling to the lattice over a longer delay time until the temperature equilibrates [14]. The electron phonon coupling responsible for the second step lasts for a few picoseconds. A small phase advance of the oscillations was observed [9], and explained by a classical model in which a transient electronic contribution to the thermal expansion was included.
The study of Au thin films by Nicoul et al in the Sokolowski-Tinten group [10] used a plasma x-ray source to probe the lattice parameter of the film in the direction perpendicular to the substrate. The film was therefore constrained by an interface on the substrate side and an open boundary condition on the vacuum side. Mechanical modelling of the vibrations of such a system experiences damping because of the partial transmission of phonons at the interface, but several oscillations of the film are still observable. Interestingly, the phase of the triangular wave caused by the phonons traversing the film shows a delay of about 5 ps in the opposite direction to the Hartland result. This delay was attributed to the electron phonon coupling time [8].
3. Theoretical modelling
These systems are ideal for theoretical modelling by molecular dynamics and ab initio methods. The general starting assumption for metals is the '2TM' , illustrated in figure 1, which states that the laser directly excites the electrons which thermalise to reach an electronic temperature, Te often >104 K, within a few tens of femtoseconds due to electron–electron collisions. Electron–phonon (e–p) coupling then transfers this energy to the ions on a time scale of a few tens of picoseconds leading to the thermal response of the lattice [13]. Clearly the detailed roles of electron and lattice contributions to the equation of state as well as thermodynamic quantities have to be included. However, there are many questions concerning the structural evolution of the lattice structure during the first tens of picoseconds after laser illumination.
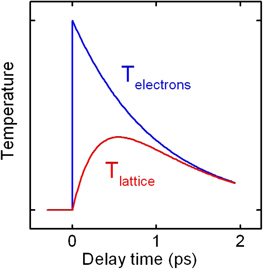
Figure 1. The 'two temperature model' (2TM) showing the electron temperature (Te) and lattice temperature (Tlattice) immediately following laser excitation of a metal. Redrawn from [14].
Download figure:
Standard image High-resolution imageTheoretical predictions are very different for different types of material. Density-functional theory (DFT) calculations of the phonon spectrum for Si (at Te = 2.15 eV or 26 000 K) shows significant softening during the initial electronic excitation of the 2TM model, while Au is seen to harden significantly at Te = 6 eV or 70 000 K [13], contrary to the predictions of the classical Debye model, in a time-resolved electron diffraction pattern of a gold film excited well beyond melting at 470 J m−2. The onset times of the indicated diffuse features were found to be shorter at higher fluences [13]. It has been pointed out [15] that the expected softening in the Debye model is due to lattice expansion, which is excluded from the DFT calculation [13]. The general trend is rationalised by a picture of changing the covalent bonds from bonding to antibonding in Si, compared with enhanced population of the metallic electron 'glue' in Au. At a more detailed level, it is important to distinguish between the e–p coupling and the direct change in the interaction forces between the atoms. The latter will only occur on very short, femtosecond timescales while Te is still high in the 2TM; the e–p coupling will continue for much longer, ps times. The hardening of Au has been attributed to an observation of shortening with fluence of the rise time of the diffuse electron diffraction peaks from about 7 to 2 ps [16]. The interpretation in terms of hardening has been disputed [15].
There are interesting unanswered questions in these studies. The phase of the particle oscillations following the ultrafast excitation, discussed above, is an experimental controversy, which needs to be resolved because it relates to the detailed question of e–p coupling versus bond strength. The nanoparticles showed a phase advance [9], implying an additional electronic driving force, while the thin film showed a retarded oscillation [10]. It could be that these experiments had different Te's resulting in different interatomic forces at early times. The response of the crystal lattice during the first picosecond, when the forces are modified and the excitation energy transfers from the electrons to the phonons, is the underlying cause of this phase in the 2TM, but has not yet been measured but really needs to be understood; this experiment cannot be done with a plasma source and requires an XFEL. The ultrafast electron diffraction results of the Miller group [16] need to be confirmed and extended from thin films to nanoparticles. In particular, the lattice response to destructive, above damage-threshold fluences is completely unexplored because it calls for a new 'single-shot' technology, discussed below.
While much of the theory and experimental work has been performed on gold, which has a number of practical advantages, the interests of materials science invite the application to other crystals. As mentioned in the introduction, oxides are an obvious choice because of their rich phase diagrams and exotic electronic configurations [3, 6–8]. But even simple elements are predicted or found to have metastable phases, such as Ga [2] and Zr [17]. A recent new theoretical prediction is that BCC tungsten will have an electronically driven FCC phase within the first picosecond under ultrafast high-fluence conditions [18].
4. Bragg coherent diffraction imaging
The BCDI method relies on the high coherence of the XFEL beams. The diffraction pattern of a nanocrystal, once coherently illuminated, contains interference from all its regions appearing as fringes surrounding each Bragg peak in 3D. The simplest fringes are those which arise from interference between opposing facets on the crystal shape. Then the diffraction follows a 'sinc' function with a fringe spacing on the detector, s, given by the 'grating formula' s = λD/d where λ is the wavelength, d the distance between the facets (i.e. size of the sample), and D is the detector distance. Spherical crystals have a circular fringe pattern given by a corresponding 3D Airy function, while a facetted crystal will give a combination of both these patterns as an amplitude superposition.
A stack of frames containing 2D diffraction patterns, obtained for small rotations of the crystal, is called a 'rocking curve' and completely surrounds the Bragg peak. This amplitude is the complete Fourier transform of the crystal shape in three-dimensions (3D). Whenever the complex amplitude of a diffraction pattern is 'oversampled' with respect to the spatial Nyquist–Shannon sampling frequency it can be phased using a suitable 'phase retrieval' algorithm, using the knowledge of its finite spatial extent, called the 'support', as a constraint. For BCDI, the most important algorithm is Fienup's 'hybrid input–output' (HIO) method [19] which avoids stagnation of the algorithm. A typical image using HIO is shown in figure 2.
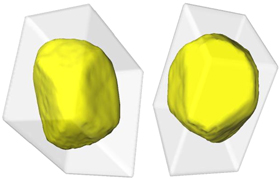
Figure 2. 3D isosurface views of a 200 nm gold nanocrystal showing the presence of both facets and round surface regions. The grey box is the support used to phase the BCDI data.
Download figure:
Standard image High-resolution imageComplex 3D electron density maps are generated by this method. The density becomes complex whenever the data breaks inversion symmetry around the Bragg peak centre [20]. Real nanocrystals are strained and the local displacements result in phase shifts of the density seen in the 3D image. The magnitude of the complex density function represents the electron density of the crystal, while the real-space phase image, φ(r), represents its distortion from an ideal lattice, mapped out as a function of position r within the crystal. The mapping is fully quantitative and given by the relationship φ(r) = Q · u(r), where Q is the momentum transfer vector of the reciprocal lattice point measured and u(r) is the vectorial displacement field representing the distortions from the ideal crystal lattice [20]. The spatial derivative of the displacement field is the formal strain tensor. Since only one component of the displacement field is measured at each Bragg peak, phase images from three or more independent Q-vectors must be combined together to obtain a full vectorial 3D reconstruction of u(r). Such data for ZnO nanocrystals led to full 3D images of each component of the full strain tensor [21].
Appropriate visualisation of 3D fields is a generic challenge because these contain a wealth of information. Cross sections of individual components can be displayed as contour plots, but several sections are required to convey the full information. For nanocrystals where the strains are commonly associated with the surface, an isosurface view can be displayed at a single contour level of the electron density, representing the shape of the crystal, while the phase is used to colour it on a colour wheel from blue (−π) to red (π). The surface variation of the imaged component of the displacement field is then clearly seen. Small changes, for example caused by the laser excitation of the crystal, can be seen in a similar way using difference Fourier methods [22].
5. Time resolved structural changes in nanocrystals
An ultrafast BCDI experiment was carried out at the LCLS on gold nanoparticles using the XPP station. Diffraction patterns from individual crystals were isolated on the csPAD detector and their centres of mass recorded after averaging the best 100 frames selected from groups of 1000. The dose was below the damage threshold, allowing repeated measurements on the same particle. Figure 3 shows the position of the (111) Bragg peak of a single 300 nm free-standing gold nanoparticle as a function of delay time between the laser excitation and the BCDI measurement. The pattern of oscillation is consistent with the two vibrational breathing modes expected for a cylindrical sample [23]. The interference of two sinusoidal modes is clear in the pattern of oscillations which has been decomposed by lineshape fitting. These modes, plotted separately in figure 3(b), are conventional in the sense that they correspond to acoustic waves travelling at the speed of sound across the size of the cylinder-shaped crystal.
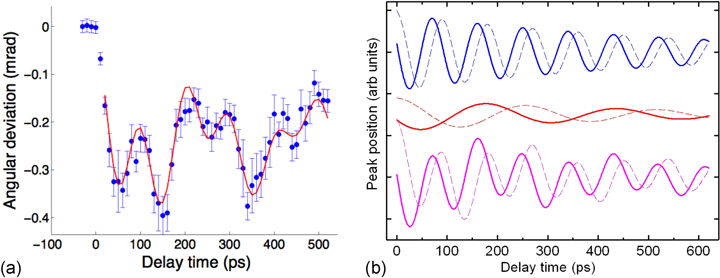
Figure 3. (a) Oscillations in the lattice constant of gold due to laser-driven vibrations seen in an experiment at the Linac coherent light source (LCLS). (b) Decomposition of the time dependence into two simple oscillation components, top and middle, with their sum as the bottom trace. Full curves are the best fit to the data (close to sine functions), while dashed curves have the phase shift removed (cosines) [23].
Download figure:
Standard image High-resolution imageSimilar to the Nicoul et al [10] and Hartland [9] experiments mentioned above, these oscillation show an unexpected phase shift compared with the starting-from-rest behaviour expected for simple thermal heating by the laser. The phase of both modes (figure 3(b)) is advanced, in the same direction as the findings of Hartland [9], but opposite to that of Nicoul et al [10]; this latter result, for a thin film, might be different because of acoustic damping at the interface with the substrate.
The observation in figure 3 shows a clear sinωt time dependence of both modes, suggesting a sudden acceleration of the particle to its maximum velocity from rest at t = 0, rather than a cosωt time dependence corresponding to inertial acceleration from rest, shown as dashed curves in figure 3. This apparent phase shift can be understood in the language of impulsive stimulated Raman scattering (ISRS) [24]: the impulsive heating of the electrons in the 2TM (figure 1) establishes a suddenly shifted interatomic potential which drives the cores of the atoms to move quickly in response. The sinωt time dependence is explicitly predicted by the ISRS theory of Dahr et al [24].
After removal of the centre-of-mass motion, BCDI images were used to identify a novel shear mode of vibration in addition to the two vibrational breathing modes [23]. Further LCLS experiments imaged a different gold nanocrystal using time-resolved BCDI as a function of laser fluence [25]. Clear nonlinearities were found in the vibration amplitudes as a function of fluence, while the images show a clear core–shell structure, solid in the core and liquid-like in the shell, which is most developed right at the time of maximum dilation of the crystal. The interpretation of these data is that there is a transient quasi-liquid layer forming on the outside of the crystal, creating the core–shell structure shown in figure 4. This melting repeats on every oscillation of the crystal, but is strongest on the first cycle. It also repeats with the 8 ms measurement cycle of LCLS, as needed for the stroboscopic measurements to succeed.
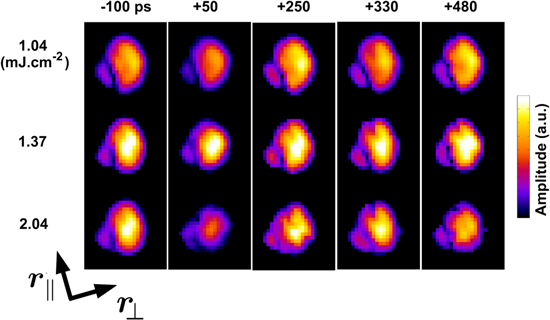
Figure 4. BCDI images of a 200 nm gold nanocrystal as a function of delay time after laser excitation (horizontal) and laser fluence (vertical) [25].
Download figure:
Standard image High-resolution imageThis result is highly significant because it probes the structure of matter in an expansion regime that is inaccessible in the steady state: the lattice expansion may go beyond the lattice constant of Au at its melting point, but for such a short time that atomic place exchange (diffusion) is forbidden. This interpretation is specific to non-embedded nanoparticles that have an open mechanical boundary condition at the surface, allowing the crystal vibration temporarily to reach an antinode with the biggest strain value. These experiments need extending into the ablation regime where the crystal is destroyed by the laser excitation. However this requires the development of new single-shot experimental methods, as discussed below.
Investigation of the equation of state in simple materials beyond the steady state regime is one of the exciting future applications of XFELs in materials science. BCDI, operating under 'single-shot' conditions, will need to be developed accordingly. Since each pump–probe measurement requires a fresh sample, it will be necessary to prepare samples as close to identical as possible; the inevitable small variations between samples can be accounted for post facto by hierarchical sorting methods [26]. The rocking curves needed to obtain 3D images in BCDI will be pieced together by sorting the data according to Bragg-angle deviation, which can be established automatically by correlation with the diffraction pattern of a 'typical' reference crystal.
6. Materials under extreme conditions
Alloy formation can be explored by coating a second material onto a standard sample of known properties. For example, Au–Pt alloys where the presence of surface layer of higher melting-point material will affect the melt front and ablation rate; this has potential catalytic applications. Au–semiconductor alloys with deep eutectic phases are central to the vapour–liquid–solid (VLS) mechanism for nanowire growth; the dynamic aspects of VLS growth can be studied by pump–probe methods.
The reversible apparent melting of a solid following laser excitation is a fundamental result in condensed matter physics. This partially melted state, living for just tens of picoseconds at the highest fluence levels, is highly interesting with a high density core and lower density shell. The phenomenon is unique to nanosized samples with open boundaries, which do not constrain the laser-driven expansion. But there are significant technological applications of the reversibility, which could be used for catalysis by a material in an otherwise impossible state. Such nano-catalysts could be easily made and brought to the transient liquid state by activation with a laser.
Laser modification of materials can be achieved with fluences up to 3 × 10⁴ J m−2 in a 10 μm focal spot. The range of fluence used in the studies mentioned above, we note that 10–20 J m−2 of Ti:Sapphire (800 nm) was below the damage threshold for Au [24]. Non-damaging pump–probe experiments on InAs nanowires [11] used 60 J m−2, colloidal gold nanoparticles [10] 30–130 J m−2 and PZT/SRO superlattices 150 J m−2. Irreversible melting was reported in gold films [27] at 370 J m−2. The hardening of gold was found in the 'warm dense matter' regime between fluences of 470 and 1100 J m−2 [16]. The generation of shock waves to transform the CdS nanoparticles [5] used fluences of 4 × 10⁴ J m−2.
7. Pump–probe BCDI methodology
The small size of an XFEL x-ray beam source results in very high coherence of the resulting beam [28] providing an excellent opportunity for the application of coherent diffraction imaging (CDI) methods. The typical high peak brilliance of 1012 photons in a single pulse and the ultrashort pulse duration of 100 fs allow single-shot BCDI experiments on crystalline samples down below 100 nm in size [29].
While it is conceivable to perform pump–probe materials science experiments using samples streamed by hydrodynamic or aerosol jets, similar to those used in serial femtosecond crystallography[30], we consider it more practical to use a membrane-bound sample format with a scanning system to move samples through the beam fast enough to hit a fresh spot for every shot of the XFEL. New access paradigms may be needed because of the enormous cost of running an XFEL facility, particularly when many samples have to be examined, as in systematic materials science investigations. However, it should be possible to develop the technology needed to finish complete experiments within one hour of beamtime using a fully automated system without any intervention.
If complete BCDI experiments are performed in one hour, we are motivated to consider the access model in an altogether different way; once it is accepted that the throughput of an XFEL is inherently faster than the human thought process, we must simply accept that 'thinking during beamtime' is no longer allowed. Instead of the synchrotron model of massively parallel access with up to 80 beamlines fed simultaneously, we must evolve towards operating with different levels of time multiplexing.
For materials science applications, one could contemplate doing simple experiments which do not involve setup changes of the machine beyond those which can be fully automated. A 'standard' pump–probe single-shot diffraction experiment could be performed at fixed x-ray wavelength with a fixed detector bank at a standard distance from the sample, as shown in figure 5. In order to examine a wide variety of samples, the detector must span a wide enough range of Bragg angles. Rough estimates suggest that that 90% of experiments can be done at 0.138 nm wavelength (9 keV x-ray 'energy') and 2Θ = 35° ± 5°. This follows from the lattice spacings of most materials being set by the ionic radius of common elements like oxygen. The number of pixels must be large enough to oversample the diffraction from crystals up to some maximum size, which we take to be 1 μm. Bragg diffraction from crystals of this size will come close to saturating the dynamic range of an analog detector, which can be made as high as 105. This requires a detector of 2500 pixels in the radial direction and as many banks as possible around the circumference of the Debye–Scherrer cone.
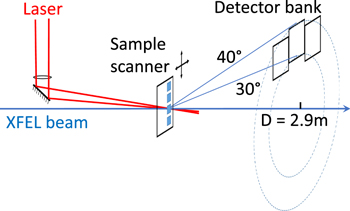
Figure 5. Schematic view of how the BCDI setup could be implemented at an XFEL.
Download figure:
Standard image High-resolution imageThe experimental variables remaining in this standard setup are those which can all be adjusted remotely through the beamline control system, since no manual intervention is envisaged. These variables include the laser fluence and time delay, the x-ray fluence (by means of attenuators and slits), x-ray and laser pulse sequences, beam sizes, and the sample position and angles. It is possible that the x-ray focus could be changed automatically by exchange or movement of compound refractive lenses (CRLs), but it is hoped that CRLs will not be needed because of the possibility of wavefront disruption. It is also envisaged that the x-ray wavelength will not need to be changed, although it is technically possible (albeit challenging) to do this automatically. Of all these allowed variables, it is the laser fluence/delay and sample position which will be most important in the work proposed here. The XFEL pulse sequence will be fixed by the detector limitations for maximum data streaming, so most experiments will vary only these three variables.
Most experiments will consume samples that will be destroyed by the laser and/or x-ray beams, so it is necessary to record single shots and automatically refresh the sample. In 'nano-crystallography', this is done by means of liquid-jet injection directly into the beamline vacuum [30]. While this is feasible, but largely not yet explored, for nano-sized samples of materials, we consider this to be less practical than scanning sheets of samples, bound to a membrane, through the beam. The already serious nozzle-clogging problems encountered in 'nanocrystallography' are only likely to become worse for colloidal materials, without careful and exhaustive testing and calibrations [30]. LCLS has been evaluating the membrane approach for protein crystallography applications with some success [31] and this has also been successfully developed for SACLA [32].
The samples could all be mounted side by side on the robotic sample changer [31] and be accompanied by a python script specifying what has to be measured on each one. The execution of the script would consume the entire shift and only need emergency intervention. It is even possible that the shift paradigm of running the facility might evolve to accommodate beam multiplexing methods, improving the efficiency further.
8. Sample preparation and delivery systems
A possible design, coordinating the sample membrane format and the mechanical system, is illustrated in figure 6. Twelve sample chips, each 50 mm square, on independent scanners will accommodate the 12 one-hour experiments to be carried out in a single shift at an XFEL. The critical element, shown schematically in figure 6 as a piezo, is the fast scanning driver needed to move a fresh area of sample into the beam between micropulses of laser excitation and x-ray analysis. The above estimate of 2 μs pulse separation for future XFEL sources and an expected 10 μm 'crater' region damaged by the laser focus, means the scanner has to reach 5 m s−1. Since the fastest commercial piezo system can provide 0.8 m s−1, it would be necessary to use a lever system to amplify the motions, taking advantage of the fact that the samples are fairly light in weight. This might also be achieved by a voice-coil or mechanical amplifier system, or even a 'CD-ROM' design. These estimates, particularly the damage crater size, may change considerably with the sample material.

Figure 6. Possible sample layout for an hour's worth of measurements will be contained in a single silicon chip containing Silicon Nitride membrane windows. The chip is coated with nanoparticle powder with a controlled density. There are enough lines per chip to last for one hour of measurement.
Download figure:
Standard image High-resolution imageRecent experiments have been carried out to document the survival of Silicon Nitride membrane windows in the SACLA XFEL beam [33]. It was found that 100 nm thick windows were occasionally shattered by single XFEL shots, but that 150 and 200 nm windows mostly survived. The damage was also found to depend strongly on how much sample was present in the beam: the size of the XFEL-drilled hole was seen to increase substantially on the heavily coated regions of the membrane and even caused some cracking. It was also found that visible changes in the material surrounding each shot was limited to a 5 μm circle, suggesting that the step between shots should be around this value.
The silicon chips will be coated with a uniform film of nanocrystalline particles, with the aim that they should not touch each other. This is needed to minimise sintering effects and mechanical interference between grains that would complicate the understanding of particle vibrations and strain pattern formation. Spin-coating of particles in the presence of suitable surfactants, such as PVP, could achieve this, but will need developing for each sample system being considered. Another method is to precoat the particles with several nanometres of SiO2, using an organic silicate, such as TEOS, which can be calcined to form silica [34]. A major advantage of measuring with BCDI is that diffuse scattering from these (mostly amorphous) support structures will contribute almost nothing to the wanted signal from the samples themselves, except to the extent that they might change the structure by introducing additional strains.
9. Statistical coherent x-ray diffraction
Destructive pump–probe experiments are fundamentally different from single-crystal BCDI experiments because there is no possibility to align samples with a beam that will also destroy them. Furthermore, to get the most information out of a BCDI experiment, not just one, but a series of diffraction patterns is needed by rocking the sample through a Bragg peak, so it can be reconstructed as a 3D object. Because this requires merging data from different crystals, and also envisaging total automation, it is necessary to maximise the level of information that can be obtained from 'blind' measurements. If a sample can be made reproducibly, every 'hit' can be merged together to make a consensus diffraction pattern, but this technology still has to be developed. The problem is especially challenging when the crystals are not identical and have to be 'classified' at the same time as figuring out their orientations. General 'manifold' methods to do this have been proposed for shape transforms measured in the forward direction [25]. Fortunately there are extra constraints on the BCDI case, which should facilitate a more powerful solution, especially for 'textured' samples.
The pattern of modulation appears as fringes surrounding each Bragg peak of diffraction from the crystal lattice. The simplest fringes are those which arise from interference between pairs of opposing facets on the crystal shape. Any facets on the crystal shape discussed above will give characteristic fringed flares in the diffraction patterns, as illustrated in figure 7. A stack of such frames, spanning the rocking curve, completely surrounds the reciprocal lattice point measured and so represents the complete diffraction pattern of the object in 3D [20, 35]. The texture effects place significant constraints on the diffraction patterns; for example in the 'fibre' texture case, under grazing incidence conditions, the cylinder-axis peaks always run in the same direction on the detector. An automated filtering package, combing through the data could determine the centre of mass position and hence the exact 2Θ angle for each peak located. This can be used to track the vibrations of the lattice parameter as driven by the laser 'pump'.

Figure 7. Coherent diffraction patterns measured near to the 111 Bragg peak of a 200 nm gold nanocrystal: 0.1° before, and 0.05°, 0.11° and 0.16° after the centre of the peak. These are typical of the snapshots that will be seen for randomly oriented samples.
Download figure:
Standard image High-resolution image
It might also be possible to use pattern-recognition methods to determine the fringe spacing automatically. This will allow determination of the crystal size distribution and then 'classification' of the diffraction patterns into groups coming from crystals of about the same size. Once classified, each group will be assumed to come from particles which are more-or-less identical; the range of sizes in each will need to be selected carefully and it may be appropriate to use a hierarchical classification scheme, starting with big groups. For each group we will then attempt to sort the patterns into positions on the rocking curve, assuming, if needed, that, statistically, there should be the same number of shots at each angle. Fortunately there is a strong left–right or up–down fringe asymmetry (as seen in figure 7), which will be used to decide on which side of the rocking curve a given pattern sits. Any residual asymmetry of the diffraction patterns directly informs us about strain effects in the samples.
This scheme for measuring BCDI data in the destructive fluence regime would allow the exploitation of the x-ray coherence of the XFEL source. If complete 3D diffraction patterns can be assembled from such measurements, after removal of the size distribution effects, the full power of phase retrieval using the BCDI protocol will be brought to bear on the data to yield 3D time-resolved images of the strain patterns.
In conclusion, we have discussed some of the ways that x-ray diffraction methods could be useful to study the structure of materials and their phase transitions in the time domain. The case for using a nanocrystalline format for the materials is made to capitalise on the powerful strain imaging capabilities of BCDI. It is argued that there is a possibility of discovering transient 'hidden' phases of materials which live for just a short time. If important, potentially useful properties of such hidden phases can be revealed in this way, then the classical materials optimisation approaches (doping, elemental substitution, strain engineering etc) can be used to stabilise them for longer time so that they can be exploited.
Acknowledgments
The work reported in this paper was supported by a European Research Council 'Advanced' Grant, 'Exploration of strains in synthetic nanocrystals' and an EPSRC grant EP/I022562/1 on 'Phase modulation technology for x-ray imaging'. JNC gratefully acknowledges financial support from the Volkswagen Foundation. The experimental work was carried out at the Linac coherent light source (LCLS) at the SLAC National Accelerator Laboratory. LCLS is an Office of Science User Facility operated for the US Department of Energy Office of Science by Stanford University. Use of the LCLS, SLAC National Accelerator Laboratory, is supported by the US Department of Energy, Office of Science, Office of Basic Energy Sciences under Contract DE-AC02-76SF00515. We thank D M Fritz, H T Lemke, Diling Zhu, M Chollet, G J Williams, M M Messerschmidt for valuable assistance with operating the XPP station at LCLS and B Abbey, A M Korsunsky, J S Wark and D A Reis for collaboration and fruitful discussions. We thank Nicolas Moisan (Université de Paris Sud) for helpful discussion and pointing out the relevance of the ISRS theory in [24].