
Abstract
Exhaled breath analysis is evolving into an increasingly important non-invasive diagnostic tool. Volatile organic compounds (VOCs) in breath contain information about health status and are promising biomarkers for several diseases, including respiratory infections caused by bacteria. To monitor the composition of VOCs in breath or the emission of VOCs from bacteria, sensitive analytical techniques are required. Next to mass spectrometry, ion mobility spectrometry (IMS) is considered a promising analytical tool for detecting gaseous analytes in the parts per billion by volume to parts per trillion by volume range. This work presents a new, dual coupling of thermal desorption gas chromatography to a quadrupole mass spectrometer (MS) and an IMS by operating a simple splitter. Nearly identical retention times can be reached in the range of up to 30 min with slight deviations of 0.06 min–0.24 min. This enables the identification of unknown compounds in the IMS chromatogram using unambiguous mass spectral identification, as there are still no commercially available databases for IMS. It is also possible to discriminate one of the detectors using the splitter to improve detection limits. Using a test liquid mixture of seven ketones, namely 2-butanone, 2-pentanone, 2-hexanone, 2-heptanone, 2-octanone, 2-nonanone, and 2-decanone with a concentration of 0.01 g l−1 reproducibilities ranging from 3.0% to 7.6% for MS and 2.2%–5.3%, for IMS were obtained, respectively. In order to test the system optimized here for the field of breath analysis, characteristic VOCs such as ethanol, isoprene, acetone, 2-propanol, and 1-propanol were successfully identified in exhaled air using the dual detector system due to the match of the corresponding IMS, and MS spectra. The presented results may be considered to be a starting point for the greater use of IMS in combination with MS within the medical field.
Export citation and abstract BibTeX RIS

Original content from this work may be used under the terms of the Creative Commons Attribution 4.0 license. Any further distribution of this work must maintain attribution to the author(s) and the title of the work, journal citation and DOI.
1. Introduction
Gas chromatography (GC) is unquestionably the method of choice for separating a wide range of volatile organic compounds (VOCs) in gaseous samples. Its separation performance, in combination with detector technologies like mass (MS) or ion mobility spectrometry (IMS), helps to identify numerous volatile analytes in complex matrices [1, 2].
Mass spectrometry has been known since the 20th century [3]. However, its uses have expanded rapidly since that time and are now considered the gold standard in many applications [4]. In contrast, IMS has only been present for a few decades but has become the most successful and widely used technique in the security field (detection of illegal drugs and explosives) and military use (authentication of chemical warfare agents) [5–7]. In recent years, IMS has also been used increasingly in other areas like product and quality control in the food industry [8, 9] and in the medical field such as breath research [10].
The human breath contains indicators of human health and delivers information about different metabolism processes of the body [11]. Therefore, the first studies examined GC-IMS for its potential use for direct investigations of breath analysis especially concerning the possibility of being used in point-of-care testing at the patient's bedside. They demonstrate that GC-IMS is a powerful, rapid, non-invasive tool with a high potential in medical applications like diagnosis, therapy control, or medical status determination [12–18].
Further studies focused on the metabolic profiling of human breath to identify known VOCs like acetone, ammonia, ethanol, isobutanol, 2-methyl-1-propanol, and pentane [16, 19, 20]. In addition, GC-IMS has been gradually used to analyze exhaled air from patients with respiratory infections or lung cancer [21–23]. Many published papers involving GC-IMS in the field of breath gas analysis do not report the detected compounds but concentrate on separating the study groups based on a statistical analysis of unidentified peaks. Besides the fact that these studies can not be reproduced and the accuracy of the results cannot be proven they add no new and useful information to the field of breath research [24]. To better understand the detected breath VOCs and underlying metabolic pathways, the volatiles have to be identified, which is now facilitated using dual MS and IMS detection. Another medical application of GC-IMS was recently shown by Ruszkiewicz et al in 2020, employing it as a tool for diagnosing COVID-19 by human breath [25]. In nearly all applications, a GC system with an isothermally heated gas chromatographic column is used, which is advantageous for portable devices. However, sometimes a flow program helps to overcome its limitations, such as poor separation efficiency.
IMS has established itself in medical research, primarily in breath analysis, for many reasons: its sensitivity down the low ppbv range, especially in the air [26], or its selectivity in complex and humid mixtures [27]. In addition, the coupling of GC and IMS has the advantage that specific drift times for identifying the molecules are obtained in addition to the retention times. However, this identification is complicated as no commercial IMS spectral library is available.
The most common method to identify analytes through GC-IMS measurements is the comparison of retention and drift times of unknown peaks with those of reference standards [27]. However, this is costly and time-consuming, as all possible substances must be acquired and measured under comparable conditions. To overcome these limitations, IMS measurement results can be correlated with mass spectrometric results. By doing so, the substances in the complex three-dimensional IMS data sets can be identified, as far as possible, using extensive mass spectra libraries like the National Institute of Standards and Technology (NIST) database. In the past, several users have developed practical strategies for this purpose, which are presented below.
In a publication by Budzyńska et al [28], a conventional benchtop GC system was used offering the advantage that a temperature program can optimally separate the substances. The system is equipped with two columns, one connected to the MS and the other to the IMS; thus, the samples were injected twice. Retention indices of the analytes were used to correlate the results from a GC-IMS and a GC-MS to confirm the identification of a known set of substances with both detectors using reference standards. Unfortunately, the linear approximation was not entirely accurate, as demonstrated by the example of methyl eugenol.
Using a similar experimental setup, Augustini et al show a more precise strategy of correlating GC-IMS and GC-MS data by a retention index based on van den Dool and Dec Kratz indices [29]. Again, they could demonstrate for the measurement of an actual sample, in this case, a liquid for an electronic cigarette, that using their method, they were able to match the retention times with a deviation below 2%.
Nevertheless, both publications show the difficulty correlating retention times when two flow lines are used. Instead, they must make a workaround via linear correlation or indices. Unfortunately, this approach is time-consuming and not consistently very accurate.
The first attempt to build a dual system of GC with IMS and MS with one flow line where the eluent from the column is split and is directed in parallel to both detectors is shown by Brendel et al [30]. This dual-detection system is presented for analyzing VOCs in the quality control of brewing hop. After the GC column, a three-way Dean's switch plate is used to split on both detectors.
As in most work on GC-IMS in product and quality control, Brendel, Augustini, and Budzyńska used the headspace (HS) technique for sample preparation, which proved to be the most suitable in this application area. Furthermore, the HS technique is also helpful in medical applications such as measuring outgassing bacteria [31, 32]. However, if the human breath is to be analyzed, preconcentration with, for example, thermal desorption tubes (TD tubes) [33] or needle traps [34] only in combination with GC-MS is mandatory using suitable adsorber materials, and the analysis is carried out after appropriate TD steps.
For unambiguous identification of the IMS signals using MS spectral analysis, the study aimed to develop a benchtop TD-GC- dual IMS-MS system. This step is crucial to use the total capacity of a GC-IMS device as a mobile bedside analyzer. By using a single injection, parallel detection leads to a higher information density because users can employ both detection techniques to identify substances. This is particularly interesting for samples such as breath, as these are usually not present multiple times in the same composition. The system can also be used for other applications, such as for analyzing VOC emissions by nosocomial pathogens that cause pneumonia in humans.
2. Experimental
2.1. Chemicals and samples
Seven ketones, such as 2-butanone, 2-pentanone, 2-hexanone, 2-heptanone, 2-octanone, 2-nonanone, and 2-decanone purchased at Sigma–Aldrich (Taufkirchen, Germany) and all having a purity of at least 95%, were used as external standard compounds. Methanol was taken as the solvent and was purchased from Carl Roth (Karlsruhe, Germany) in sufficient purity (99.95%). The in-house generator supplied the nitrogen gas with a purity of at least 99.999%. Helium 5.0 (purity at least 99.999%) as carrier gas was purchased from Messer Industriegase (Siegen, Germany). Gases were filtered with a hydrocarbon trap (Supelpure HC from Supelco, Bellefonte, PA, USA) to increase their purity. For the liquid stock solution, the seven ketones listed above were dissolved in methanol, at a concentration of 0.01 g l−1 for each of the ketones. Pure chemicals and the stock solution were stored at 4 °C. The stock solution was prepared in methanol and renewed every four weeks or whenever contamination was detected.
2.2. Analysis conditions
The developed TD-GC-MS-IMS consists of five main components: a TD unit (TD-30 R, Shimadzu Corporation, Kyoto, Japan), a 4-Port-Splitter (SilFlow 4-Port-Splitter, Shimadzu Corporation, Kyoto, Japan), a GC with a single quadrupole MS (GCMS QP2020 NX, Shimadzu Corporation, Kyoto, Japan), and a drift tube IMS (G.A.S. mbH, Dortmund, Germany). A schematic overview of the setup is shown in figure 1. The following operating parameters of the TD-GC-MS-IMS method are summarized in the supplementary material (table S.1).

Figure 1. Schematic illustration of the new benchtop strategy TD-GC-MS-IMS: thermal desorption with cold trapping, gas chromatography and parallel detection on mass spectrometer and ion mobility spectrometer. The dual function is achieved by a 4-Port-Splitter with a pressure controller connected.
Download figure:
Standard image High-resolution imageAnalytes were adsorbed on TD tubes, with the procedure described in section 2.3. The samples prepared for analysis, as described in section 2.1, were analyzed in two steps according to TD conditions as follows. During the desorption process, the TD tubes were heated to 250 °C (50 °C min−1) with a helium flow rate of 60 ml min−1 to desorb the VOCs from the sorbent and to focus them onto the Tenax TA trap at −20 °C. Then, the focus trap was rapidly heated to 250 °C and temperature was maintained for 2 min. The analytes entered the GC system with carrier gas for analysis and a split ratio of 1:10. A Rxi-624Sil MS column (30 m × 0.25 mm × 1.4 μm, Restek GmbH Bad Homburg, Germany) was used in the GC operated with a constant pressure of 155 kPa and an initial column gas flow of 1.94 ml min−1 of helium. The oven program was as follows: 40 °C (5 min) → 5 °C min−1 → 150 °C → 10 °C min−1 → 230 °C (5 min) (total run time: 40 min).
Sample detection was performed by a single quadrupole MS and a drift tube IMS in parallel. To achieve parallel detection of MS and IMS, a 4-Port-Splitter was placed behind the GC column. The splitter is placed in the GC oven and, therefore, has a temperature according to the GC oven program. The connection allocation of the ports is displayed in figure 2.
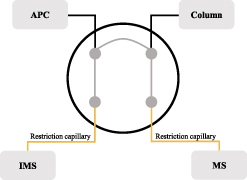
Figure 2. Port allocation at the 4-Port-Splitter with advanced pressure controller (APC), column, mass spectrometer, and ion mobility spectrometer. The restriction capillaries are shown in yellow.
Download figure:
Standard image High-resolution imageThe split ratio between the two detectors is determined by the pressure applied to the advanced pressure controller (APC, AFC-2030, Shimadzu Corporation, Kyoto, Japan) and by the length and inner diameter of the restriction capillaries. By adding helium as make-up gas, a defined pressure is built up by the APC. The restriction capillary to the IMS is 1.50 m with an inner diameter of 0.15 mm, and the capillary to the MS has a length of 0.60 m with an inner diameter of 0.10 mm. The determination of capillary dimensions was performed using the detector splitting creator software (Advanced Flow Technology software, Version 1.02, Shimadzu Corporation, Kyoto, Japan). This creates a split ratio of 1:1 at an APC pressure of 40 kPa. It should be mentioned that no pressure below 38 kPa should be selected in order to avoid a backflush and thus a contamination of the APC as 38 kPa represents the pressure inside of the splitter. At 40 kPa a low flowrate of 0.20 ml min−1 avoids any kind of dead volumne at the APC port. Heated transfer lines for MS and IMS were operated at 230 °C. IMS parameters were as follows: drift tube dimension was 15.2 mm × 53 mm, ionization by 3H-source, at 100 °C, a nitrogen drift gas flow rate of 150 ml min−1, and field strength of 500 V cm−1. Spectra were recorded in positive polarity mode with a duration of 21 ms per scan, an injection pulse width of 150 μs, and a blocking and injection voltage of 140 and 2500, respectively, which are both unitless software settings. To reduce data size, six single spectra were averaged, respectively. The MS was equipped with an EI source operated at 230 °C with 70 eV ionization energy scanning a mass range of m z−1 20–250.
2.3. Loading the sorbent tube
Liquid and breath samples were loaded onto deactivated glass sorbent tubes (Restek GmbH, Bad Homburg, Germany; 6.35 od, lenght 89 mm) filled with Tenax® TA (60/80 mesh). Prior to use, the tubes were conditioned with the TD CLEAN-CUBE (SiM GmbH, Oberhausen, Germany) under a nitrogen flow of 100 ml min−1 with a temperature program as follows: 40 °C (2 min) → 40 °C min−1 → 270 °C (60 min). For sample collection, a sophisticated device under controlled flow and temperature conditions was developed (flow- and temperature-controlled adsorption unit, FxT-AU). With the FxT-AU, loading both, liquid and gaseous samples, onto TD tubes is possible. The sample application of the liquid standards with the FxT-AU shown in figure 3 works as follows: The TD tube is inserted into a home-made aluminum heating block with the aid of a T-piece, which is heated to 40 °C using temperature sensors (PT100, B + B Thermo-Technik GmbH, Donaueschingen, Germany).
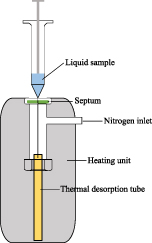
Figure 3. Schematic illustration of a part of the home-made heated injection system, flow- and temperature-controlled adsorption unit: application of liquid samples to thermal desorption tubes within a heating unit.
Download figure:
Standard image High-resolution image1 μl of stock solution was sampled with a 10 μl syringe (Shimadzu Corporation, Kyoto, Japan) and transferred directly to the adsorber material via the septum flushed with nitrogen (100 ml min−1). A mass flow control unit (smart controller GSC-A, Vögtlin Instruments GmbH, Muttenz, Switzerland) maintains a constant and properly adjusted flow through the system. With the nitrogen inlet and outlet, the solvent is blown off for 5 min. Tubes were closed with 1/4 in aluminum caps equipped with a Viton O-ring coated with PTFE (Shimadzu, Corporation, Kyoto, Japan) until analysis.
The breath sample was taken from one volunteer (self-experiment of one of the authors). For this purpose, an ALTEF gas sampling bag (Restek GmbH, Bad Homburg, Germany), was conditioned twice with nitrogen prior to breath sampling. The volunteer then delivered 1 l of exhaled air into the empty bag. This was done by blowing into the bag several times, skipping the first 5 s of breath (mixed expired). The filled gas bag was then connected to the TD tube, which was located in the FxT-AU at 40 °C. A vacuum pump (Microsart mini.vac, Sartorius Lab Instruments GmbH & Co. KG, Göttingen, Germany) was used to transfer all of the exhaled air onto the TD-Tube with a controlled flow rate of 60 ml min−1.
2.4. Data analysis
GC-IMS data was analyzed using the software VOCal Version 0.1.4 (G.A.S. mbH, Dortmund, Germany). Peak positions were determined in the 'Live Monitor' by picking the maximum of the selected peaks.
Total ion chromatograms (TIC), acquired by the mass spectrometer (MS), were analyzed using GCMSsolutions 4.52 from Shimadzu. The NIST/EPA/NIH Mass Spectral Library 14 from the NIST of the U.S. Department of Commerce was used for peak identification.
For the determination of reproducibilities, the ketone mixture at a concentration of 0.01 g l−1 was measured ten times, and the coefficient of variation (CV) was calculated. Therefore, the peak height (intensity) after baseline subtraction of each ketone was determined for the MS and the IMS analysis. For calculating the CV for each ketone in percent, the absolute standard deviation of the peak heights was divided by the mean value of the peak heights.
The peak height for each ketone in the MS and IMS TIC was determined for the APC pressure experiment at the splitter. Two measurements were made per pressure level (40, 50, 60, 70, 80, 90, and 100 kPa) used, and the mean value of the signal intensities of each ketone was determined. In addition, the absolute standard deviation of the signal intensities for each ketone was calculated from the duplicates.
The retention indices were calculated using the method proposed by van den Dool and Dec Kratz [35]. A detailed description of the calculation can be found in Augustini et al [29]. This is based on the retention times of the homologous series of n-alkanes (in our case, butane to tetradecane).
3. Results and discussion
3.1. TD-GC-MS-IMS performance
As a reference, a mixture of seven ketones (2-butanone, 2-pentanone, 2-hexanone, 2-heptanone, 2-octanone, 2-nonanone, and 2-decanone) in MS and IMS have been examined. The homologous series of ketones was chosen for calculating retention time indices in IMS [29] and are also used here as analytes for the system evaluation.
The measurement results from the GC-IMS are three-dimensional. The first dimension is given by the retention time of the GC, the second dimension is the drift time of the analyte ions detected by the IMS, and the third dimension is obtained from the intensity value of IMS data. Thus, data are typically presented in a topographic plot (here called GC-IMS chromatogram). However, like in figure 4, the topographic plot can be displayed in two dimensions. In this case the intensity is shown with a colored gradient from blue (low intensity) to red (high intensity).
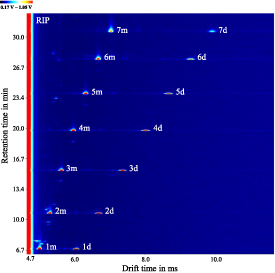
Figure 4. Zoom of the TD-GC-IMS chromatogram of a ketone mixture of (1) 2-butanone, (2) 2-pentanone, (3) 2-hexanone, (4) 2-heptanone, (5) 2-octanone, (6) 2-nonanone, and (7) 2-decanone at 0.01 g l−1 in methanol. Suffixes: monomers (-m) and dimers (-d). The reactant ion peak (RIP) is labeled.
Download figure:
Standard image High-resolution imageFigure 4 shows the TD-GC-IMS chromatogram of a ketone mixture with a concentration of 0.01 g l−1 per substance in methanol. Each number (1–7) represents one compound: (1) 2-butanone, (2) 2-pentanone, (3) 2-hexanone, (4) 2-heptanone, (5) 2-octanone, (6) 2-nonanone, and (7) 2-decanone. Monomers and dimers can be differentiated by the suffixes 'm' and 'd', respectively. The 'continuous' signal of the IMS at a drift time of td = 4.7 ms is the positive reaction ion peak (RIP) formed by the ionization of traces of water in the carrier and drift gas. In positive ion mode, the RIP consists mainly of stable protonated water clusters H+(H2O)n [6]. Detailed information of the retention and drift times are given later in table 2.
Temperature is a critical parameter affecting the adsorption capacity of an adsorbent [36]. Therefore, a sophisticated device for sample collection under controlled flow and temperature conditions was developed (FxT-AU, section 2.3, figure 3). With the FxT-AU, loading both, liquid and gaseous samples, onto TD tubes is possible. To test the reproducibility of sampling, the ketone mixture mentioned before (with a concentration of 0.01 g l−1 for each ketone) was adsorbed onto ten TD tubes using the FxT-AU unit and measured with the TD-GC-IMS-MS. Then, the signal intensities were determined. The calculated CV for the intensities of the seven ketones for MS and IMS measurements can be found in table 1. The coefficients of variation scope from 3.4% to 7.6% for the MS and from 2.2% to 5.3% for the IMS. Although the values for the MS are slightly higher than for the IMS, the sampling and subsequent measurement can be regarded as well reproducible.
Table 1. Overview of the CV calculated in the reproducibility experiment for the mass spectrometric and ion mobility spectrometric measurements individually for each ketone. A ketone mixture with a concentration of 0.01 g l−1 each was measured ten times for the experiment. The signal intensities were determined for each of the seven ketones, and the CVs were calculated.
| Coefficient of variation of the reproducibility experiment in % | ||
|---|---|---|
| Compound | MS | IMS |
| 2-butanone | 7.59 | 2.79 |
| 2-pentanone | 6.05 | 2.21 |
| 2-hexanone | 3.01 | 2.79 |
| 2-heptanone | 5.08 | 2.60 |
| 2-octanone | 4.20 | 3.33 |
| 2-nonanone | 3.39 | 3.80 |
| 2-decanone | 3.75 | 5.28 |
If the splitter is used as described in section 2.2 (MS:IMS splitting → 1:1 at 40 kPa), the eluent gas flow (helium) from the restriction capillaries is distributed equally among the detectors. To achieve maximum sensitivity on the mass spectrometric side, the eluent gas flow at the splitter can be shifted entirely towards the MS. If the pressure at the APC is increased (figure 2), the back pressure at the IMS rises, which means that the eluent gas stream with the analytes is directed from the column to the MS to a greater extent. At a defined pressure, the sample is completely directed to the MS. Thus, the IMS is discriminated. The pressure setting of the APC required for this must be determined experimentally.
Before this experiment, it was already known that a particular helium concentration in the ionization region of the IMS could generate plasma due to the high voltage applied. As a result, damage is caused to the ionization region [37]. According to the manufacturer's information, a flow of approx. 10 ml min−1 of helium is tolerable. Therefore, the first step was to determine the flow rate of helium in the IMS as a function of APC pressure. The results are shown in figure 5. At the minimum required pressure for operating the APC of 40 kPa, 0.2 ml per minute of helium flows into the IMS in addition to the carrier gas. For example, if the pressure is increased to 80 kPa, this flow rate goes up to 1.7 ml min−1. The system is operational at APC pressures from 40 kPa to 200 kPa since the total tolerable limit of up to 10 ml min−1 is not exceeded.
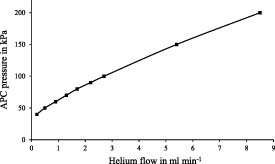
Figure 5. Additional helium flow in the IMS as a function of APC pressure.
Download figure:
Standard image High-resolution imageAfter establishing that the APC pressure can be maintained to a value of 200 kPa without risking damage to the IMS by igniting a plasma, the effect of APC pressure on signal intensities in the TIC in the MS and IMS was investigated. For the TIC of the GC-MS measurements, the retention times are plotted against the sum of the intensities of the entire range of masses in the spectra of the same scan. Similarly, in IMS, the retention time is plotted against the sum of the data points in the ion mobility spectrum in the range of 4.9 ms–11.0 ms without considering reactant ions. Therefore, the ketone mixture was measured at different APC pressures (40, 50, 60, 70, 80, 90, and 100 kPa). The results can be seen in figure 6, upper part for MS and lower part for IMS.
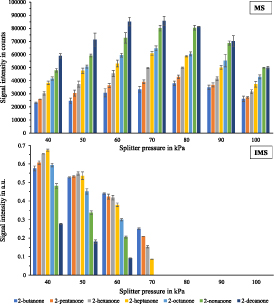
Figure 6. Signal intensities of the total ion chromatogram of seven ketones (2-butanone, 2-pentanone, 2-hexanone, 2-heptanone, 2-octanone, 2-nonanone, and 2-decanone, methanolic solution at 0.01 g l−1) at different pressure settings of the splitter. Upper part for MS and lower part for IMS.
Download figure:
Standard image High-resolution imageWith increasing APC pressure, the IMS signal decreases, and the signal intensities in the MS increase. By changing the APC pressure at the splitter from 40 kPa to 70 kPa, the MS signal intensities for the ketones increased by 44%–67%. Above a pressure of 70 kPa, the IMS is completely discriminated, and for none of the analytes, neither a monomer nor a dimer signal is obtained. If the APC pressure exceeds 80 kPa, a loss of signal intensity can be noted at the MS due to dilution effects, as a significant amount of the make-up gas helium is injected. Thus, between 70 kPa and 80 kPa, the highest MS signal intensity is achieved. It is also noteworthy that higher-chain ketones such as 2-nonanone and 2-decanone can be discriminated in the IMS at a lower APC pressure than short-chain ketones such as 2-butanone and 2-pentanone. The dilution effect has a proportionally stronger effect on the ketones with low volatility than those with higher volatility. It can be summarized that at a pressure of 80 kPa, the maximum sensitivity for very volatiles in the MS can be reached since the focus is mainly on substances found in breath. After showing the possibility of discrimination, the matching in retention time of the MS and IMS measurements is displayed. The TIC of MS and IMS of the ketone mixture at a concentration of 0.01 g l−1 and an applied APC pressure of 40 kPa (MS:IMS, 1:1) are displayed in figure 7, upper part, respectively lower part. Detailed information about the retention and drift times and the retention indices can be found in table 2.

Figure 7. Zoom of the total ion chromatogram of a ketone mixture of (1) 2-butanone, (2) 2-pentanone, (3) 2-hexanone, (4) 2-heptanone, (5) 2-octanone, (6) 2-nonanone, and (7) 2-decanone at 0.01 g l−1 in methanol and an applied spliter pressure of 40 kPa (MS:IMS, 1:1). The upper part for MS and the lower part for IMS.
Download figure:
Standard image High-resolution imageTable 2. Summary of the results for the analyzed ketone mixture measured with both MS and IMS of the presented TD-GC-MS-IMS, sorted by their retention time (tR), the retention time difference, the RIP rel. drift time for monomer (tD,m) and dimer peak (tD,d), and the retention indices for MS and IMS.
| Retention time in min | RIP rel. drift time in ms | Retention indices | |||||||
|---|---|---|---|---|---|---|---|---|---|
| No | Compound | CAS | MS, tR,MS | IMS, tR,IMS | Difference MS-IMS | tD,m | tD,d | MS | IMS |
| 1 | 2-butanone | 78-93-3 | 6.73 | 6.79 | 0.06 | 1.07 | 1.30 | 635 | 634 |
| 2 | 2-pentanone | 107-87-9 | 10.65 | 10.72 | 0.07 | 1.14 | 1.44 | 728 | 724 |
| 3 | 2-hexanone | 591-78-6 | 15.33 | 15.41 | 0.08 | 1.21 | 1.58 | 831 | 827 |
| 4 | 2-heptanone | 110-43-0 | 19.68 | 19.78 | 0.10 | 1.28 | 1.72 | 932 | 928 |
| 5 | 2-octanone | 111-13-7 | 23.70 | 23.81 | 0.11 | 1.35 | 1.86 | 1034 | 1028 |
| 6 | 2-nonanone | 821-55-6 | 27.42 | 27.58 | 0.16 | 1.43 | 2.00 | 1139 | 1135 |
| 7 | 2-decanone | 693-54-9 | 30.35 | 30.59 | 0.24 | 1.51 | 2.14 | 1241 | 1227 |
When comparing the chromatograms of the ketone analysis from MS and IMS, the retention times of the seven ketones almost coincide, but there are some characteristics. However, the absolute difference in retention times between MS and IMS increases with increasing chain length of the ketones. This is due to a weakness in the design of the sample gas inlet tube of the IMS detector. The sample is transferred to the IMS via a transfer line from the gas chromatographic column. Still, before the entrance of the detector, there is a short unheated piece of tubing with an effect comparable to a so-called cold trap. This also explains the peak broadening of peaks 6 and 7 in the TIC of the IMS in figure 7. Since this does not affect the objective of the topic presented here, it will be considered later.
Higher-chain ketones are retained more strongly, so the absolute difference in the retention time deviation increases. In the range of very volatiles, which is essential for breath gas analysis a very high agreement of the retention times is achieved so that a reliable identification via the correlation is possible. As expected, the retention indices calculated according to van den Dool and Dec. Kratz method also match between MS and IMS. The results obtained here can be related to the coupling system HS GC-MS-IMS by Brendel et al [30] using a dean switch. The comparison of the retention times from MS and IMS for common terpenes and terpene alcohols shows deviations between 0.05 min and 0.26 min in a retention time window of 13 min. The solution presented here, which is more affordable compared to Brendel et al, thus shows the same good performance, but even a retention time range of up to 30 min can be covered very well without any significant differences. For higher retention time shifts, retention indices, according to Augustini et al [29], can be used. This method uses the 2-alkanones as retention time markers to normalize the differing retention times of the GC-IMS and GC-MS so that they can be compared, and the chromatograms can be converted to the same timescale. However, as this method uses 2-alkanones as retention time markers, only the time range covered by these markers (2-butanone to 2-decanone) is available for the correlation. Therefore, substances were tentatively identified using the correlated mass spectra. When available, reference substances were used to confirm the identification, comparing the retention and drift times from the GC-IMS.
In summary, this section showed that using a simple 4-Port-Splitter, an MS and IMS detector can be operated in parallel after a gas chromatographic separation. This has the advantage that the MS databases can be used to identify unknown IMS signals due to the retention time correlation. Furthermore, to decrease the limit of detection of the MS, the IMS can be discriminated against if necessary.
3.2. Application example—breath analysis
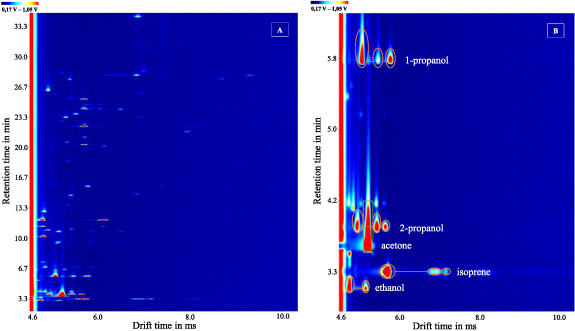
To show a first application of the developed TD-GC-MS-IMS in the field of breath analysis, the author has used his own exhaled air. 1 l of breath collected in a Tedlar Bag was transferred to a TD tube at 60 ml min−1. Figure 8, Part A shows the TD-GC-IMS chromatogram of the collected breath. Especially in the early retention time range (3.0–13.5 min) many signals can be detected. Part B shows a zoomed section of the retention time range from 2.9 to 6.3 min. In this, the first five substances are identified by means of the correlation with the MS measurement and the use of the NIST database as explained in the previous section, thus they are allocated to be ethanol, isoprene, acetone, 2-propanol, and 1-propanol. Additionally, all substances identified via the MS database in the IMS measurements were confirmed by reference substances. Retention and drift times are assigned in table 3.
Figure 8. Part (A) shows a zoom of the TD-GC-IMS chromatogram of a humans breath measurement. Part (B) shows a zoomed section of the retention time range from 2.9 to 6.3 min of the breath analysis. A total of five substances were identified via the mass spectrometric measurement performed in parallel: ethanol, isoprene, acetone, 2-propanol, and 1-propanol.
Download figure:
Standard image High-resolution image
Table 3. Summary of the five compounds found in a breath sample for the TD-GC-MS-IMS measurement in the first 7 min sorted by their MS and IMS retention time (tR), and the RIP rel. drift time for monomer (tD,m) and dimer peak (tD,d).
| Retention time in min | RIP rel. drift time in ms | |||
|---|---|---|---|---|
| Compound | MS, tR,MS | IMS, tR,IMS | tD,m | tD,d |
| ethanol | 3.08 | 3.12 | 1.05 | 1.14 |
| isoprene | 3.28 | 3.34 | 1.25 | — |
| acetone | 3.59 | 3.65 | — | 1.14 |
| 2-propanol | 3.80 | 3.82 | 1.10 | 1.25 |
| 1-propanol | 5.76 | 5.80 | 1.12 | 1.28 |
a Isoprene shows a main peak and other adduct peaks next to it. Only the main peak is concerned here. b Monomer peak of acetone is positioned in the RIP.
The mentioned compounds are well known for their presence in human breath [38]. Acetone, for example, is used as a marker substance in human breath which can be found in elevated concentrations in patients with type 1 diabetes. The monitoring of acetone can be seen as an opportunity to diagnose this disease non-invasively [39]. Isoprene is one of the most studied volatile compound in respiratory research, not only because it is the primary endogenous hydrocarbon found in exhaled human breath but also because of its potential use as a noninvasive marker for studying various metabolic processes in the body. Its origin was uncertain until now, but Sukul et al [40] have discovered the actual origin of human exhaled isoprene by multi-omic analysis of genes and metabolites. Exhaled 2-propanol in human breath reflects health conditions: There is a relationship with 2-propanol blood concentration and diabetes, so a link of its concentration in the breath can also be suspected [41].
4. Conclusion
IMS is an emerging analytical technique, even finding its application in the medical field. Since no valid substance database exists for IMS, substance identification in non-target approaches is difficult. The presented work aimed to build a new coupling technique consisting of a TD gas chromatograph coupled to a mass and IMS in parallel.
While mass spectrometry is a well-established laboratory method in this field of application, IMS is still a new but mobile technique, which has distinguished itself in the past by enabling measurements directly at the patient's bedside. In addition, the IMS is characterized by particularly low detection limits in the lower ppbv range.
The new coupling technique parallels retention times of MS and IMS operating a simple splitter. This was successfully achieved in a retention time range of up to 30 min, with deviations of 0.06 min–0.24 min. The substances detected by IMS can be identified using the MS and the database available for this purpose.
The distribution of column eluate between the two detectors leads to a reduction in the MS detection limits. Therefore, the effect of IMS discrimination was considered to increase such sensitivity. By changing the APC pressure at the splitter from 40 kPa to 70 kPa, the MS signal intensities for the analytes considered (homologous series of ketones) could be increased by 44%–67%.
Another objective of the presented work was setting up a suitable sample preparation unit for the adsorption of VOCs from standard solutions and directly from the breath onto TD tubes, as well. For this purpose, a temperature- and flow-controlled heating block was established, whereby the sampling can occur both in gaseous and liquid form.
Breath samples are usually not present multiple times in the same composition. Therefore, high reproducibility of the measurement result is of great importance, which could be shown with the entire method, consisting of the sampling method and analysis system.
Finally, breath analysis as exemplary application was investigated. The substances ethanol, isoprene, acetone, 2-propanol, and 1-propanol could be identified based on the retention time match of the MS and IMS signals and using the NIST database. The main advantage of the system presented here: the detected analytes can be identified by the characteristic mass spectrum and a specific IMS drift time.
It is pointed out that the new coupling system TD-GC-MS-IMS can also be used for other applications, for example, in the environmental field or hazard protection.
Acknowledgments
The authors gratefully acknowledge funding from the Federal Ministry of Education and Research (BMBF) under Grant No. 13GW0428C (InosIn). The authors would like to sincerely thank Selina Gaar for her great support in the laboratory. The authors would like to thank the members of the technical workshop and the participating scientific staff of the Hamm-Lippstadt University of Applied Sciences (located in Hamm), for their support in setting up the sampling. The authors acknowledge Daniel Sanders from G.A.S mbH for his support and discussions on data analysis and software tools. In addition, many thanks belong to Volker Hartmann, who provided technical support in establishing the coupling technique.
Data availability statement
All data that support the findings of this study are included within the article (and any supplementary files).
Ethical statement
The research was conducted in accordance with the principles embodied in the Declaration of Helsinki and in accordance with local statutory requirements. Since the paper involves only a self-experiment of one of the authors, as an example, there is no need for ethical approval. No other participants or personal data of volunteers/patients are involved at this stage. I state that all participants gave written informed consent to participate in the study.
Supplementary data (<0.1 MB PDF)