
Abstract
The presence of certain volatile organic compounds (VOCs) in the breath of patients with gastric cancer has been reported by a number of research groups; however, the source of these compounds remains controversial. Comparison of VOCs emitted from gastric cancer tissue to those emitted from non-cancerous tissue would help in understanding which of the VOCs are associated with gastric cancer and provide a deeper knowledge on their generation. Gas chromatography with mass spectrometric detection (GC-MS) coupled with head-space needle trap extraction (HS-NTE) as the pre-concentration technique, was used to identify and quantify VOCs released by gastric cancer and non-cancerous tissue samples collected from 41 patients during surgery. Excluding contaminants, a total of 32 VOCs were liberated by the tissue samples. The emission of four of them (carbon disulfide, pyridine, 3-methyl-2-butanone and 2-pentanone) was significantly higher from cancer tissue, whereas three compounds (isoprene, γ-butyrolactone and dimethyl sulfide) were in greater concentration from the non-cancerous tissues (Wilcoxon signed-rank test, p < 0.05). Furthermore, the levels of three VOCs (2-methyl-1-propene, 2-propenenitrile and pyrrole) were correlated with the occurrence of H. pylori; and four compounds (acetonitrile, pyridine, toluene and 3-methylpyridine) were associated with tobacco smoking. Ex vivo analysis of VOCs emitted by human tissue samples provides a unique opportunity to identify chemical patterns associated with a cancerous state and can be considered as a complementary source of information on volatile biomarkers found in breath, blood or urine.
Export citation and abstract BibTeX RIS

Original content from this work may be used under the terms of the Creative Commons Attribution 3.0 licence. Any further distribution of this work must maintain attribution to the author(s) and the title of the work, journal citation and DOI.
1. Introduction
Volatile organic compounds (VOCs) released by the human organism mirror normal physiological processes as well as pathological disorders; they, therefore, have great potential for medical diagnosis and therapy monitoring. Breath analysis holds a distinguished status in this context, as it is non-invasive and some breath constituents have already been linked to particular disease processes, including cancer [1, 2]. Despite this huge potential, the use of these patterns within a clinical setting remains rather limited. The main unresolved issue is the poor understanding of the sources, behavior and metabolic fate of VOCs in the human organism. A number of recent studies provided evidence that comparing volatile fingerprints from different sources yields complementary information with regard to the human volatolome [1, 2]. Thus, the involvement of different bodily fluids (e.g. breath, urine, blood, and saliva), and cell lines or tissues, can considerably improve the identification of volatile markers of disease, thereby aiding in the development of diagnostic tests based on VOC analysis. Interestingly, the tissue approach has received limited attention, although it offers direct access to the cancer and its effect on volatile emissions from cells [3–5].
VOCs are very attractive for the purpose of cancer screening, e.g. for finding a group of subjects with an increased risk for developing cancer, or are at an early-stage of cancer, compared with healthy individuals in the general population. But a test to be used for screening should be sensitive, convenient for the target group, easy to use and of low cost. VOC testing in exhaled breath could satisfy all these requirements, Here, we present information towards developing such a method to detect gastric cancer, which is a global healthcare problem [6].
Attempts to identify volatile markers of gastric cancer have already received some attention. Kumar et al [7] investigated the head-space of the gastric content within a human stomach using selected ion flow tube mass spectrometry (SIFT-MS); they identified seven VOCs: acetone, formaldehyde, acetaldehyde, hexanoic acid, hydrogen sulfide, hydrogen cyanide and methyl phenol, all of which had statistically significant differences in their concentrations between cancer patients (19) and healthy (11) volunteers. Kumar et al [8] also assessed the potential of using VOCs in exhaled breath to identify esophageal and gastric adenocarcinoma. In this report, a set of 12 compounds (pentanoic acid, hexanoic acid, phenol, methyl phenol, ethyl phenol, butanal, pentanal, hexanal, heptanal, octanal, nonanal, and decanal) had significantly higher concentrations (p < 0.05) in the cancer groups than the non-cancer controls. Xu et al [9] used GC-MS and found that five VOCs (2-propenenitrile, 2-butoxy-ethanol, furfural, 6-methyl-5-hepten-2-one and isoprene) were significantly elevated in the breath of patients with gastric cancer and/or peptic ulcer compared with less severe gastric conditions. They also demonstrated that VOC-based breath-prints detected by nanomaterial-based sensors could be used for identification of gastric cancer, distinguishing them from benign stomach ulcers and less severe stomach conditions. In a follow-up study [10], eight breath VOCs (2-propenenitrile, furfural, 2-butoxy-ethanol, hexadecane, 4-methyloctane, 1,2,3-tri-methylbenzene, α-methyl-styrene and 2-butanone) differed in a statistically significant manner between gastric cancer and control groups. Nakhleh et al [11] has now shown that an artificially intelligent nanoarray based on molecularly modified nanomaterials can detect and discriminate between 17 different disease conditions, including gastric cancer, from exhaled breath. Buszewski et al [3] investigated VOCs released by gastric cancer and normal tissues and found that the levels of 1-propanol and CS2 were higher in the head-space of the cancer tissue compared to the normal one. It must be stressed, however, that the number of patients involved in their study was very small (n = 5).
The primary goal of our work is the identification of VOCs released by gastric cancer and non-cancerous tissue to determine species being expressed in different concentrations in order to provide an alternative source of information on gastric cancer-related biomarkers and their sources. For this purpose, an experimental setup combining head-space needle trap extraction (HS-NTE) and gas chromatography-mass spectrometry (GC-MS) was applied.
2. Experimental
2.1. Human subject and sampling
A cohort of 41 patients, 24 males and 17 females, between the ages of 34 and 78 (median age 64 years), diagnosed with gastric cancer was recruited, all of whom were scheduled for elective gastric surgery. The patient group had different clinical stages ranging from stage Ia to stage IV (one stage Ia, six stage Ib, two stage IIa, 15 stage IIb, four stage IIIa, six stage IIIb, five stage IIIc and two stage IV). Seventeen were confirmed smokers (or had been smoking prior to diagnosis), whereas the others were non-smokers. Thirty patients were confirmed as H. pylori positive, nine were H. pylori negative, and in two cases their H. pylori status was not evaluated.
Tissue samples were taken during gastric surgery; cancerous tissue as well as normal tissue without malignant infiltration were resected from each patient. The healthy and malignant tissues were evaluated by gross examination, followed by histological processing and staining with haematoxylin-eosin. For poorly differentiated cancers, the immuno-histochemistry for (CKAE1/AE3) was used. Approximately 100 mg of each tissue were provided for the measurements. These samples were snap-frozen in liquid nitrogen and placed in a −86 °C freezer for storage, as proposed by Bojko et al [12], with a maximal storage time of 3 months. Transportation was in the frozen state with samples kept on dry-ice. Detailed clinical characteristics of the patients are presented in table 1.
Table 1. Clinical characteristic of patients.
| GC clinical stage | ||||||||
|---|---|---|---|---|---|---|---|---|
| n | Age Range (median) | I | II | III | IV | H. pylori positivity | Smoking | |
| Males | 24 | 44–76 (64) | 2 | 13 | 7 | 2 | 15 | 13 |
| Females | 17 | 34–78 (66) | 5 | 4 | 8 | 0 | 15 | 4 |
| Total | 41 | 34–78 (64) | 7 | 17 | 15 | 2 | 30 | 17 |
2.2. Materials and calibration mixtures
Multi-compound external standards were prepared from high-purity liquid or gaseous substances. The majority were purchased from Sigma-Aldrich (USA); acetonitrile (99.8%), n-propanal (97%), carbon disulfide (99.9%), dimethyl sulfide (99%), 2-propenenitrile (99%), isoprene (99%), n-pentane (99.8%), 2-butanone (99.5%), ethyl acetate (99.9%), n-hexane (99%), benzene (99.8%), 3-methyl-2-butanone (98.5%), 2-pentanone (99%), pyridine (99.8%), 1-methyl-pyrrole (99%), n-heptane (99%), toluene (99.8%), furfural (98%), n-octane (99%), p-xylene (99%), and D-limonene (99%). Benzonitrile (99%) was obtained from Fluka (Switzerland).
Preparation of the gaseous calibration mixtures was dependent on a compound's volatility and solubility in water. A detailed description of the preparation of gaseous calibration mixtures has been given elsewhere [13], and therefore only a brief outline of the procedure will be given here. Gaseous mixtures of less volatile and highly water soluble species were produced using a GasLab calibration mixtures generator (Breitfuss Messtechnik, Germany). The device generates gas mixtures at predefined humidity levels by the evaporation of liquid substances. The available concentration levels range from dozens of ppb up to 100 ppm of each solute. However, for this study, pure substances were additionally diluted at ratios of 1:2000–1:3000 to achieve lower concentration levels. Effectively, gas mixtures with VOCs volume fractions ranging from 10 ppt to 50 ppb were used for calibration and validation. Alternatively, in the case of poorly water soluble and more volatile compounds (e.g. hydrocarbons), multi-compound gaseous standards were prepared by injecting and evaporating a few microliters of liquid or gaseous analyte into evacuated glass bulbs (Supelco, Canada). The desired calibration levels were achieved by transferring appropriate volumes of the bulb standard into Tedlar bags (SKC Inc., USA) filled with predefined amounts of humidified zero air, the latter being produced by the GasLab generator. Calibration curves were obtained on the basis of 2-fold analyses of five distinct and independent concentration levels.
2.3. Sample preparation and HS-NTE procedure
Volatiles released by tissue samples were pre-concentrated using head-space needle trap extraction (HS-NTE) [13–15]. Two-bed 23-gauge Silcosteel-treated stainless steel needle trap devices (NTD) (2 cm Carbopack X and 1 cm Carboxen 1000, both 60/80 mesh, PAS Technology, Germany) were used to trap the VOCs released by the tissue samples. Prior to this, all NTDs were pre-conditioned at 290 °C by flushing them with a high-purity nitrogen flow (6.0%–99.9999%) for 10–15 min. Shortly before analysis, 100 mg (±10%) of a frozen tissue sample were transferred to a headspace vial (2 ml, Gerstel, Germany), which was then rinsed with high purity air (∼10 ml at 30–40 ml × min−1) and closed with a silicone septum. Prior to extraction, the tissue sample was thawed to 37 °C for 30 min. There was also an intention at this phase to promote the emission of VOCs into the vial head space. NTD trapping of the head space constituents was accomplished dynamically by inserting the NTD into a vial via a septum and drawing 100 ml head space gas at a steady flow rate of 2 ml min−1 at 37 °C, using a mass flow controller (Bronkhorst, Netherlands). To maintain a constant pressure, high purity zero air was continuously introduced into the vial through an additional needle at a flow equal to the sampling flow. Following extraction, the NTD was introduced into the inlet of the gas chromatograph, where the compounds of interest were thermally desorbed at 290 °C in a splitless mode (1 min). In parallel with each pair of tissue samples, one blank sample containing nitrogen was analyzed using the same protocol so as to identify possible contaminants stemming from sources other than the tissues. The resulting concentration levels were subtracted (where applicable) from the respective values in the associated tissue samples. Samples were analyzed in three batches on a daily randomized regime.
2.4. Chromatographic analysis
Chromatographic analyses involved an Agilent 7890A/5975C GC-MS system (Agilent, USA). During desorption, the inlet operated in the splitless mode (1 min), followed by a split mode using a ratio of 1:50. Volatiles were separated using an Rt-Q-BOND column (30 m × 0.25 mm, film thickness 8 μm, 100% divinylbenzene phase, Restek, USA) working in a constant flow of helium at 1 ml min−1. The column temperature program was as follows: 40 °C for 1 min, increased at a rate of 5 °C min−1 to 210 °C, a constant temperature of 210 °C for 4 min, increased at a rate of 3 °C min−1 to 260 °C, and a constant temperature of 260 °C for 14 min. The mass spectrometer worked in a synchronous SCAN/SIM mode (see Wallace et al [16] for a detailed discussion of this approach) with an effective scan rate of 2.67 scans s−1. The SCAN, with an associated range set from m/z 20 to m/z 200, was used for the untargeted analysis and identification of compounds being emitted by tissue samples, as well as for quantification of the more abundant species. Peak integration was based on extracted ion chromatograms. The substance specific m/z ratios selected for this purpose allowed for a proper separation of compounds from their neighboring peaks in numerous cases, even when the latter were overlapping in the total ion count chromatogram. The applied SCAN quantifier ions are given in table 2. Selected less abundant species were quantified using SIM (selective ion monitoring mode), with the corresponding m/z values and dwell times being given in table 2. The quadrupole, ion source and transfer line temperatures were kept at 150 °C, 230 °C and 280 °C, respectively. The electron impact energy was 70 eV.
Table 2. Retention times Rt [min], quantifier ions, SIM dwell times [μs], LODs [pmol], RSDs (%), coefficients of variation (R2) and linear ranges [pmol] of compounds under study. Compounds in italics were not quantified for reasons mentioned in the text. Compounds are ordered with respect to increasing retention time.
| VOC | CAS | Rt [min] | Quantifier ion (SIM dwell time [μs]) | LOD [pmol] | RSD [%] | R2 | Linear Range [pmol] |
|---|---|---|---|---|---|---|---|
| Acetaldehyde | 75-07-0 | 11.52 | 44 | — | 20 | — | — |
| Methanethiol | 74-93-1 | 12.64 | 47 | — | 25 | — | — |
| 1-Propene, 2-methyl- | 115-11-7 | 14.94 | 41 | — | 6 | — | — |
| Acetonitrile | 75-05-8 | 16.83 | 41 (80) | 1.23 | 15 | 0.913 | 3.7–46 |
| n-Propanal | 123-38-6 | 18.95 | 58 | 0.04 | 16 | 0.998 | 0.1–15 |
| Carbon disulfide | 75-15-0 | 19.65 | 76 | 0.06 | 18 | 0.999 | 0.2–38 |
| Dimethyl sulfide | 75-18-3 | 19.89 | 62 (40) | 0.01 | 13 | 0.994 | 0.03–8.5 |
| 2-Propenenitrile | 107-13-1 | 20.21 | 53 (80) | 0.04 | 20 | 0.989 | 0.11–10 |
| Isoprene | 78-79-5 | 22.11 | 67 (80) | 0.02 | 14 | 0.989 | 0.06–10 |
| n-Pentane | 109-66-0 | 22.48 | 72 (40) | 0.3 | 10 | 0.990 | 0.9–23 |
| 2-Butanone | 78-93-3 | 25.48 | 72 (80) | 0.35 | 8 | 0.970 | 1–100 |
| Ethyl Acetate | 141-78-6 | 26.35 | 43 (80) | 0.08 | 20 | 0.955 | 0.23–40 |
| n-Hexane | 110-54-3 | 28.30 | 43 (80) | 0.05 | 12 | 0.986 | 0.15–20 |
| Benzene | 71-43-2 | 28.40 | 78 | 0.06 | 10 | 0.974 | 0.19–9 |
| 2-Butanone, 3-methyl- | 563-80-4 | 29.69 | 43 (80) | 0.05 | 17 | 0.996 | 0.15–10.5 |
| 2-Pentanone | 107-87-9 | 30.68 | 43 (80) | 0.06 | 7 | 0.981 | 0.19–35 |
| Pyrrole | 109-97-7 | 30.78 | 67 | — | 20 | — | — |
| Acetamide | 60-35-5 | 31.11 | 59 | — | 30 | — | — |
| Pyridine | 110-86-1 | 31.30 | 79 | 0.12 | 16 | 0.982 | 0.35–150 |
| Pyrrole, 1-methyl- | 96-54-8 | 31.36 | 81 | 0.06 | 20 | 0.971 | 0.18–8.6 |
| n-Heptane | 142-82-5 | 33.23 | 71 (80) | 0.12 | 13 | 0.975 | 0.36–12.6 |
| Acetamide, N,N-dimethyl- | 127-19-5 | 33.70 | 43 | — | 20 | — | — |
| Toluene | 108-88-3 | 33.93 | 91 | 0.17 | 20 | 0.993 | 0.5–11 |
| Furfural | 98-01-1 | 34.68 | 96 (80) | 0.17 | 12 | 0.971 | 0.5–10 |
| Pyridine, 3-methyl- | 108-99-6 | 37.17 | 93 | — | 20 | — | — |
| γ-Butyrolactone | 96-48-0 | 37.29 | 42 | — | 27 | — | — |
| n-Octane | 111-65-9 | 38.27 | 43 (80) | 0.05 | 12 | 0.986 | 0.15–20 |
| p-Xylene | 106-42-3 | 39.58 | 91 | 0.1 | 14 | 0.991 | 0.3–11 |
| Benzonitrile | 100-47-0 | 44.38 | 103 | 0.27 | 15 | 0.986 | 0.8–20 |
| D-Limonene | 5989-27-5 | 50.82 | 93 | 0.29 | 18 | 0.993 | 0.9–5 |
| Benzamide | 55-21-0 | 65.56 | 121 | — | 30 | — | — |
Identification of compounds was performed in two steps. Firstly, the peak spectrum was checked against the NIST mass spectral library. Next, the NIST identification was confirmed by comparing the respective retention times with retention times obtained on the basis of standard mixtures prepared from pure compounds. Whenever possible VOC emissions were quantified using calibration mixtures prepared from pure liquid or gaseous substances as outlined above.
3. Results and discussion
3.1. Method validation
The calculated validation parameters are given in table 2. Limits of detection (LOD) were calculated using the algorithm described by Huber [17], and the standard deviation of five consecutive blank signals. The LOD ranged from 0.01 to 1.23 pmol. The limit of quantification (LOQ) was defined as 3 × LOD. Relative standard deviations (RSDs) were calculated on the basis of consecutive analyses of five tissue samples obtained from the same patient. The calculated RSDs varied from 6 to 30%, considered acceptable for the purpose of this study. It should be stressed that this parameter is affected by the small size of the samples available for the extraction, and by differences in sample shape. The system's response was linear within the investigated concentration ranges (table 2), with coefficients of determination ranging from 0.913 to 0.999. VOCs emission from frozen non-cancerous tissue samples stored over the period of 6 weeks was within the RSDs reported in table 2.
3.2. Emission of VOCs from gastric tissues
Representative chromatograms from cancer and normal tissues HS-NTE-GCMS analysis are presented in figure 1. A total number of 45 compounds were found in the headspace of the tissue samples. Excluding hospital environment related species and their metabolites (e.g. methanol, ethanol, 2-propanol, sevoflurane, and hexafluoroisopropanol), and compounds with an incidence of <20% across all samples, 32 VOCs were detected in the headspace of both cancer and normal tissues. Their associated detection and quantification incidences, as well as their masses emitted into the sample head-space over the course of the experiment (pmols), are given in table 3. In the case of uncalibrated species, ranges and medians of peak areas are given in table 3. It should be noted that the presence of VOCs was correlated by the subjects, which is unsurprising as both samples in each pair stem from the same individual and share the same exposure to, e.g. environmental, dietary, or treatment-related VOCs. The predominant chemical classes were hydrocarbons (6) and heterocyclics (5) species. Apart from them, there were four ketones, three volatile sulphur compounds (VSCs), three nitriles, three amides, three aromatics, three aldehydes, one ester and one terpene. Eleven compounds (acetaldehyde, methanethiol, acetone, carbon disulfide, isoprene, 2-butanone, 2-pentanone, pyrrole, pyridine, furfural, and n-octane) were emitted from all tissue samples. The concentrations of 22 species (69%) from the tissues were quantified using the aforementioned procedures. The remaining compounds could not be quantified properly, either due to the unavailability of pure substances, or due to problems related to the preparation of reliable reference mixtures. Although it was detected in the head space of all tissue samples, acetone was not quantified as its signal exceeded the dynamic range of the MS detector. The observed concentrations (medians) ranged from 0.17 pmol for 2-propenenitrile to 38 pmol for 2-butanone. However, half of all quantified species had emissions of <1 pmol. The highest median levels were noted for 2-butanone (38 pmol and 34 pmol for cancer and normal tissues, respectively) and carbon disulfide (19.9 pmol for cancer tissue). A Wilcoxon signed rank test was used to compare the emissions of VOCs from cancer and non-cancerous tissues, and p < 0.05 taken as significant. For uncalibrated VOCs, the Wilcoxon test was run on peak areas. The headspace concentrations of four species (carbon disulfide, pyridine, 3-methyl-2-butanone and 2-pentanone) were ignificantly higher from cancer tissues, whereas three volatiles (isoprene, γ-butyrolactone and dimethyl sulphide) were at higher concentrations for non-cancerous tissues (see supplementary materials at stacks.iop.org/JBR/12/046005/mmedia for the QQ-plots and summary statistics as recommended by Pleil [18]). Moreover, an ANOVA test was run on non-cancerous tissue samples to recognize smoking-related and H. pylori-related species (p < 0.05). The levels of three VOCs (2-methyl-1-propene, 2-propenenitrile and pyrrole) correlated well with the occurrence of H. pylori. Interestingly, 2-methyl-1-propene was also found in the head space of H. pylori cultures [19]. Furthermore, four compounds (acetonitrile, pyridine, toluene and 3-methylpyridine) were associated with tobacco smoking.
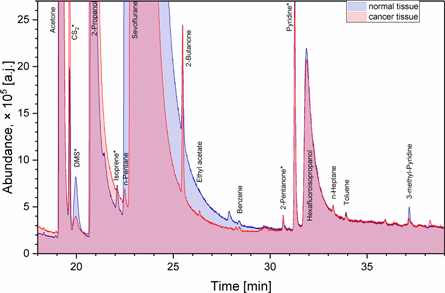
Figure 1. A fragment of overlay of exemplary chromatograms from HS-NTE-GCMS analysis of cancer and normal tissues obtained from the same patient. Compounds exhibiting significant differences in emission from investigated tissues are marked with an asterisk.
Download figure:
Standard image High-resolution image
Table 3. Detection (nd) and quantification (nq) incidences of the compounds under study, their emission ranges [pmol] and the outcome of a Wilcoxon signed rank and ANOVA tests. n.s.– not significant. For uncalibrated species (in italics) ranges and medians of peak areas are provided. Limits of detection for uncalibrated VOCs is defined as the standard deviation of five consecutive blank signals areas multiplied by a coverage factor of 2.34 [17].
| VOC | Cancer tissue | Normal tissue | ||||||
|---|---|---|---|---|---|---|---|---|
| nd(nq) | Range (Median) [pmol]/[-] | nd(nq) | Range (Median) [pmol]/[-] | p-value Wilcoxon test | p-value ANOVA Smoking | p-value ANOVA H. pylori | Tentative origin in humans | |
| Acetaldehyde | 41(41) | 515–4200 (1130) | 41(41) | 360–12500 (1200) | n.s. | n.s. | n.s. | |
| Methanethiol | 41(41) | 4–470 (33) | 41(41) | 6.6–250 (32) | n.s. | n.s. | n.s. | |
| 1-Propene, 2-methyl- | 41(41) | 10–2060 (27) | 40(40) | 11–3250 (31) | n.s. | n.s. | 0.029 |
|
| Acetonitrile | 30(30) | 3.7–110(7.2) | 41(34) | 3.7–78.7(6.9) | n.s. | 5.9 × 10⁻⁷ | n.s. |
|
| n-Propanal | 40(40) | 0.8–16.6(2.2) | 39(39) | 0.9–8.3(2.6) | n.s. | n.s. | n.s. |
|
| Acetone | 41(41) | n.q. | 41(41) | n.q. | — | — | — | |
| Carbon disulfide | 41(41) | 0.7–260(17.2) | 41(41) | 0.5–68(4.2) | 1.7 × 10⁻³ | n.s. | n.s. | |
| Dimethyl sulfide | 39(39) | 0.05–8.0(0.66) | 39(39) | 0.2–8.0(0.88) | 0.0223 | n.s. | n.s. |
|
| 2-Propenenitrile | 41(20) | 0.11–1.8(0.3) | 39(18) | 0.11–1.5(0.17) | n.s. | n.s. | 0.041 |
|
| Isoprene | 41(41) | 0.22–15.7(1.3) | 41(41) | 0.64–15.7(2.1) | 6.9 × 10⁻⁴ | n.s. | n.s. | |
| n-Pentane | 40(36) | 1.0–57(2.5) | 41(34) | 0.9–10.6(2.3) | n.s. | n.s. | n.s. | |
| 2-Butanone | 41(41) | 5.5–246(38) | 41(41) | 6.9–150(32) | n.s. | n.s. | n.s. | |
| Ethyl Acetate | 40(40) | 0.3–13.5(1.5) | 40(37) | 0.4–167(2.2) | n.s. | n.s. | n.s. |
|
| n-Hexane | 29(21) | 0.16–34.5(0.68) | 32(30) | 0.16–4.4(0.46) | n.s. | n.s. | n.s. |
|
| Benzene | 41(35) | 0.21–2.1(0.43) | 37(37) | 0.22–2.0(0.55) | n.s. | n.s. | n.s. | |
| 2-Butanone, 3-methyl- | 41(40) | 0.15–5.5(0.62) | 40(37) | 0.15–2.4(0.53) | 5.3 × 10⁻⁴ | n.s. | n.s. | |
| 2-Pentanone | 41(41) | 0.4–62(1.7) | 41(41) | 0.51–5.9(1.4) | 7.0 × 10⁻³ | n.s. | n.s. | |
| Pyrrole | 41(41) | 10.6–242(27) | 41(41) | 10.3–229(24) | n.s. | n.s. | 0.012 | |
| Acetamide | 34(34) | 17–1740(66) | 32(32) | 20.5–696(66) | n.s. | n.s. | n.s. |
|
| Pyridine | 41(41) | 0.62–685(7.7) | 41(41) | 0.58–135(3.0) | 1.7 × 10⁻⁴ | 1.8 × 10⁻³ | n.s. |
|
| Pyrrole, 1-methyl- | 12(9) | 0.74–5.0(1.5) | 12(4) | 0.62–1.6(1.3) | n.s. | n.s. | n.s. |
|
| n-Heptane | 24(9) | 0.4–22(0.66) | 28(11) | 0.48–2.7(0.74) | n.s. | n.s. | n.s. |
|
| Acetamide, N,N-dimethyl- | 33(33) | 10–463(31) | 37(37) | 5.5–171(31) | n.s. | n.s. | n.s. |
|
| Toluene | 14(8) | 0.55–0.8(0.6) | 15(8) | 0.56–4.6(0.7) | n.s. | 0.033 | n.s. | |
| Furfural | 41(41) | 0.33–5.4(0.72) | 41(41) | 0.28–3.43(0.82) | n.s. | n.s. | n.s. |
|
| Pyridine, 3-methyl- | 29(29) | 5.7–224(21) | 25(25) | 3.5–263(17) | n.s. | 4.7 × 10⁻⁵ | n.s. |
|
| γ-Butyrolactone | 40(40) | 7.3–256(40) | 41(41) | 9.7–277(48.5) | 4.3 × 10⁻³ | n.s. | n.s. | |
| n-Octane | 41(38) | 0.14–78(0.6) | 41(34) | 0.16–10.3(0.93) | n.s. | n.s. | n.s. |
|
| p-Xylene | 32(27) | 0.33–0.78(0.44) | 29(25) | 0.32–1.49(0.47) | n.s. | n.s. | n.s. | |
| Benzonitrile | 38(38) | 0.97–7.7(2.1) | 39(39) | 0.71–10.1(1.84) | n.s. | n.s. | n.s. | |
| DL-Limonene | 31(12) | 0.95–1.63(1.1) | 30(7) | 0.88–2.76(1.2) | n.s. | n.s. | n.s. |
|
| Benzamide | 27(27) | 8.6–956(42) | 27(27) | 4.9–364(44.5) | n.s. | n.s. | n.s. | |
3.2.1. Ketones
Four ketones were released by the tissue samples, with acetone exhibiting the highest level. Acetone belongs to a group of major VOCs produced in the human organism with high abundances in breath [13, 20], blood [13, 21], and urine [22]. Several sources of acetone in tissues under study include (i) endogenous decarboxylation of Acetyl–CoA [20], (ii) 2-propanol metabolism involving alcohol dehydrogenases (ADH) [23], and (iii) diet. In the context of high levels of the hospital-related 2-propanol, it is reasonable to assume that a considerable fraction of the acetone stems from this source. Compared to acetone, the other ketones (2-butanone, 2-pentanone and 3-methyl-2-butanone) have much lower levels in the head space of the tissue samples. Two potential pathways could be involved in their production in the tissues of interest: (i) oxidation of secondary alcohols catalysed by ADHs (or cytochrome p450 (CYP2E1)), and (ii) β-oxidation of fatty acids. ADHs are the enzymes mostly responsible for ethanol metabolism; however, they can also oxidise long-chain, cyclic and secondary alcohols [24]. If so, 2-pentanone could stem from 2-pentanol, 2-butanone from 2-butanol, and 3-methyl-2-butanone from 3-methyl-2-butanol. The source of these secondary alcohols remains unclear; they might stem from the oxidation of n-alkanes catalysed by cytochrome p450 enzymes [25], microbiota metabolism, or diet. Significantly elevated ADHs activity in gastric cancer tissue [26] seems to explain the differences in 2-pentanone and 3-methyl-2-butanone emissions. β-oxidation of fatty acids seems also to be a source of several ketones in humans. For example, 3-heptanone is a product of the 2-propyl pentanoic acid oxidation [27] and 2-ethylhexanoic acid is metabolised to 2-heptanone and 4-heptanone [28]. Walker et al [29] hypothesised that 2-pentanone could be formed analogously via β-oxidation of hexanoic acid in the peroxisomal pathway. Interestingly, hexanoic acid appeared to be upregulated in gastric cancer patients compared to non-cancer controls [7, 8]. Its higher levels in the head-space of cancer tissues seen in this study may reflect this finding. Buszewski et al [3] also reported the emission of acetone, 2-pentanone and 2-butanone from both gastric cancer and normal tissues; however, the number of patients involved in their study (n = 5) was insufficient for a valid comparison of the VOC levels. Moreover, both 2-pentanone and 2-butanone were reported to be produced by cancer cell lines, and proposed as breath cancer markers. For instance, 2-butanone was released by human gastric cancer (MGC-803) [30] and lung cancer cell lines (CALU-1, A549) [31], whereas 2-pentanone was produced in liver cancer (HepG2) and lung cancer cell cultures (A549) [32, 33]. Furthermore, 2-butanone has been considered a potential breath marker of gastric and ovarian cancers [10, 15].
Finally, the presence of ketones can mirror the stomach microbiota activity, both natural and transient. For instance, all ketones of interest are produced by Pseudomonas aeruginosa [34]. Moreover, 2-pentanone is released by Staphylococcus aureus, Streptococcus pneumoniae and Haemophilus influenza [35], whereas 2-butanone is released by Streptococcus pneumoniae and Mycobacterium avium [35]. Although the aforementioned bacteria are not natural colonizers of the human stomach, they can occur as transient oral, esophageal or intestinal species [36].
3.2.2. Hydrocarbons
A total of six hydrocarbons were found in the head space of tissue samples. Isoprene is a terpenoid and is emitted by bacteria [37], animals [38], humans [39], and primarily plants [40]. According to current theory, isoprene is produced from isopentenyl pyrophosphate (IPP) and its isomer dimethylallyl pyrophosphate (DMAPP). So far, two metabolic pathways leading to the DMAPP formation have been identified: the mevalonic acid (MVA) and the 1-deoxy-D-xylulose-4-phosphate/2-C-methylerythriol 5-phosphate (DOXP/MEP) pathways [39, 41]. The latter was demonstrated to dominate in plants [40, 41], and most bacteria [37], whereas, the MVA pathway is present in higher eukaryotes and some specific bacteria [39]. In plants and bacteria, DMAPP is transformed into isoprene by isoprene synthase [37]. In animals and humans, it might be produced by acid-catalyzed formation from DMAPP occurring in the cytosol of hepatocytes [42]. Nevertheless, the latter reaction is rather slow and unlikely to be responsible for the high isoprene levels in humans [41]. Moreover, emerging evidence suggests that other endogenous metabolic sources may contribute to isoprene formation in humans [32, 43–45]. Isoprene has received widespread attention in the field of breath gas analysis due to the fact that it was seen as a sensitive, non-invasive indicator for assaying several diseases, including lung cancer [46] and gastric cancer [9]. In humans, isoprene is metabolized in liver microsomes by cytochrome p450 (CYP2E1 and CYP2B6) to mono- and di-epoxides (3,4-epoxy-3-methyl-1-butene and 3,4-epoxy-2-methyl-1-butene), which are in turn hydrolysed by epoxide hydrolase to vicinal diols (2-methyl-3-buten-1,2-diol and 3-methyl-3-buten-1,2-diol) [47]. Regarding potential bacterial production, isoprene is liberated by Pseudomonas aeruginosa [34, 48] and Mycobacterium avium [49], but notably these species are not natural colonizers of the human stomach.
The emission of n-pentane might mirror oxidative stress inducing peroxidation of unsaturated fatty acids. There is evidence that lipid peroxidation of ω3 and ω6 fatty acids leads to the production of some saturated hydrocarbons, such as ethane and n-pentane [50, 51]. More specifically, ethane and n-pentane are generated via β-scission of alkoxy radicals formed by the homolytic cleavage of fatty acids hydroperoxides, e.g. in vitro studies have shown the production of n-pentane from linoleic and arachidonic acids [51]. An alternative source of n-pentane involves activity of the microbiota; more specifically, this hydrocarbon is released by Helicobacter pylori [3, 19] and Mycobacterium avium [49]. The metabolic pathways leading to the formation of the remaining hydrocarbons (n-hexane, n-heptane, n-octane and 2-methyl-1-propene) in tissues under scrutiny remain unclear. They might be of bacterial origin, stem from lipid peroxidation processes, or from environmental exposure. For instance, all the aforementioned species are liberated by Helicobacter pylori [3, 19] and Mycobacterium avium [49]. Interestingly, n-octane is released by human lung cancer cells (A549), but not normal cells [33], and by lung cancer and normal tissues [4]. In the latter case, emission of this VOC from the cancer tissue was significantly higher. Moreover, n-octane, n-heptane and n-pentane have been proposed as potential breath markers of lung cancer [4, 52].
3.2.3. Volatile sulphur compounds
A number of volatile sulphur compounds (VSCs) have been detected in the tissue headspaces. The production of VSCs in humans is ascribed to the metabolism of the sulfur-containing amino acids, methionine and cysteine [53]. Methanethiol is produced from methionine by L-methionine γ-lyase following transamination of methionine from 3-methylthiopropionate, or by bacteria in the intestinal tract [53, 54]. Regarding the microbiota, methyl mercaptan is liberated by Helicobacter pylori [54], Pseudomonas aeruginosa [55] and Streptococcus pneumoniae [35]. Dimethyl sulfide can be synthesized via the methylation of methanethiol by thiol S-methyltransferase [53]. The latter also converts H2S into methanethiol in the mucosa. H2S can in turn be formed (i) endogenously by desulfhydration of cysteine catalysed by cystathionine-β-synthase (CBS), cystathionine γ-lyase (CSE) and 3-mercaptopyruvate sulfurtransferase, or (ii) by the microbiota in the intestinal tract [53, 56]. For instance, bacteria belonging to genera Streptococcus, Fusobacterium, Salmonella, Enterobacter, and Helicobacter synthesize H2S from L-cysteine by cysteine desulfhydrase, whereas sulfate-reducing bacteria (e.g. Desulfovibrio, Desulfobacter, Desulfomonas, Desulfobulbus) use sulfate as a terminal electron acceptor for respiration catalysed by sulfite reductases, with H2S being a by-product [56]. Since the stomach is exposed to reflux of bacteria from the duodenum, the transient presence of these species in this organ might be a source of VSCs.
Within this study, the emission of carbon disulfide was significantly higher from gastric cancer tissue than from normal tissue, which is consistent with the findings of Buszewski et al [3], the reason for this difference remains unclear. In humans, carbon disulfide is assumed to stem from environmental or occupational exposure [57]. It is extensively and rapidly absorbed by inhalation, oral, and dermal routes, and excreted together with its metabolites via breath and urine. Carbon disulfide is metabolised by cytochrome P450 monooxygenase to carbonyl sulphide, atomic sulfur and monothiocarbonate [57]. Carbonyl sulfide in turn is converted to monothiocarbonate by carbonic anhydrase, whereas monothiocarbonate reacts with carbamyl phosphate synthetase to form thiourea [57]. Increased levels of carbon disulfide are found in patients undergoing disulfiram therapy [58]. While there is at present no direct evidence for carbon disulfide production in mammals, some recent findings imply that this species might be formed in human organisms. For instance, a significant increase in carbon disulfide occurs in human feces after synbiotic food consumption, suggesting that the gut microbiome plays a role in its production [59]. Moreover, other studies have confirmed the production of this volatile by some bacteria in humans, e.g. Helicobacter pylori [3], Streptococcus pneumoniae and Haemophilus influenzae [35]. The systemic production of carbon disulfide, e.g. during the metabolization of methionine, also cannot be excluded [60]. In this context, it is interesting to find that carbon disulfide was recently postulated to have bioregulatory and/or therapeutic features in mammalian biology [57].
3.2.4. Aromatics
Benzene, toluene and p-xylene belong to a group of volatile aromatic hydrocarbons called BTEX. Their presence in humans is commonly attributed to environmental exposure and/or cigarette smoke. BTEX VOCs are commonly found in petroleum derivatives, such as gasoline and diesel fuels, or used as solvents or intermediates in the synthesis of organic compounds [61]. More specifically, they are constituents of a variety of products, including adhesives, coatings, degreasers, detergents, dyes, explosives, fuels, lacquers, paint, pesticides, polishes and solvents [61]. Release of BTEX into the ambient environment from fossil fuel combustion or fuels/solvents evaporation can lead to human exposure by inhalation or dermal contact. This exposure is manifested in time by increased BTEX levels in body excretions (e.g. urine, blood and breath) and tissues [61]. Elevated levels of BTEX species have been reported in the breath, urine or blood of smokers [62–64]. Thus, cigarette smoking can be considered as a primary source of BTEX species in the human organism; indeed, in this study, toluene was correlated with tobacco smoking. On the other hand, benzene, toluene and p-xylene are thought to be liberated by several pathogens, such as Helicobacter pylori [3], Pseudomonas aeruginosa [34] and Mycobacterium avium [49], and some human cell lines (e.g. human umbilical vein endothelial cells (HUVEC) and human fibroblasts) [33, 65].
3.2.5. Aldehydes
Three aldehydes were emitted by the gastric tissue samples. Acetaldehyde is a product of ethanol oxidation catalysed by ADHs, which is then degraded to acetate by ALDHs [24]. Its mutagenic and carcinogenic features are well documented. In particular, it interferes with DNA synthesis and repair, thereby promoting tumour development. It binds to cellular proteins causing morphological and functional impairment of the cell [66]. Total ADH activity is significantly elevated in cancer tissues in general [66], and in gastric cancer tissue in particular [26]. Consequently, cancer cells have an increased capability for ethanol oxidation, but not an altered ability to remove acetaldehyde, which in turn should lead to increased acetaldehyde levels in cancer tissue. Indeed, upregulation of acetaldehyde emission occurs in the headspace of the gastric content of patients with gastro-esophageal cancer [7], and in the head space of lung cancer tissues comparison to healthy tissue [4], but we did not find a difference in our study. A number of human gastrointestinal bacteria are capable of oxidizing ethanol to acetaldehyde, for instance, Vakevainen et al [67] demonstrated the production of this aldehyde by Neisseria and Rothia species, and by Streptococcus salivarius isolated from gastric juice samples. Salaspuro et al [68] reported its production by Escherichia coli under both aerobic and anaerobic conditions. Furthermore, H. pylori strains were shown to exhibit significant ADH activity [69]. Analogous to acetaldehyde, n-propanal most probably stems from 1-propanol oxidation involving ADHs. Furfural derives most probably from environmental exposure and/or diet. In humans, this compound is rapidly metabolised to furoic acid, which is eliminated in the urine as a conjugate with glycine. Interestingly, furfural was seen as a potential gastric cancer marker [9]. Alternatively, aldehydes could also be formed via β-scission of alkoxy radicals during lipid peroxidation [70]. Acetaldehyde and n-propanal might also originate from exposure to tobacco smoke [70, 71]. However, there was no correlation between these species and smoking in this study.
3.2.6. Nitriles
The origin of observed nitriles is most likely exogenous. There are no known metabolic pathways leading to their production in humans. Environmental acetonitrile originates from biomass burning [72]. In humans, it can be found in considerable amounts in the breath and urine of smokers, and has therefore been proposed as a marker of smoking [62, 73, 74]. Acrylonitrile is an intermediate in the production of plastics, rubbers and pesticides, and has also been reported as a constituent of tobacco smoke [75]. The exogenous origin of the observed nitriles is also confirmed by the findings of this study, as 2-propenenitrile was correlated with the occurrence of H. pylori, whereas acetonitrile with tobacco smoking.
3.2.7. Heterocyclics
Pyrrole is an essential component of numerous biologically active compounds, both natural and synthetic [76]. For instance, the pyrrole ring occurs in hemoglobin, myoglobin, and vitamin B12, and is produced during their biosynthesis. Pyrrole and 1-methyl-pyrrole are common constituents of human urine [22, 77]. Species of this chemical class can also have an exogenous origin. The pyrroles of interest are present in numerous beverages (coffee, tea, and beer) and thermally-treated meat (boiled, roasted and fried chicken, beef and pork) [78]. Moreover, pyrrole can be emitted by human lung cancer cells (A549) [33] and some bacteria [49].
γ-Butyrolactone occurs naturally in humans and is a common constituent of human plasma/serum [79, 80], breath [13, 62] and skin emanations [81]. Under physiological conditions, it exists in chemical equilibrium with its acid form, γ-hydroxybutyric acid (GHB) [79, 82]. GHB in turn has several precursors, such as γ-aminobutyric acid or 1,4-butanediol [82]. GHB is used worldwide in the treatment of narcolepsy with attacks of cataplexy, or in alcohol dependence [82]. γ-butyrolactone is also the metabolite of fluoropyrimidine (UFT) and is used in the treatment of different cancers, including gastric cancer [79, 80]. It has anti-angiogenic properties and, thereby contributes to the anticancer effects of UFT. The plasma levels of this compound are considerably elevated after administration of UFT to patients with gastric cancer [80].
Pyridine and its derivative, 3-methylpyridine, are probably exogenous VOCs stemming from diet or environmental exposure. They are absorbed through the gastrointestinal tract, skin and lungs, and eliminated via urine, feces, the skin and the lung. More specifically, numerous pyridines are constituents of cigarette smoke [83]. Interestingly, pyridine emission from gastric cancer tissue is significantly higher than from non-cancerous tissue. A similar difference was reported for lung cancer and normal tissues [4].
3.2.8. Esters and amides
Ethyl acetate stems most probably from an esterification reaction involving ethanol and acetic acid. Although such a reaction in the absence of a catalyst is very slow, ethyl acetate could be formed in the tissues under study, and subsequently released into the tissue headspace. The large amount of ethanol found in the headspace of cell cultures seems to confirm this hypothesis. A second substrate necessary to produce this species—acetic acid—is a common VOC in humans, stemming from normal biochemistry (e.g. ethanol metabolism, Krebs cycle, or pyruvate metabolism). In particular, oxidation of ethanol by a tandem of alcohol and aldehyde dehydrogenases (ADHs and ALDHs) could also boost the production of this ester. Nevertheless, alternative sources of ethyl acetate, such as environmental exposure or diet, cannot be ignored. Intriguingly, ethyl acetate has also been considered a potential marker of colorectal cancer by Amal et al [84].
Acetamide and dimethylacetamide are commonly used as solvents, and in the production of pharmaceuticals and plasticizers. They are readily absorbed from the gastrointestinal tract, through the skin, and by inhalation. Acetamide is also produced from metronidazole by intestinal microflora in rats [85].
4. Conclusions
The aim of the present study was to identify and quantify the VOCs released by gastric cancer and non-cancerous tissue. Ex vivo analysis of tissue headspace, involving gas chromatography with mass spectrometric detection coupled with needle trap extraction, resulted in the determination of 32 VOCs. Levels of four species (carbon disulfide, pyridine, 3-methyl-2-butanone and 2-pentanone) were at significantly higher concentrations from cancer tissue, whereas three VOCs (isoprene, γ-butyrolactone and dimethyl sulphide) were at higher levels from non-cancerous tissue (Wilcoxon signed-rank test p < 0.05). Four VOCs (acetonitrile, pyridine, toluene and 3-methylpyridine) were associated with tobacco smoking; and three species (2-methyl-1-propene, 2-propenenitrile and pyrrole) were associated with the occurrence of H. pylori. The difference in the emissions of the aforementioned species may be explained by cancer-related changes in the activity of certain enzymes. Ex vivo analysis of VOCs emitted by human tissue samples provides a unique opportunity to identify and compare chemical patterns associated with diseased states. Analysis of healthy and diseased tissues obtained from the same subjects may also help to limit/balance the influence of confounders (treatment effects, diet, environmental exposure, etc) on the identification of biomarkers. The results obtained within this study suggest that volatiles emitted by gastric cancer tissue form a cancer-specific chemical fingerprint. The components of this fingerprint secreted from humans through breath, urine and other exudates could assist in developing non-invasive tests for the diagnosis of gastric cancer. Further studies are required to validate these possible markers, and to gain more insight into their origin and fate in the human body.
There are several limitations of this study. First, highly volatile species C3–C12 have been our prime focus, and consequently some interesting compounds characterized by lower vapour pressure may not have been detected. Second, the available tissue samples were relatively small (∼100 mg), which must affect the sensitivity of the applied analytical method and, thereby the recognition of species emitted in trace quantities. Moreover, the differences in the shape of samples could impact head space extraction and consequently the repeatability of our measurements. Finally, sample storage could have influenced the obtained chemical patterns. Although, the VOCs of interest were found to be stable (within the RSD of the method) in frozen samples over the period of 6 weeks, no comparison to fresh samples was done owing to the large distance between the sampling and analysis locations.
Acknowledgments
This work has received funding from the European Union's Horizon 2020 research and innovation programme under grant agreement no. 644031. PM gratefully acknowledges financial support from the Austrian Research Promotion Agency (FFG) for the program KIRAS Security Research under Grant DHS-AS 859586 and the Austrian Science Fund (FWF, Grant No. P24736-B23), and Latvia Research Council funded project 'Volatile organic compounds for potential application in gastric cancer screening'. We acknowledge all the patients that have allowed their surgical specimens to be used for this study, as also the services provided by the bio-banking facilities at Riga East University Hospital and the University of Latvia.