
Abstract
Respiratory infections, viral or bacterial, are a common cause of acute exacerbations of chronic obstructive pulmonary disease (AECOPD). A rapid, point-of-care, and easy-to-use tool distinguishing viral and bacterial from other causes would be valuable in routine clinical care. An electronic nose (e-nose) could fit this profile but has never been tested in this setting before. In a single-center registered trial (NTR 4601) patients admitted with AECOPD were tested with the Aeonose® electronic nose, and a diagnosis of viral or bacterial infection was obtained by bacterial culture on sputa and viral PCR on nose swabs. A neural network with leave-10%-out cross-validation was used to assess the e-nose data. Forty three patients were included. In the bacterial infection model, 22 positive cases were tested versus the negatives; and similarly 18 positive cases were tested in the viral infection model. The Aeonose was able to distinguish between COPD-subjects suffering from a viral infection and COPD patients without infection, showing an area under the curve (AUC) of 0.74. Similarly, for bacterial infections, an AUC of 0.72 was obtained. The Aeonose e-nose yields promising results in 'smelling' the presence or absence of a viral or bacterial respiratory infection during an acute exacerbation of COPD. Validation of these results using a new and large cohort is required before introduction into clinical practice.
Export citation and abstract BibTeX RIS

Original content from this work may be used under the terms of the Creative Commons Attribution 3.0 licence. Any further distribution of this work must maintain attribution to the author(s) and the title of the work, journal citation and DOI.
Introduction
Chronic obstructive pulmonary disease (COPD) is the third leading cause of death worldwide [1]. A significant part of the morbidity and mortality cases, and of the costs of COPD, is related to exacerbations. The most common causes of these exacerbations appear to be respiratory infections, of viral or bacterial origin [2]. However, differences in inflammatory status, level of hyperinflation, and anxiety contribute as well [3, 4]. The mainstream medical treatment consists of bronchodilators, which can be administered by nebulizers or inhalers, and corticosteroids [2]. The need for antibiotics is under continuous investigation and discussion [5]. There are many reasons to be restrictive with antibiotics, including increasing antibiotic resistance, their adverse effects, and the difficulty in distinguishing between bacterial infections and viral infections; if viral, antibiotics should not be administered [3].
This leads to an important clinical challenge: to quickly distinguish between viral, bacterial, and non-infectious causes of exacerbations. A bacterial culture of sputum is the most important diagnostic tool for bacterial infections; for viral pathogens serology is commonly used, and more recently, PCR is applied in some hospitals. However, these techniques are time consuming, expensive and/or require an extensive infrastructure. So the search for improved screening tools to make important treatment decisions continues. Preferably, these tools should support decisions that prevent in-hospital-spread of viruses as well [6]. Such a screening tool needs to be easy-to-use, patient friendly, quick, and preferably fit for point-of-care testing. It will be even more useful in settings with limited or no microbiological support.
An electronic nose, (e-nose) could become this new screening tool. An e-nose measures volatile organic compounds (VOCs). A large number of VOCs are present in exhaled breath. Electronic noses can be based on several different technological principles, e.g. sensor arrays consisting of conducting polymers, quartz-microbalance based sensors, nanomaterial-based sensors, and colorimetric sensors [7, 8].
In the Aeonose®, metal-oxide sensors are used. Using this specific technology, it has been feasible to distinguish between tuberculosis infections and other lung diseases [9].
E-noses using other techniques have been capable of diagnosing bacterial sinusitis and ventilator-associated pneumonia [10, 11]. E-noses have been used to distinguish between asthma and COPD, and more recently in more advanced trials in profiling stable COPD and asthma [8, 12–14]. It is also possible to now identify whether or not patients are suffering from an exacerbation of COPD [15].
So far, electronic noses have not been tested in the setting of acute exacerbations of COPD, especially not from the viewpoint of choosing treatment guided by possible etiologies of the exacerbation. In contrast to some other e-noses, the recently developed handheld Aeonose is easy-to-use, patient friendly, and quick. Collection bags are not required. Besides this, calibration models can be transferred to other Aeonose devices removing the need to calibrate e-noses individually [16]. This enables point-of-care testing, opening up the possibility of a tool that could be used for daily practice in exacerbation treatment.
This trial was designed to assess the Aeonose for rapid, easy-to-use, patient friendly, discrimination between causes of exacerbations of COPD. The hypothesis tested is that using this e-nose, it is feasible to detect the presence of a viral or bacterial cause of acute exacerbations of COPD.
Methods
This trial was registered in the WHO approved International Clinical Trials Registry Platform, The Netherlands Trial Registry (NTR 4601).
The study was conducted in the emergency room and pulmonary ward of our university teaching hospital in Groningen (The Netherlands).
Subjects
Patients diagnosed with COPD by current GOLD standards were screened [2]. The main criteria used were postbronchodilator forced expiratory volume in one second <80% predicted and postbronchodilator forced expiratory volume in one second/forced vital capacity <0.70. All patients were former or current smokers.
All were diagnosed with an acute exacerbation of COPD and hospitalized. The diagnosis was made based on the GOLD definition of an acute event characterized by worsening of the patient's respiratory symptoms that is beyond normal day-to-day variations and leads to a change in medication [2]. During the first days of their hospital stay, sputum cultures, a nose brush for PCR for viral respiratory infections, and exhaled breath analysis by Aeonose were obtained. Blood cultures were taken if deemed necessary by the treating physician.
Participants needed to fit the inclusion criteria: a diagnosis of COPD, a confirmed COPD exacerbation, admission to the pulmonary ward, and a sputum bacterial culture and nose swab for viruses. Subjects were excluded if they suffered from lung cancer, respiratory insufficiency requiring ventilation, or if they could not adequately hold the Aeonose during the test themselves. Patients with a pneumonia confirmed by chest radiograph were excluded as well. Patients were treated during their admission with bronchodilators, corticosteroids, and supplemental oxygen. Besides this, most were also treated with antibiotics. All participants provided informed consent before performing study procedures and after being informed on the purposes and details of the investigation. Based on earlier pilot studies for different indications with this e-nose, a sample size of 40 subjects was chosen.
Primary endpoints
- The ability to ascertain the presence of a respiratory bacterial infection during an acute exacerbation of COPD by Aeonose.
- The ability to ascertain the presence of a respiratory viral infection during an acute exacerbation of COPD by Aeonose.
Decision rules
Decision rules were agreed upon and followed by the study team regarding the issue whether participants suffered from a bacterial, viral, or no respiratory tract infection.
The diagnosis of viral infection was established if the nose swab tested positive by polymerase chain reaction (PCR). Primers for the 15 most common respiratory viruses in The Netherlands were used. A viral infection was established to be negative if the test result was negative with a cutoff cycle threshold of 40. The diagnosis of bacterial infection was established if either the blood or sputum culture was positive for a bacterial pathogen. A bacterial infection was established to be negative if the test result showed negative. Patients suffering from both bacterial and viral infections were allowed to be included.
Spontaneous sputum samples were cultured on sheep blood, chocolate, and MacConkey agar plates at 35 °C for 48 h in 5% CO2. A sputum culture was considered to be positive if the cultured microorganisms are potentially pathogenic, the growth density in the culture is high (semi quantitative), the number of squamous epithelial cells is <25, and the number of the leukocytes in the Gram-stained preparation of the sputum sample is >15 per high power field (100 × 10). This corresponds with the Geckler and Bathoorn group [17, 18].
The Aeonose
The Aeonose (The eNose Company, Zutphen, The Netherlands) is a handheld device (figure 1) using three metal-oxide sensors (AMS Premstaetten, Austria), which consist of different metals that allow for various interactions with volatile compounds. These include carbon monoxide (AS-MLC), nitrogen dioxide (AS-MLN), and volatile organic compound (AS-MLX) sensors. Exhaled air is guided over these sensors. At the sensor surfaces, redox reactions can occur. These reactions lead to conductivity changes that are measured. The sensors are exposed to a sinusoidal temperature cycle between 280 °C and 340 °C thus providing information on the temperature dependence of the redox reactions as the conductivity is measured 32 times during each cycle. The temperature profile consists of two consecutive cycles lasting 20 s in total, thus resulting in 64 values every 20 s for each of the three sensors. This leads to a conductivity pattern for the VOCs present in the exhaled breath. In order to achieve data reproducibility, the temperature control of the sensors is within approximately 1 °C.

Figure 1. The Aeonose in use.
Download figure:
Standard image High-resolution imagePatients are asked to breathe normally in and out through the device for 5 min. No collection bags are required so exhaled VOCs are analyzed in real-time.
During the first 2 min, no measurements are recorded and this period of time is used for clearing the lungs with filtered air. During the next three minutes, conductivity values of exhaled air are recorded. After these 5 min, the patient can stop breathing through the Aeonose, and the device starts regenerating the sensors by flushing with air. After this, a Tenax® tube is heated and VOCs released are guided over the sensors. Then the sensors are regenerated with air. In that way, a full measurement takes 15 min, and for 12 min conductivity values are recorded. The disposable mouthpieces are equipped with a HEPA-filter to provide hygiene. This mouthpiece also contains a carbon filter to ensure that the patient does not inhale volatiles that could disturb the measurement. A nose clamp is used to make sure the subject is breathing through the mouth.
The Aeonose weighs 650 g. Note that the Aeonose measures an integrated breath profile, not a specific VOC in the exhaled breath.
The main objective of this device is to classify the measured conductivity pattern of a subject. Therefore, it is necessary to train the Aeonose by exposing it to the breath of a series of well-diagnosed individuals according to the groups of the protocol. In that way, the Aeonose can learn to distinguish between groups. The methodology for achieving this is described in the next section.
Statistical analysis
As described in the literature, the evaluation of data from sensor arrays like the Aeonose contains several steps [7, 19]. This trial followed the steps of those articles, including data acquisition, data pre-processing, data reduction, and training of an artificial neural network (ANN).
As conductivity values are recorded for 12 min as described above, each patient's measurement comprises of thousands of records. The temperature control described above enables proper reproducibility of the results. However, even for sensors produced on the same wafer, thickness and aging differences cause slight variations between sensors and Aeonoses over time. In order to cope with this phenomenon, the data were scaled, and multiple noses were used [16].
As the matrix size is too large for classification, and in order to avoid so-called voodoo-analyses, the data were scaled and then compressed using a Tucker3 solution [20, 21].This resulted in a vector of 11 components per patient.
The vectors generated in the study, combined with a classifier value (either bacterial or viral), were used to train a back-propagating artificial neural network (ANN) and investigate if the ANN would be able to distinguish between the two groups. In order to make sure that classification results are based on actual differences between subjects, and not on data coincidences or over-fitting of data, so-called leave-10%-out cross-validation was applied.
In practice, this means that 10% of data is left out, and an ANN is trained using the remaining 90%. With the ANN model found, the remaining 10% of data is analyzed. In the next step, another 10% of data of the total dataset is left out, and the remaining 90% is used to train a second ANN followed by classifying 10% of data left out previously. This process is followed ten times, so all data are classified once based on training another part of the dataset. The results shown in the next section are constructed from ten separate ANNs.
For this data analysis, proprietary software was used, developed in-house at The eNose Company.
Results
During the trial, 72 patients were screened. Based on the inclusion and exclusion criteria 25 patients were not eligible, largely due to patients' inability to provide sputa for culture. Therefore, 47 patients were assessed. Four participants were excluded for technical reasons (see figure 2). So, 43 patients were included. Detailed baseline characteristics of the 43 patients are presented in table 1.
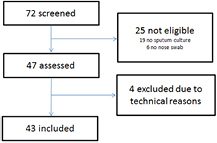
Figure 2. Flowchart of patient inclusion.
Download figure:
Standard image High-resolution imageTable 1. Patient characteristics.
| Al patients | Bacterial infection | Without bacterial infection | Viral infection | Without viral infection | |
|---|---|---|---|---|---|
| N | 43 |
22 | 21 | 18 | 25 |
| Sex F/M | 18/25 | 8/14 | 10/11 | 10/8 | 8/17 |
| Age | 67 ± 11 | 66 ± 12 | 68 ± 11 | 66 ± 10 | 68 ± 12 |
| Classification of severity of airflow by GOLD I/II/III/IV | 2/18/13/10 | 1/8/6/7 | 1/10/7/3 | 2/6/7/3 | 0/12/6/7 |
| Current smokers/ex-smokers/never smokers | 20/23/0 | 10/12/0 | 10/11/0 | 10/8/0 | 10/15/0 |
| Pack years | 44 ± 21 | 43 ± 25 | 44 ± 19 | 45 ± 20 | 43 ± 20 |
| Number of participants treated with systemic steroids before breath pattern measurement | 37 | 19 | 18 | 18 | 19 |
| Number of participants treated with antibiotics before breath pattern measurement | 26 | 13 | 13 | 12 | 14 |
aNine patients had both a bacterial and a viral respiratory tract infection, 12 patients had no infection. Results are shown as mean ± SD.
Viral infections
Data were analyzed using an ANN as described before, and a receiver operating curve (ROC) was created to assess the Aeonose performance for this indication. The group with a viral infection was tested versus the group without a viral infection. An area under the curve (AUC) of 0.74 was found. Based on the ROC curve, a sensitivity of 83% and a specificity of 72% can be achieved (figure 3).

Figure 3. ROC curve of association between exhaled-breath patterns and viral infections during AECOPD.
Download figure:
Standard image High-resolution imageBacterial infections
Similarly, for bacterial infections, data were analyzed and a receiver operating curve (ROC) was created to assess the Aeonose performance. The group with a bacterial infection was tested versus the group without a bacterial infection. This model has an AUC of 0.72. A sensitivity of 0.73 and a specificity of 0.76 was can be achieved (figure 4).

Figure 4. ROC curve of association between exhaled breath patterns and bacterial infections during AECOPD.
Download figure:
Standard image High-resolution image
Discussion
The electronic nose tested, the Aeonose, was able to detect the presence or absence of a viral or bacterial respiratory infection during an AECOPD with a promising accuracy.
To our knowledge, this is the first registered prospective trial assessing the cause of AECOPD by e-nose technology. Like phenotyping stable COPD, the recognized importance of phenotyping exacerbations of COPD is growing as well [4, 22–24]. One of the most important differences between exacerbations may be the cause. Several phenotypes have been identified already [23, 25–27]. This trial shows the potential of the e-nose in phenotyping AECOPD.
Important treatment decisions in exacerbation treatment are taken every day, and are usually only partially based on phenotypes. Important questions that arise daily include: are antibiotics required? Are antiviral treatments required? Should this patient be isolated during hospital stay from other patients or sent home to prevent in-hospital-spread of viruses? Is the potential harm by drugs (antibiotics) outweighed by the expected benefit?
Current tools like viral serology, viral PCR and bacterial cultures have a classical role in answering these questions. However, these are not easily available, costly, and most importantly, test results become available with a considerable delay. It would be advantageous to not have to wait for 1–3 d for results to become available. One could assume that clinicians will be happy for day-to-day care with tools like the Aeonose when proven to work reliably and cost-effectively.
The Aeonose has additional advantages making it an even more interesting tool to fill the earlier described gap in exacerbation treatment: the Aeonose is easy-to-use, no collection bags are required, and it is patient friendly because it can be used by the bedridden patient, and patients can maintain their regular breathing frequency. Measurements are inexpensive and, as opposed to the current standard by culture or viral PCR, no microbiology department is needed.
Within the field of obstructive airways diseases, e-nose technology has already proven its use in distinguishing asthma from COPD, profiling stable disease, and finding exacerbations [14, 15]. These results, using an e-nose based on metal-oxide sensors, confirm earlier studies for different infections for other diseases or circumstances [9, 28–31]. Several different sensor techniques were used in those earlier trials. It would be interesting to investigate whether these results are specific to the e-nose technique used, or can also be achieved with e-noses based on arrays of conducting polymers, quartz microbalance sensors, nanomaterial-based sensors or colorimetric sensors.
The design of the pilot study has several limitations, of which sample size is one, leaving no possibility within the pilot to validate the results and to assess reproducibility in a second cohort. To address this, a leave-10%-out cross-validation was performed. The next step is to perform a confirmation study in a large blinded cohort to assess accuracy of the prediction. This method propagated by the STARD statement and recently by Bikov et al to assess e-nose technology, is probably the right way forward [7, 32]. Another future step is to test the system for detection of individual pathogens, which will require a much larger sample size.
In the Dutch health care system patients are often treated with antibiotics prior to referral to the hospital. Therefore, the use of antibiotics was registered thoroughly, but not excluded. Effects of antibiotics can be swift, especially in infections with S. pneumonia. This would have the effect of lowering the AUC, which was now 0.72. We had considered including only patients without prior antibiotics, but this would render the setting less clinically relevant. Our reasoning was: when a patient with a COPD exacerbation visits the hospital and a decision needs to be made regarding the presence of infection, all-comers are the group of interest.
This trial is a first step towards a fast, patient friendly, point-of-care, and low-cost assessment of the cause of infections in AECOPD. Worldwide, assessment of bacterial and viral infections is not performed in most practices and clinics due to financial and logistical limitations. When confirmed, these results would be a valuable tool. This could lead to decreased use of antibiotics and antiviral medication. This will have to be tested in further trials assessing treatment algorithms to adequately and personally target the administration as well as the withholding of antibiotics. Also, and perhaps increasingly important, a contribution could be made to rational and efficient patient isolation management to prevent in-hospital-spread of infections, especially viruses.
In summary, the e-nose tested, the Aeonose, holds promise as a quick point-of-care tool to assess the presence or absence of a viral or bacterial respiratory infection during AECOPD, and now needs to be confirmed.
Acknowledgments
We thank Jetty Sijgers, Jantien Remmelink, Jurre Blaauw, and Alice Niemeijer for the collection of data and for performing the e-nose measurements. We like to thank The eNose Company for logistical support.
Conflict of interests
WVG: Dr van Geffen reports a grant to the institution for an investigator initiated trial from Novartis, outside the submitted work. MB: Dr Bruins is employed by the company producing the e-nose devices used. HK: Dr Kerstjens reports fees paid to his institution from Boehringer Ingelheim and Pfizer based on advisory board participation, lectures, and per patient recruited in trials; from GlaxoSmithKline for advisory board participation and per patient recruited in trials; from Novartis for advisory board participation, lectures, and a grant for investigator initiated trial; and from Almirall and Chiesi for advisory board participation, all outside the submitted work. All were paid to the institution.