

Abstract
The search for new clinical tests aimed at diagnosing chronic respiratory diseases is a current research line motivated by the lack of efficient screening tools and the severity of some of these pathologies. Alternative biological samples can open the door to new screening tools. A promising biofluid that is rarely used for diagnostic purposes is exhaled breath condensate (EBC), the composition of which has been inadequately studied. In this research, untargeted analysis of EBC using gas chromatography time-of-flight mass spectrometry has been applied to a cohort of patients with lung cancer (n = 48), risk factor individuals (active smokers and ex-smokers, n = 130) and control healthy individuals (non-smokers without respiratory diseases, n = 61). An identical protocol was applied to the two EBC fractions provided by the sampling device (upper and central airways and distal airway) from each individual, which allowed the compositional differences between the two EBC fractions to be detected. Tentative compounds that contribute to discrimination between the three groups were identified, and a relevant role for lipids such as monoacylglycerols and squalene was found. These results could support the ability of metabolomics to go inside the study of lung cancer.
Export citation and abstract BibTeX RIS
1. Introduction
Chronic respiratory disease is a generic term that encompasses long-term pathological conditions that affect the airways and other lung structures involved in respiration. Among these chronic diseases it is worth emphasizing two pathologies: chronic obstructive pulmonary disease (COPD) and lung cancer, with the latter being one of the leading causes of disease-related death in most developed countries [1, 2]. The high death rate observed for the most severe respiratory diseases is associated with the low efficiency of the screening methods used to detect them at early stages [3]. The search for diagnostic tests targeted at the early detection of chronic respiratory diseases has intensified in the last decades. Low-dose computed tomography (CT) is at present the most efficient test for lung cancer screening, as it reduces the mortality of the high-risk population by about 20% as compared to the chest radiography arm, according to the National Lung Screening Trial [4]. CT has also proved to be useful for COPD evaluation [5].
Apart from tests based on imaging techniques, different 'omics' studies have focused on the development of screening tools to diagnose respiratory diseases, mainly searching for potential biomarkers in either tissue or biofluids. As the use of invasive sampling impairs a screening methodology in terms of time consumption and patient welfare, biofluids sampled in a non-invasive manner are gaining in popularity. This is the case with urine or sputum and, more recently, exhaled breath or sweat [6]. A recent study on using sweat to discriminate metabolite patterns for lung cancer screening resulted in an optimum panel of five compounds [7]. The panel provides 80% specificity and 79% sensitivity, which leads to false positive and negative rates of around 20% [8]. Concerning exhaled breath, the levels of nitrite in epithelial fluid have demonstrated discrimination capability as a biomarker since an increase of this anion seems to be associated with cancer [9]. Individual cytokines have also been investigated in exhaled breath from lung cancer patients using enzyme immunoassays (EIA), but commercially available immunoassays lack of the sensitivity required for early detection [10–13]. Other biomarkers (e.g. hydrogen peroxide [14], 8-isoprostane [14] or pH level [15]) have allowed discrimination between COPD patients and healthy controls; however, they seem to be incapable of discriminating between controls/COPD patients and patients with lung cancer, as Antus et al pointed out in recent research [16]. Targeting VOCs in exhaled breath vapor, Phillips et al developed a mathematical model constituted by 22 compounds (mainly alkanes and benzene derivatives) as primary lung cancer biomarkers. The model reported sensitivity and selectivity values of 71.7% and 66.7%, respectively, even for advanced stages of the disease [17]. This study was later improved by including a set of oxidative stress products excreted in breath in the model [18], thus achieving sensitivity and specificity of 85.1% and 80.5%, respectively. Further on, another study concluded that a 2 min breath test can predict pulmonary cancer regardless of the histology, stage of the disease or tobacco smoking, with 84.6% sensitivity and 80% specificity [19]. A recent study provided a 23 VOC panel for exhaled breath with the ability to distinguish between lung cancer patients and controls with 96.5% sensitivity and 97.5% specificity [20]. However, the criteria for the classification of endogenous compounds were not restrictive and some of the compounds included in the panel were also detected in the air of the sampling room.
Apart from the direct analysis of exhaled breath using an appropriate interface, this sample can be analyzed after condensation. Exhaled breath condensate (EBC) is the exhaled gas that condensates as a liquid solution via cooling, and analysis of this should provide insights into the composition of the extracellular lining fluid and soluble exhaled gases. Despite the fact that the main component of EBC is water vapor, hundreds of different components, ranging from small inorganic ions through large organic molecules to peptides, proteins, surfactants and macromolecules at trace concentrations, can be found in these samples [21–26].
Regarding the EBC sampling protocol, there are commercial devices that allow the collection of two EBC fractions by separating the air coming from the upper and central airways (upper breath, UA) and the distal airway (lower breath, DA). Despite the fact that UA is believed to contain compounds without clinical relevance [21], the differences between the types of samples have not been clearly established. In this research, fractionation of EBC was selected as a strategy to compare the composition profiles of UA and DA to find metabolomic differences between lung cancer patients and a risk factor group composed of active smokers. A third group of non-smoking healthy individuals was used as a control group. The composition profiles of UA and DA for the three groups were obtained using gas chromatography–time-of-flight mass spectrometry(GC–TOF/MS) in the high-resolution mode.
2. Experimental
2.1. Cohort selected for the study
The EBC samples were collected from 239 individuals early in the morning before breakfast and stored at −80 °C in the biorepository of the Reina Sofía Hospital (Córdoba, Spain). All individuals were recruited by the Department of Respiratory Medicine. The cohort included 48 patients who had been diagnosed with lung cancer, with this confirmed cytohistologically after clinical tests based on a bronchoscopy, fine-needle biopsy, or video-assisted thoracoscopy. The patients were in the interval 63 ± 7 years, and 94% of them were males. The most frequent diagnostic was squamous cell carcinoma (15 patients, 31.25%), followed by adenocarcinoma (13 patients, 27%), small cell carcinoma (seven patients, 14.5%) and large cell carcinoma (six patients, 12.5%). Seven individuals (14%) were diagnosed with non-small cell lung cancer without histological classification.
The risk factor group was formed by 130 individuals, all of them active smokers or ex-smokers (<five years) with a cumulative consumption >20 packages yr−1. It is worth noting that 47 individuals pertaining to the risk factor cohort were diagnosed with COPD by spirometry (FVC/FEV1 ratio <0.7). Two factors supported the inclusion of COPD patients in the risk factor group: firstly, smoking is considered to be the most important risk factor for developing COPD or lung cancer; secondly, the increase of oxidative stress and the presence of inflammatory cells infiltrated in COPD and lung cancer are common ways to explain lung damage theoretically. The risk factor group, followed clinically for at least one year, was characterized by ages within the interval 61 ± 8 (82.4% male individuals). The existence of lung cancer in this group was discarded through CT and bronchoscopy. The control group included 61 healthy individuals (age within the interval 60 ± 9 years, 87% male individuals), with no active or passive smokers, showing no clinical symptoms and with a normal profile set by thorax radiography.
The patient exclusion criteria were: (a) coexistence of extrapulmonary tumoral pathology or treatment with cytostatic drugs for a different neoplasm; (b) neoplasm diagnosis in the last five years; (c) unjustified weight loss (⩾7 kg) in the last year; (d) severe disorder of any organ with a negative influence on the prognostic, or avoiding application of the protocol, including IV grade cardiac insufficiency according to the New York Heart Association, advanced hepatic cirrhosis, V stage renal insufficiency with substitutive treatment by hemodialysis or peritoneal dialysis, and a lung disease diagnosis not related to smoking, including interstitial pneumopathy, pneumonia, tuberculosis, etc [8].
All experiments were carried out in accordance with the ethical principles of human medical research (World Medical Association, Helsinki Declaration). The ethical review board of Reina Sofía Hospital (Córdoba, Spain) approved and supervised the clinical study.
2.2. EBC collection procedure
The ECOScreen2 device used for sampling directly collects and condenses the EBC in disposable polyethylene bags at −20 °C. This device offers controlled collection of EBC into two separate bags for physical separation between the air exhaled from the UA and DA [21]. Different valves in the EBC sample allow the separation of inspiration from expiration and permit fractioning of the exhaled volume according to a threshold volume into the two cavities: the UA and DA fractions. This configuration makes saliva contamination highly unlikely [27]. The main modification made to the sampler was the insertion of a commercial protection filter from Scharlab (Barcelona, Spain) over the inlet air valve to avoid the entrance of exogenous organic compounds and particles from the room atmosphere. This filter was periodically changed to avoid saturation.
Tidal breathing and a nose-clip were used during the 15 min required to collect an average EBC volume of 1.5 ml from the DA and 1 ml from the UA. Only 101 individuals were able to provide enough volume of the two fractions for analysis. The samples were divided into 100 μl aliquots and the vials were stored at −80 °C until analysis. All samples were analyzed within three months of collection.
2.3. Reagents
Hexane TraceSELECT® grade from Sigma-Aldrich (St Louis, USA) was used as the organic solvent for sample preparation, and an alkane standard mixture (from C10 to C40), also from Sigma–Aldrich, was used for the GC separation tests to establish the retention index (RI) calibration. Deionized water (18 mΩ·cm) from a Millipore Milli-Q water purification system was also used.
2.4. Instruments and apparatus
An ECOScreen2 device (FILT Thorax-und LungenDiagnostik GmbH, Berlin, Germany) was used for EBC collection. Homogenization of the extracts was carried out using an MS2 Vortex (IKA, Germany).
An Agilent 7890A Series GC system coupled to an Agilent 7200 UHD Accurate-Mass QTOF hybrid mass spectrometer equipped with an electron impact (EI) source (Santa Clara, USA) was used. The analytical sample was monitored in the high-resolution mode.
2.5. Sample preparation
Sample preparation consisted of liquid–liquid extraction using hexane as extractant. In all cases, 100 μl aliquots of EBC were 1:1 vortexed with hexane in a glass insert at room temperature for 1 min. Then, the organic phase was isolated and put into a new glass insert for analysis. To eliminate exogenous interferents, blanks were prepared by using water treated as the samples.
2.6. GC–TOF/MS analysis
GC–TOF/MS analyses were performed via the electron impact ionization (EI) mode at 70 eV and controlled by MassHunter Acquisition B.06. The GC separation was carried out by a fused silica DB-5MS-UI 30 m × 0.25 mm ID, 0.25 μm film thickness capillary column. The GC oven temperature program started at 60 °C (1 min held), followed by a temperature ramp of 10 °C min−1 to the final 300 °C (2 min held). The post-run time was programmed for 4 min up to 310 °C to assure complete elution of the injected sample. Pulsed splitless injections of 1 μl of sample were carried out at 250 °C, and ultrapure grade helium was used as the carrier gas at 1.0 ml min−1 flow rate. The interface and ion source were set at 280 and 300 °C, respectively. A solvent delay of 5.5 min was used to prevent damage in the ion source filament. The TOF detector was operated at 5 spectra s−1 in the mass range m/z 50–550 and the resolution was 8500 (full width half maximum, FWHM) at m/z 501.9706. Mass-spectrometric grade perfluorotri-n-butylamine (PFTBA) was used for daily mass calibration. Tentative identification of metabolites was performed by searching MS spectra on the NIST 11 database, taking into account the RI values.
2.7. Data processing and statistical analysis
Unknown Analysis software (version 7.0, Agilent Technologies, Santa Clara, USA) was used to process all the data obtained by GC–TOF/MS in full scan mode. The treatment of the raw data files began with the deconvolution of potential molecular features (MFs) using the suitable algorithm included in the software. For this purpose, the deconvolution algorithm considered all ions exceeding 1500 counts for the absolute height parameter. Additionally, the accuracy error and the window size factor were set at 50 ppm and 150 units, respectively. After the extraction of MFs, data files in the compound exchange format (.cef files) were created for each sample and exported into the Mass Profiler Professional (MPP) software package (version 12.1, Agilent Technologies, Santa Clara, USA) for further processing.
In the next step, the data were processed by alignment of the potential MFs according to their retention time and m/z value using a tolerance window of 0.3 min and an accuracy error of 15 ppm. The MFs from the analysis of blanks were removed from the data set of MFs from the EBC samples. The extraction algorithm confirmed the efficiency of this filtering step. Stepwise reduction of the MF number was based on the frequency of occurrence and done by comparing repetitions of the same group of individuals. A filter by frequency was set at 100%, thus ensuring the detection of each MF in all the injected replicates from each group (lung cancer, risk factor group and control healthy individuals).
In the last step, the resulting MFs were exported (.cef file) for recursive analysis. For this purpose, the Quantitative Analysis software (version 7.0, Agilent Technologies, Santa Clara, USA) was used to reintegrate all the potential compounds found in the analyzed samples. The resulting table was exported in the comma separated values format (.csv file) and reprocessed with the Mass Profiler Professional (MPP) software package. A filter to eliminate samples with within-replicates variability above 10% was applied to assure the effectiveness of the recursive analysis. Finally, the data set was normalized by logarithmic transformation of the ratio between the peak area of each molecular feature and the total useful mass spectrometry signal (MSTUS) corresponding to all the samples [26, 28].
The resulting data set from each EBC fraction was then subjected to unsupervised and supervised analysis by principal components analysis (PCA) and supported vector machine analysis (SVM). The latter was done using ROCCET4, an online toolbox for ROC curve analysis of metabolomics data [29] that uses Monte Carlo cross-validation (MCCV) to estimate the predictive performance as well as the stability of the selected model, performing 50 iterations. In each MCCV, two-thirds of the samples are randomly selected to evaluate the significance of the molecular features and the most important features are selected with different cut-offs to build models that are validated with the remaining third.
A paired t-test analysis was applied to compare the two fractions of EBC from the same patient, and an unpaired t-test was used to compare the groups under study using a Bonferroni–Holm multiple testing correction. SVM analysis was used complementarily to evaluate the predictive response of the identified compounds with high discrimination capability.
2.8. Identification of potential MFs detected by GC–TOF/MS
Identification was firstly carried out by searching MS spectra in the NIST11 database. Only identifications with a match factor and a reverse match factor higher than 700 were considered valid. RI values included in the NIST database were also taken into account to support identifications. An RI calibration model was built by comparing the RI values of an alkane standard mixture (composed of alkane between C10 and C40 with an even number of carbons) with the chromatographic method used in this research and the RI values provided by the NIST database. Supplementary figure 1 (stacks.iop.org/JBR/10/016011/mmedia) shows the RI calibration line obtained via this approach. The requirement for accepting the NIST identifications was that the difference between the theoretical and the experimental RI obtained by extrapolation in the calibration curve should be within ±100 units.
The NIST database does not contain high-resolution MS information as provided by the TOF detector. For this reason, a third step was included to validate the identification of each MF by high-resolution mass spectrometry. Thus, the molecular formula for the tentative precursor ion [M]+ and the most intense product ions obtained for each MF should fit the NIST identification by setting a cut-off value in mass accuracy of 10 ppm. The Kyoto Encyclopedia of Genes and Genomes (KEGG) database was used for the identification of the main changes that occurred in the composition of the EBC from individuals pertaining to each class.
3. Results
3.1. Comparison of the relative concentration of components in UA and DA samples
Despite the fact that the fractionation of EBC is supposed to separate exogenous and endogenous components, no previous studies had evaluated the composition of the two EBC fractions. Table 1 lists the 47 compounds identified in this research, classified by chemical family. Three compounds were excluded, as their origin could only be explained by external sources, such as cosmetic products (sclareol and octinoxate) or the plastic material used during analysis—7,9-di-tert-butyl-1-oxaspiro(4,5)deca-6,9-diene-2,8-dione. All the identified compounds were present in both the UA and DA samples, but some of them showed differences in the relative concentration between fractions. Figure 1 shows the bar diagram comparing the average of the relative concentration for the 44 compounds detected in the samples. As can be seen, most of the identified compounds were found at higher concentrations in DA than in UA. A paired t-test revealed that 15 of these compounds were present at significantly different concentrations in the fractions representing both airways (p value <0.05), which means that almost 34% of the identified EBC components presented different concentration levels in UA and DA (figure 1). As the two EBC fractions gave a quantitatively different composition, independent statistical multivariate analysis of each fraction was carried out.
Table 1. Compounds identified in EBC by GC–TOF/MS analysis.
| Compound name | Retention time | Formula | CAS ID | Fragments | Family |
|---|---|---|---|---|---|
| Eucalyptol | 5.99 | C10H18O | 470-82-6 | 154.1361—[C10H18O]+ | Aliphatic heteropolycyclic compounds (oxanes) |
| 139.1119—[C9H15O]+ | |||||
| 93.0695—[C7H9]+ | |||||
| Indole | 9.90 | C8H7N | 120-72-9 | 117.0558—[C8H7N]+ | Aromatic heteropolycyclid compounds (indoles) |
| 90.0448—[C7H6]+ | |||||
| 74.0145—[C6H2]+ | |||||
| Benzoic acid 4-ethoxy-ethyl ester | 12.92 | C11H14O3 | 23676-09-7 | 194.0425—[C11H14O3]+ | Aromatic homomonocyclic compounds (benzene and substituted derivatives) |
| 149.0581—[C9H9O2]+ | |||||
| 121.0269—[C7H5O2]+ | |||||
| Benzoic acid methyl ester | 6.95 | C8H8O2 | 93-58-3 | 136.0514—[C8H8O2]+ | Aromatic homomonocyclic compounds (benzoic acid derivatives) |
| 105.0332—[C7H5O]+ | |||||
| 77.0378—[C6H5]+ | |||||
| 3,5-Di-t-butyl-4-hydroxycinnamic acid | 20.16 | C17H24O3 | 22014-01-3 | 276.1712—[C17H24O3]+ | Aromatic homomonocyclic compounds (cinnamic acid derivatives) |
| 261.1479—[C16H21O3]+ | |||||
| 177.0896—[C11H13O2]+ | |||||
| Octinoxate | 21.01 | C18H26O3 | 5466-77-3 | 290.1867—[C18H26O3]+ | Aromatic homomonocyclic compounds (cinnamic acid derivatives) |
| 178.0611—[C10H10O3]+ | |||||
| 161.0578—[C10H9O2]+ | |||||
| Cresol | 6.54 | C7H8O | 106-44-5 | 136.0514—[C8H8O2]+ | Aromatic homomonocyclic compounds (phenols and derivatives-cresol) |
| 105.0332—[C7H5O]+ | |||||
| 77.0378—[C6H5]+ | |||||
| Benzyl alcohol | 5.96 | C7H8O | 100-51-6 | 108.0565—[C7H8O]+ | Aromatic homomonocyclic compounds (primary alcohols) |
| 91.0535—[C7H7]+ | |||||
| 79.0533—[C6H7]+ | |||||
| Isopropyl laurate | 14.97 | C15H30O2 | 10233-13-3 | 201.1835—[C12H25O2]+ | Lipids (fatty acid esters) |
| 157.1203—[C9H17O2]+ | |||||
| 102.0656—[C5H10O2]+ | |||||
| Palmitic acid methyl ester | 17.34 | C17H34O2 | 112-39-0 | 270.2545—[C17H34O2]+ | Lipids (fatty acid esters) |
| 227.1998—[C14H27O2]+ | |||||
| 143.1048—[C8H15O2]+ | |||||
| Oleic acid methyl ester | 19.04 | C19H36O2 | 112-62-9 | 296.2702—[C19H36O2]+ | Lipids (fatty acid esters) |
| 264.2442—[18C32HO]+ | |||||
| 81.0685—[C6H9]+ | |||||
| Stearic acid methyl ester | 19.28 | C19H38O2 | 112-61-8 | 298.2862—[C19H38O2]+ | Lipids (fatty acid esters) |
| 255.2315—[C16H31O2]+ | |||||
| 87.0436—[C4H7O2]+ | |||||
| Palmitoleic acid | 17.45 | C16H30O2 | 373-49-9 | 236.2122—[C16H28O]+ | Lipids (fatty acids and conjugates) |
| 98.0710—[C6H10O]+ | |||||
| 69.0689—[C5H9]+ | |||||
| Palmitic acid | 17.69 | C16H32O2 | 57-10-3 | 227.1997—[C14H27O2]+ | Lipids (fatty acids and conjugates) |
| 129.0891—[C7H13O2]+ | |||||
| 73.0279—[C3H5O2]+ | |||||
| Stearic acid | 19.58 | C18H36O2 | 57-11-4 | 284.2706—[C18H36O2]+ | Lipids (fatty acids and conjugates) |
| 129.0908—[C7H13O2]+ | |||||
| 73.0281—[C3H5O2]+ | |||||
| Glycidol stearate | 22.48 | C21H40O3 | 7460-84-6 | 297.2436—[C18H33O3]+ | Lipids (fatty acids and conjugates) |
| 98.0719—[C6H10O]+ | |||||
| 71.0848—[C5H11]+ | |||||
| Undecanol | 11.25 | C11H24O | 112-42-5 | 111.1157—[C8H15]+ | Lipids (fatty alcohols) |
| 83.0844—[C6H11]+ | |||||
| 69.0691—[C5H9]+ | |||||
| 1-Hexadecanol 2-methyl | 15.99 | C17H36O | 2490-48-4 | 111.1160—[C8H15]+ | Lipids (fatty alcohols) |
| 97.1006—[C7H13]+ | |||||
| 69.0691—[C5H9]+ | |||||
| Oleamide | 21.33 | C18H35NO | 301-02-0 | 281.2679—[C18H35NO]+ | Lipids (fatty amides) |
| 126.0914—[C7H12NO]+ | |||||
| 72.0438—[C3H6NO]+ | |||||
| 11-Eicosenamide | 23.01 | C20H39NO | 10436-08-5 | 126.0915—[C7H12NO]+ | Lipids (fatty amides) |
| 72.0439—[C3H6NO]+ | |||||
| 309.2973—[C20H39NO]+ | |||||
| Erucamide | 24.57 | C22H43NO | 112-84-5 | 337.3338—[C22H43NO]+ | Lipids (fatty amides) |
| 126.0916—[C7H12NO]+ | |||||
| 72.0440—[C3H6NO]+ | |||||
| Monopalmitin | 22.57 | C19H38O4 | 542-44-9 | 299.2577—[C18H35O3]+ | Lipids (glycerolipids) |
| 257.2462—[C16H33O2]+ | |||||
| 239.2366—[C16H31O]+ | |||||
| Monostearin | 24.14 | C21H42O4 | 123-94-4 | 327.2897—[C20H39O3]+ | Lipids (glycerolipids) |
| 267.2677—[C18H35O]+ | |||||
| 98.0723—[C6H10O]+ | |||||
| Hedione | 14.41 | C13H22O3 | 24851-98-7 | 83.0479– [C5H7O]+ | Lipids (lineolic acids and deriativatives-jasmonic acids) |
| 97.0623– [C6H9O]+ | |||||
| 226.1566—[C13H22O3]+ | |||||
| Sclareol | 18.77 | C20H36O2 | 515-03-7 | 272.2494—[C20H32]+ | Lipids (prenol lipids-diterpenes) |
| 121.0988—[C9H13]+ | |||||
| 95.0837—[C7H11]+ | |||||
| Limonene | 5.94 | C10H16 | 5989-27-5 | 136.1227—[C10H16]+ | Lipids (prenol lipids-monoterpenes) |
| 121.0992—[C9H13]+ | |||||
| 79.0524—[C6H7]+ | |||||
| Cumyl alcohol | 6.81 | C10H14O | 617-94-7 | 121.0644—[C8H9O]+ | Lipids (prenol lipids-monoterpenes) |
| 103.0530—[C8H7]+ | |||||
| 91.0537—[C7H7]+ | |||||
| Linalool | 6.99 | C10H18O | 78-70-6 | 136.1218—[C10H16]+ | Lipids (prenol lipids-monoterpenes) |
| 93.0679—[C7H9]+ | |||||
| 71.0844—[C5H4]+ | |||||
| Camphor | 7.84 | C10H16O | 464-48-2 | 152.1192—[C10H16]+ | Lipids (prenol lipids-monoterpenes) |
| 137.0963—[C9H13O]+ | |||||
| 95.0852—[C7H11] | |||||
| Camphol | 8.16 | C10H18O | 507-70-0 | 121.1000—[C9H13]+ | Lipids (prenol lipids-monoterpenes) |
| 95.0853—[C7H11]+ | |||||
| 77.0381—[C6H5]+ | |||||
| Levomenthol | 8.25 | C10H20O | 2216-51-5 | 138.1379—[C10H18]+ | Lipids (prenol lipids-monoterpenes) |
| 95.0837—[C7H11]+ | |||||
| 81.0683—[C6H9]+ | |||||
| Terpineol | 8.52 | C10H18O | 98-55-5 | 136.1244—[C10H16]+ | Lipids (prenol lipids-monoterpenes) |
| 121.1007—[C9H13]+ | |||||
| 93.0695—[C7H9]+ | |||||
| Squalene | 24.84 | C30H50 | 111-02-4 | 410.3907—[C30H50]+ | Lipids (prenol lipids-triterpenes) |
| 121.0994—[C9H13]+ | |||||
| 81.0686—[C6H9]+ | |||||
| Cholestadiene | 25.56 | C27H44 | 747-90-0 | 368.3437—[C27H44]+ | Lipids (steroids and steroids derivatives) |
| 247.2412—[C18H31]+ | |||||
| 147.1141—[C11H15]+ | |||||
| Triethyl citrate | 14.40 | C12H20O7 | 77-93-0 | 203.0913—[C9H15O5]+ | Organic acids and derivatives (carboxylic acids and derivatives) |
| 157.0496—[C7H9O4]+ | |||||
| 83.0486—[C5H7O]+ | |||||
| Spiro [2,4]heptane-1,5-dimethyl-6-methylene | 5.95 | C10H16 | 62238-24-8 | 136.1225—[C10H16]+ | Other organic compounds |
| 121.0990—[C9H3]+ | |||||
| 79.0524—[C6H7]+ | |||||
| 2-Propanol 1-(2-butoxy-1-methylethoxy)- | 9.21 | C10H22O3 | 29911-28-2 | 59.0485—[C3H7O]+ | Other organic compounds |
| 86.0715—[C5H10O]+ | |||||
| 103.0728—[C5H11O2]+ | |||||
| 2,4,6-Triisopropylphenol | 12.69 | C17H26O | 08-07-34 | 220.1822—[C15H24O]+ | Other organic compounds |
| 205.1584—[C14H21O]+ | |||||
| 77.0369—[C6H5]+ | |||||
| 13-Heptadecyn-1-ol | 15.11 | C17H32O | 56554-77-9 | 225.1826—[C14H25O2]+ | Other organic compounds |
| 81.0681—[C6H9]+ | |||||
| 67.0529—[C5H7]+ | |||||
| 2,4-Diphenyl-4-methyl-2(E)-pentene | 16.45 | C18H20 | 22768-22-5 | 236.1567—[C18H20]+ | Other organic compounds |
| 143.0809—[C11H11]+ | |||||
| 91.0513—[C7H7]+ | |||||
| 7,9-Di-t-butyl-oxaspiro(4,5)deca-6,9-diene-2,8-dione | 17.18 | C17H26O2 | 82304-66-3 | 175.1104—[C12H15O]+ | Other organic compounds |
| 133.0638—[C9H9O]+ | |||||
| 77.0369—[C6H5]+ | |||||
| 10,18-Bisnorabieta-8,11,13-triene | 17.99 | C18H26 | 32624-67-2 | 242.2007—[C18H26]+ | Other organic compounds |
| 227.1790—[C17H23]+ | |||||
| 143.0864—[C11H11O]+ | |||||
| 2,6-Di-t-butyl-4-(2-phenylpropan-2-yl)phenol | 18.71 | C23H32O | 34624-81-2 | 324.2438—[C23H32O]+ | Other organic compounds |
| 309.2212—[C22H29O]+ | |||||
| 119.0836—[C9H11]+ | |||||
| Phenol 2,2'-methylenebis[6-(1,1-dimethyl)-4-methyl | 21.77 | C23H32O2 | 119-47-1 | 330.1984—[C24H26O]+ | Other organic compounds |
| 315.1748—[C23H23O]+ | |||||
| 237.1263—[C17H17O]+ | |||||
| Phenol 2,4-bis(1-methyl-1-phenylethyl)- | 22.52 | C24H26O | 2772-45-4 | 330.1984—[C24H26O]+ | Other organic compounds |
| 315.1748—[C23H23O]+ | |||||
| 237.1263—[C17H17O]+ | |||||
| 2,4-Bis(dimethylbenzyl)-6-t-butylphenol | 22.57 | C28H34O | 244080-16-8 | 386.2617—[C28H34O]+ | Other organic compounds |
| 371.2370—[C27H31O]+ | |||||
| 293.1897—[C21H25O]+ | |||||
| n-Hexadecylindane | 23.93 | C25H42 | 55334-29-7 | 117.0351—[C9H9]+ | Other organic compounds |
| 130.0427—[C10H10]+ | |||||
| 154.1345—[C11H22]+ |
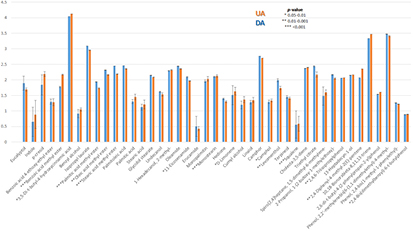
Figure 1. Bar diagram comparing the composition of EBC collected from the UA and the DA.
Download figure:
Standard image High-resolution image3.2. Individual multivariate analysis of the respiratory airway fractions
The next step was to look for discrimination patterns among the three groups included in this study, which could be distinguished slightly by comparison of the representative total ion chromatograms for each group (supplementary figure 2). Previously, statistical analyses by Fisher's exact and Mann–Whitney tests discarded the significance of factors such as age, sex and cumulative tobacco consumption, the latter by comparison of the risk factor and lung cancer cohorts, obtaining in all cases a p-value >0.05. Unsupervised analysis was applied to find differences in EBC fractions collected from the three groups. Principal component analysis was carried out with the data set, including 44 compounds. Owing to the high variability associated with individuals, the three groups under study (lung cancer, risk factor group and healthy individuals) overlapped in the 3D PCA score plots for UA and DA (supplementary figure 3). For this reason, the unsupervised analysis was split into three studies by including only two groups: lung cancer versus risk factor group, lung cancer versus control healthy individuals and risk factor group versus control healthy individuals. Supplementary figures 4 and 5 illustrate the 3D score plots for the three cases using the UA and DA, respectively. In all cases, discrimination trends between the two target groups were observed, but without complete separation.
Supervised analysis was applied to find discrimination patterns associated with the diagnostics of lung cancer. As in the previous case, the SVM analysis was split into three studies: lung cancer versus risk factor group, lung cancer versus control healthy individuals and risk factor group versus control individuals. Figures 2 and 3 illustrate the 2D score plots for the three independent studies of each fraction. As can be seen, discrimination trends were clearly observed in all instances for the DA samples, while the UA samples only showed a discrimination pattern for the comparison between lung cancer patients and control individuals. The percentage of correctly classified samples for the SVM discrimination models performed for UA and DA are listed in table 2. Lung cancer patients were accurately classified in the model combined with healthy individuals, reporting in the UA fraction with a sensitivity of 83.7% and a specificity of 83.3%, while for the DA fraction the sensitivity and specificity were 77.5 and 89.8%, respectively. The discrimination ability decreased when the risk factor group was included in the classification analysis, which is quite logical because it is the intermediate group. Thus, in UA the sensitivity and specificity values for separation of this group from lung cancer patients were 58.1 and 63.7%, and they were 63.7 and 69.4% for separation from healthy individuals. These values increased when the DA fraction was the target sample, with 75.5 and 70.5% sensitivity and specificity, respectively, for separation of the risk factor group from the lung cancer patients, and 79.5% and 71.4% sensitivity and specificity, respectively, for the discrimination of lung cancer patients from healthy individuals.
Table 2. Correctly classified sample rates for the prediction models developed by SVM analysis from UA and DA information.
| Fraction models | UA | DA | ||||
|---|---|---|---|---|---|---|
| RF versus LC | Control versus LC | Control versus RF | RF versus LC | Control versus LC | Control versus RF | |
| Sensitivity (%) | 58.1 | 83.7 | 63.7 | 75.5 | 77.5 | 79.5 |
| Specificity (%) | 63.7 | 83.3 | 69.4 | 70.5 | 89.8 | 71.4 |
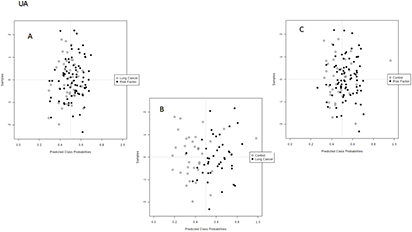
Figure 2. SVM analysis built from the data set obtained after the analysis of EBC extracts from the UA comparing (A) lung cancer patients and risk factor individuals, (B) lung cancer patients and control individuals, and (C) control and risk factor individuals.
Download figure:
Standard image High-resolution image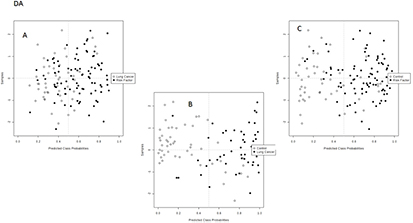
Figure 3. SVM analysis built from the data set obtained after the analysis of EBC extracts from the DA comparing (A) lung cancer patients and risk factor individuals, (B) lung cancer patients and control individuals, and (C) control and risk factor individuals.
Download figure:
Standard image High-resolution image3.3. Identification of compounds with discriminating capability
An unpaired t-test was applied to identify the most significant compounds (p-value <0.01) that contribute to the explanation of the differences observed among the three groups based on DA analysis. Table 3 lists the significant compounds provided by statistical analysis in the three models. p-values, the type of regulation and the fold change ratio are included to show the differences in the relative concentration of the identified compounds. Eleven compounds were found to be statistically significant through a combination of the three models. According to the fold change values, the most relevant changes were found in the models that compared control healthy individuals with the other two groups, risk factor individuals and lung cancer patients. In fact, four compounds were found to be significant in these two models: p-cresol, indole, benzoic acid 4-ethoxy-ethyl ester and 11-eicosenamide. It is also interesting to highlight the presence of two compounds, monoglyceride monostearin and hexadecylindane, in the list of significant compounds in the three models. One other monoglyceride, monopalmitin, was only significant in the two models discriminating risk factor individuals. Finally, some compounds were significant in only one of the three models: triethyl citrate (lung cancer patients versus control individuals), heptadecyn-1-ol and squalene (lung cancer patients versus risk factor individuals) and docosenamide (control versus risk factor individuals).
Table 3. Unpaired t-test analysis using a Bonferroni–Holm multiple testing correction to evaluate the significance of the identified compounds in EBC for discrimination between pairs of groups in this research (lung cancer patients, risk factor individuals and control individuals) and the frequency observed for these compounds in the SVM analysis.
| Lung cancer versus control | ||||
|---|---|---|---|---|
| Compound | P | Regulation | FC | Freq |
| p-Cresol | 9.00E − 04 | down | −3.10466 | 0.5 |
| Indole | 3.51E − 04 | down | −2.77727 | 0.46 |
| Benzoic acid 4-ethoxy-ethyl ester | 0.003489 | down | −1.58336 | 0.84 |
| Triethyl citrate | 0.009728 | up | 2.233156 | 0.5 |
| 11-Eicosenamide | 3.13E − 05 | up | 2.16227 | 0.6 |
| n-Hexadecylindane | 0.002707 | up | 1.952551 | 0.32 |
| Monostearin | 0.003911 | up | 2.608156 | 0.24 |
| Lung cancer versus risk factor | ||||
|---|---|---|---|---|
| Compound | P | Regulation | FC | Freq |
| 13-Heptadecyn-1-ol | 0.002017 | up | 1.4398 | 0.44 |
| Monopalmitin | 0.003899 | up | 2.630078 | 0.12 |
| n-Hexadecylindane | 4.81E − 04 | up | 1.815379 | 0.74 |
| Monostearin | 1.07E − 04 | up | 3.018592 | 0.3 |
| Squalene | 2.12E − 04 | up | 2.431075 | 0.86 |
| Control versus risk factor | ||||
|---|---|---|---|---|
| Compound | P | Regulation | FC | Freq |
| p-Cresol | 0.009083 | down | −2.27088 | 0.3 |
| Indole | 0.004347 | down | −2.0566 | 0.54 |
| Benzoic acid 4-ethoxy-ethyl ester | 0.004672 | down | −1.35418 | 0.44 |
| Monopalmitin | 1.36E − 07 | up | 5.801463 | 0.76 |
| 11-Eicosenamide | 8.68E − 05 | up | 1.799589 | 0.54 |
| n-Hexadecylindane | 3.75E − 12 | up | 3.544619 | 0.44 |
| Monostearin | 1.74E − 12 | up | 7.87296 | 0.62 |
| 13-Docosenamide | 5.19E − 04 | up | 1.485012 | 0.34 |
The predictive capability of the identified compounds was evaluated by application of the linear SVM algorithm to each discrimination model. As previously indicated, the procedure was repeated 50 times according to the MCCV method explained in the experimental section. This tool iteratively combines two-thirds of the samples to evaluate the suitability of compounds for use in sample classification by combining them to build models with different cut-offs, which are validated on the remaining third of the samples. The discrimination accuracy and selection frequency of each compound in all potential combinations provide information about the robustness of these compounds for the classification of the samples in the three groups. The top 15 compounds with the highest selection frequency for each discrimination model are shown in figure 4, which also shows the average predictive accuracy by considering all combinations. As can be seen, four (13-heptadecyn-ol, hexadecylindane, monostearin and squalene, which fit with the four most significant compounds from a statistical point of view) out of the five statistically significant compounds in the model comparing lung cancer patients versus risk factor individuals were in the top 15 compounds with the highest selection frequency. The model dealing with lung cancer patients and control healthy individuals only gave three significant compounds (p-cresol, triethyl citrate and 11-eicosenamide) on the list for the top 15 with the highest selection frequency. On the other hand, five compounds with the highest selection frequency (indole, benzoic acid 4-ethoxy-ethyl ester, monostearin, monopalmitin and 11-eicosenamide) were statistically significant in the model that compared control and risk factor individuals.
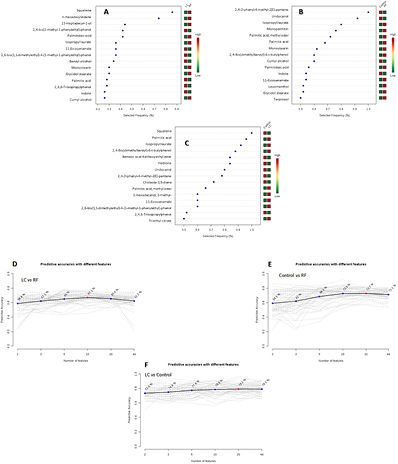
Figure 4. The top 15 compounds with the highest selection frequency for each discrimination model—(A) lung cancer versus risk factor, (B) control versus risk factor and (C) lung cancer versus control—and the average predictive accuracy through considering all combinations—(D) lung cancer versus risk factor, (E) control versus risk factor and (F) lung cancer versus control.
Download figure:
Standard image High-resolution image4. Discussion
The selection of the studied cohort was based on the statistical independence of two main factors, such as age and sex, that could influence the representativeness of the study. One interesting result from this study is the compositional comparison between DA and UA by virtue of the sampler device used. Apparently, no qualitative differences were observed, although most of the identified compounds were found at higher concentrations in DA than in UA. The paired t-test identified seven compounds that were more concentrated in DA: methyl ester fatty acids (stearic, oleic and palmitic), glycidol stearate, levomenthol, squalene and n-hexadecylindane. On the other hand, another eight compounds—phenol derivatives (2,4-bis(dimethylbenzyl)-6-t-butylphenol, 2,4,6-triisopropylphenol and 3,5-di-t-butyl-4-hydroxycinnamic acid), terpenes (camphol and limonene), benzoic acid methyl ester, 11-eicosenamide and 2,4-diphenyl-4-methyl-2(E)-pentene—were more concentrated in the UA samples. The differences that were reported in the two EBC fractions made an independent comparison of the three target cohorts advisable.
As mentioned previously, the compounds identified in EBC from the three groups under study (table 1) were used for multivariate analysis. In the unsupervised analysis, both EBC fractions led to a similar discrimination trend; nevertheless, intra-individual and inter-individual variability sources did not allow for a complete separation of the evaluated groups. In fact, the combination of PC1/PC2/PC3 did not explain above 50% of the total variability contained in the study in the different PCA tests. Concerning the supervised analysis, SVM was initially applied to build the prediction models listed in table 2. From a clinical point of view, the most interesting model to aid in the diagnosis of lung cancer is that comparing the lung cancer patients and the risk factor group. Attending to the recognition ability parameter, the DA fraction is characterized by a classification capability that is higher than that of the UA fraction. The model provided by the DA analysis is well balanced in terms of sensitivity and specificity, with these parameters being 75.5 and 70.5%, respectively. A similar situation was found in the comparison between the control healthy individuals and the risk factor individuals, since the sensitivity provided by the UA fraction was lower than that of the DA sample. With these premises, the EBC from the DA was characterized by a higher discrimination capability than that coming from the UA. For this reason, the DA fraction was selected for further studies dealing with the identification of significant compounds that contribute to the explanation of the observed patterns.
An unpaired t-test was applied to identify the most significant compounds that contribute to the explanation of the differences observed among the three groups (figure 1). Among the five compounds that were significant in the comparison of the lung cancer patients versus the risk factor group, it is worth noting the presence of two saturated monoacylglycerols (monopalmitin and monostearin) and an acyclic triterpenoid (squalene), which is the precursor of sterols, including cholesterol, and bile acids [30]. The presence of squalene in exhaled breath has been widely reported [31]. This compound is structurally similar to isoprene, which is considered one of the most concentrated compounds in human breath [22]. In fact, some authors have proposed that polyisoprenes such as squalene are potential sources of isoprene by peroxidation, one of the mechanisms of oxidative stress [31]. However, isoprene was not detected in EBC in this research, which could be explained by its high volatility. The differences in the relative concentrations of the two monoacylglycerols and the squalene in the three groups under study can be visualized in figure 5. Monopalmitin and monostearin were characterized by different behaviors: monopalmitin was more concentrated in the risk factor group than in the lung patients, who also presented a higher concentration of this monoacylglycerol than healthy individuals. On the other hand, monostearin offered an inverse profile, as the risk factor group showed a lower relative concentration than the lung cancer patients. Squalene showed a similar concentration profile to monopalmitin, which could explain the absence of the latter from the list of the 15 compounds with the highest selection frequency to discriminate lung cancer patients and risk factor individuals. The fourth compound (hexadecylindane, an indane derivative) has not been related to any endogenous source and, therefore, it could be ascribed to an exogenous origin. However, Phillips et al also detected indane derivatives in breath [32], and even they selected one of them as a biomarker for lung cancer [33]. In this research, hexadecylindane was the compound with the second highest selection frequency (after squalene) in a theoretical model for the discrimination of lung cancer patients and risk factor individuals. Concerning 13-heptadecyn-1-ol, no information about its presence in breath or its biological implications for human processes have previously been reported.

Figure 5. Box-and-whisker plots showing the variability of (A) four metabolites—13-heptadecyn-1-ol, monopalmitin, n-hexadecylindane, monostearin and squalene—in lung cancer patients when compared with all control individuals of the cohort, and (B) four metabolites—11-eicosenamide, p-cresol, indole, benzoic acid 4-ethoxy ethyl ester and triethyl citrate—in control individuals when compared with lung cancer patients and risk factor individuals.
Download figure:
Standard image High-resolution image
Taking the group of healthy individuals as a reference, seven compounds were shown to be significant in the comparison between the lung cancer patients and the risk factor group. Among them, triethyl citrate, which was detected at a higher concentration in lung cancer patients and risk factor individuals than in healthy individuals, has been found in cigarette filters; therefore, its presence in exhaled breath could only be linked to exogenous sources. The SVM model identified triethyl citrate in the list of compounds with the highest selection frequency to discriminate lung cancer patients and risk factor individuals. One phenolic compound (p-cresol) and a phenol derivative (benzoic acid 4-ethoxyethyl ester) were also found at different concentrations in the three groups. p-cresol was detected at a lower concentration in the lung cancer patients than in the risk factor individuals, who also reported lower levels than healthy individuals. The ester derivative of benzoic acid was found at a lower concentration in the lung cancer and risk factor individuals than in the healthy group. Philipps et al identified this compound as a candidate marker in human breath with the potential to discriminate lung cancer patients [33]. This result also agrees with that deduced in this research, since benzoic acid 4-ethoxy-ethyl ester was the compound with the highest selection frequency in the model comparing lung cancer patients versus control individuals.
One other interesting compound that was found was indole, which is involved in the metabolism of tryptophan, particularly in bacteria [34]. Additionally, indole has been found in cigarette smoke; therefore, it could also be associated with tobacco consumption [35]. The relative concentration profile of this compound was marked by a higher concentration in the risk factor group, followed by lung cancer patients, with a lower level in healthy individuals. Finally, one other compound that contributed to the differentiation of healthy individuals from lung cancer patients was eicosenamide, which was present at a lower level in this group as compared to the risk factor group and lung cancer individuals. This fatty amide had not been endogenously reported, but one analog such as oleamide, which was also found in EBC, is structurally related to the endogenous cannabinoid anandamide, which is involved in many biological functions. Eicosenamide was also characterized by its high selection frequency in a theoretical model for the discrimination of lung cancer patients from control individuals.
In summary, the great variety of compounds identified in EBC emphasizes the interest of this biofluid for clinical analysis. Although the identification of volatile compounds such as isoprene (which is detected in breath vapor) has not been possible, non-volatile and medium-volatility compounds have been identified, with most of them being of biological interest and having been previously identified in breath, e.g. fatty acids and conjugates that represent a highly metabolically active lipid class [36, 37]; volatile prenol lipid compounds such as camphol [38], limonene [39], linalool [32], α-cumyl alcohol [32] and terpineol [40]; and aromatic homomonocyclic compounds such as benzoic acid 4-ethoxy ethyl ester [32] or the aromatic heteropolycyclic compound indole [41]. Previous discrimination models based on exhaled breath analysis were characterized by the presence of essentially volatile compounds. With the analysis of EBC, a more varied composition of compounds with discriminant capability was attained.
In addition, the proposed methodology includes a data normalization strategy and a standardized sampling that avoids saliva and room-air contamination. In addition, the sampler used allows separation into two fractions, allowing the deletion of the one with the greater variability. Therefore, the potential of EBC as a biofluid for the clinical analysis of both volatile and non-volatile compounds to study respiratory diseases has been evidenced.
5. Conclusion
As previously mentioned, EBC has not been widely exploited in the clinical field despite the advantages associated with its sampling. A method for the metabolomic analysis of EBC based on GC–TOF/MS profiling in the high-resolution mode has been developed using liquid–liquid extraction for sample preparation. Tentatively identified compounds have been used to discriminate between three different groups: individuals diagnosed with lung cancer, risk factor individuals (including smokers) and control healthy individuals. Among the identified compounds, it is worth mentioning the presence of two monoacylglycerols, monostearin and monopalmitin, and squalene, which is an intermediate in the pathway for in vivo formation of human breath isoprene by peroxidation [42] and is also involved in the synthesis of cholesterol [43]. The results have shown the potential of EBC as a biofluid to discriminate between lung cancer patients and a risk factor group, which could help in the diagnosis of this disease and the search for a screening method that reduces the use of a confirmatory test for the case of a positive response.
Acknowledgments
The Spanish Ministerio de Economía y Competitividad (MINECO), Junta de Andalucía and FEDER program are gratefully acknowledged for financial support (projects 'Development of methods for early cancer detection, 29 December 2011' and 'Optimización y aplicación de plataformas metabolómicas de análisis de biofluidos no invasivos para la búsqueda de biomarcadores de diagnóstico precoz de cáncen de pulmón, FQM-1602'). AP-M and MC-S also thank these organizations for their research contracts. FP-C is also grateful to the Ministerio de Ciencia e Innovación (MICINN) for a Ramón y Cajal contract (RYC-2009–03921). Reina Sofía Hospital and its biorepository node (Córdoba, Spain) are also grateful for EBC samples.