

Abstract
Online breath analysis is an attractive approach to track exhaled compounds without sample preparation. Current commercially available real-time breath analysis platforms require the purchase of a full mass spectrometer. Here we present an ion source compatible with virtually any preexisting atmospheric pressure ionization mass spectrometer that allows real-time analysis of breath. We illustrate the capabilities of such technological development by upgrading an orbitrap mass spectrometer. As a result, we detected compounds in exhaled breath between 70 and 900 Da, with a mass accuracy of typically <1 ppm; resolutions between m/Δm 22 000 and 70 000 and fragmentation capabilities. The setup was tested in a pilot study, comparing the breath of smokers (n = 9) and non-smokers (n = 10). Exogenous compounds associated to smoking, as well as endogenous metabolites suggesting increased oxidative stress in smokers, were detected and in some cases identified unambiguously. Most of these compounds correlated significantly with smoking frequency and allowed accurate discrimination of smokers and non-smokers.
Export citation and abstract BibTeX RIS

Original content from this work may be used under the terms of the Creative Commons Attribution 3.0 licence. Any further distribution of this work must maintain attribution to the author(s) and the title of the work, journal citation and DOI.
Introduction
Exhaled breath contains valuable information about metabolic processes taking place within the human body. The development of suitable analytical tools to capture this information non-invasively could support the clinical diagnosis of various diseases in the near future [1–5]. Every exhalation contains hundreds of volatile compounds, including metabolites, inhaled exogenous substances and compounds produced in the oral cavity [6, 7]. Since Pauling discovered more than 200 different compounds in exhaled breath using gas chromatography-mass spectrometry (GC-MS) in the 1970s [8], interest in breath analysis has steadily grown. Over 800 compounds have been identified in exhaled breath of humans [9]. Apart from GC-MS, which is considered the workhorse in the field, several other techniques have evolved over the last decades to analyze breath, for example, electronic sensors, spectroscopic methods and ion mobility spectrometry [5].
Mass spectrometry-based methods provide the highest chemical selectivity, enabling the identification of breath metabolites. Real-time breath analysis is an advantageous approach to track physiological changes over short periods of time. One natural disadvantage accompanying real-time mass spectrometric methods is the lack of prior chromatographic separation. This compromises the identification of isobaric species, hence leading to a considerable loss of information when measuring with insufficient resolution. This is especially important in untargeted studies where one should ideally cover as many metabolites as possible.
Pioneering work from scientists at Sciex showed for the first time that their atmospheric pressure chemical ionization (APCI) mass spectrometer―dubbed TAGA (Trace Atmospheric Gas Analyzer)―had the potential to monitor breath metabolites in real-time [10–13]. TAGA no longer exists, but other mass spectrometric techniques have emerged which enable real-time analysis of trace gases. The most prominent techniques are proton transfer reaction-mass spectrometry (PTR-MS) [14] and selected ion flow tube-mass spectrometry (SIFT-MS) [15]. In SIFT-MS and PTR-MS, in contrast to APCI-MS, ionization of neutral analytes takes place at reduced pressure. As an alternative to PTR-MS and SIFT-MS, secondary electrospray ionization-mass spectrometry (SESI-MS) has shown to be suitable for the sensitive analysis of trace gases in real-time. As in the case of TAGA, the ionization of neutral vapors in SESI takes place at atmospheric pressure, but instead of a corona discharge, an electrospray of pure solvent produces the reactant ions [16, 17]. As a result, one can implement this technique on any commercially available atmospheric pressure ionization (API) mass spectrometer, without having to purchase an entire mass spectrometer. API-MS systems with very high performance are available in many laboratories, and for vapor analysis via SESI-MS one could thus take full advantage of the high performance in terms of sensitivity, mass resolution/mass accuracy and MS/MS capabilities of state-of-the-art mass spectrometry. However, most commercial API-MS systems are designed for the analysis of liquid samples. As a result, the implementation of SESI-MS often requires some modifications of the front-end hardware, compromising its widespread use. Despite this difficulty, some groups have used this method for vapor analysis in different applications [18–33]. To overcome this shortcoming, we have recently developed an optimized SESI add-on, which can be interfaced with virtually any commercial API-MS. This add-on is based on a particularly efficient design, termed low-flow SESI [34], was developed to be incorporated in a trace explosive detector for cargo containers [35]. Similarly, a number of devices are available on the market to implement different ionization strategies such as direct analysis in real time [36] or desorption electrospray ionization [37].
Here, we present the analytical capabilities of this SESI source when coupled to a high-resolution mass spectrometer. We interrogated the breath of smokers on non-smokers with the aim of illustrating the possibilities of this technology for breath research. One motivation is the high interest of clinicians in tests which allow reliable determination of an individual's smoking status. At present, the gold-standard test involves the measurement of blood or urine levels of cotinine [38], which is the primary metabolite of nicotine [39]. Hence, quicker and non-invasive methods to determine the current smoking status are highly desirable.
Experimental section
Online mass spectrometric measurements
The measurements were performed using a commercial, highly efficient low-flow SESI ion source module (SEADM, Spain; figure 1) [34], coupled to an unmodified LTQ Orbitrap (Thermo Fisher). The covered mass range was m/z 50–1000 and the resolving power ranged between 70 000 (at m/z 91) and 22 000 (at m/z 963). Measurements were done in positive ion mode. For chemical identification of some selected compounds, real-time breath MS/MS experiments were carried out using He as the collision gas.

Figure 1. The SESI ion source interfaced with an orbitrap mass spectrometer used for this breath analysis study.
Download figure:
Standard image High-resolution imageThe ion source featured a heated breath sampling Teflon tube (T = 190 °C, length 80 cm, i.d. 1.48 mm) with a manometer to monitor the exhalation pressure. After each exhalation, the SESI chamber and sampling line were flushed with nitrogen stemming from the MS curtain-gas flow. The SESI source comprises a heated core (T = 80 °C) and focusing and impactor plates (U1 = 2.6 kV, U2 = 1.3 kV) to guide the ions formed towards the MS inlet. Formic acid (Merck, 98–100%, p.a.) 0.1% in H2O (Merck, LiChrosolv®, for chromatography), was used as primary electrospray solvent. The emitter was a PicoTip™ TaperTip™ nanospray capillary (50 ± 3 μm).
Subjects and sampling
The stability of the setup was initially tested by monitoring a healthy subject over 3 h. A total of 10 non-smoking subjects (two females/eight males) and nine regularly smoking subjects (two females/seven males) participated in this study (anthropometric data included as supplementary data in table S1 (stacks.iop.org/JBR/10/016010/mmedia)). All measurements were collected within 10 d. To ensure repeatability, all subjects exhaled six times for 20 s each, with a pressure of 20 mbar (monitored by an electronic manometer visible to the subjects). The subjects were asked to not eat, smoke, brush their teeth, use chewing gum or drink anything except water within one hour prior to the measurement, in order to minimize confounding factors. Other potential confounding variables such as for example exposure to second-hand smoke were not considered. The study was approved by the local ethical committee (EK 2012-N-49) and all subjects gave written informed consent to participate.
Data analysis
Mass spectra preprocessing
Data processing was done using home-written MATLAB (R2014a, Mathworks Inc.) scripts. In order to be readable by MATLAB, the raw files were converted into the mzXML file format using MSConvert (Proteowizard) [40]. Then, a peak list was generated by shape-preserving piecewise cubic interpolation (107 data points) and summation of all spectra. Afterwards, the continuum mass spectra were centroided by summing the intensities around each peak within the full width at half maximum (FWHM). After a baseline adjustment in the time dimension for all peaks, a filter was applied to extract all features that increased during the exhalation phases. To accomplish this task, 4-hydroxy-2,6-nonadienal (m/z 155.1067) and 4-hydroxy-2-decenal (m/z 171.1381) were used as references because they were found to be present in each exhalation of all participants. For the smoker study, additional filtering was applied that eliminates all features, which are only present in fewer than 10 exhalations. Subsequently, the intensities within the last four exhalation phases of each subject were averaged, yielding the raw matrix of intensities (762 × 19, m/z × # of subjects). To correct for small instrumental fluctuations between the measurements, the matrix was normalized to the sum of intensities within the quantile range of 0.1 and 0.9, making the normalization more robust towards outliers [41]. This procedure (shown schematically in figure S1 of the supplementary data) yielded the final matrix used for further analysis.
Univariate analysis
Once the working data matrix had been assembled, we sought to identify breath compounds that were exhaled at different concentrations between the two groups investigated. Initially, a two-sample t-test was performed. Due to the limited sample size, 100 000 bootstrap samples were used to compute p-values for the 762 features. In addition, an estimate for the false discovery rate (FDR) was calculated using a linear step-up procedure originally introduced by Storey [42]. It followed a correlation analysis between the peak intensities and the smoking habits (i.e. cigarettes per day) of the subjects.
Smoking status prediction
Subsequently, we sought to determine whether the mass spectral breath prints could be used to predict smoking/non-smoking status. The prediction ability was assessed by performing a leave-one-out cross validation (LOOCV). Instead of using the entire data set for prediction, we implemented a feature selection procedure. It is important to note that the feature selection was also performed without the left-out sample to be truly unbiased. To identify the best predictors for the classification model a genetic selection algorithm was used. In short, a two-sample t-test was used as a filtering method [43]. One to three peaks were randomly selected as a training subset from all features with a p-value below 0.001 and tested in an inner leave-one-out cross validation. If the misclassification rate was below 10%, the peaks were selected as good predictors. This procedure was performed 500 times. The most frequently selected features were then used to classify the left-out sample. As classifier, we used a binary support vector machine algorithm [44].
Results and discussion
Real-time breath analysis by high resolution mass spectrometry
One of the main advantages of real-time breath analysis is that it provides a rapid response and therefore circumvents problems associated with sample collection, storage and manipulation. The price one pays is that some selectivity is sacrificed as compared to traditional GC-MS methods. One approach to minimize this drawback is to couple the real-time ionization source with a high resolution mass analyzer. To illustrate this point, we investigated the number of features detected in breath at increasing MS resolution. An orbitrap has the option of increasing resolving power at the cost of scan frequency and some sensitivity. Thus, we detected 660 breath features at a preset resolution of 7500, while at m/Δm = 30 000 it increased to 1020 features (i.e. +55%). Figure S2 of the supplementary data provides an overview of the number of features detected and scan frequencies for the different resolution settings.
To illustrate the importance of mass resolution to capture as many compounds as possible in real time, figure 2(a) shows an example of how four isobaric species are resolved at increasing resolving power. At a resolution of 7350 one peak is observable at m/z 300.0753. Inspection of the corresponding time-trace for this feature indicates that it clearly rises during three consecutive exhalation maneuvers (figure 2(b)). By increasing the resolution (e.g. Res ~ 147 000 at 300.0614), four distinct features are resolved. It turned out that all four resolved features rose upon exhalations (figure 2(b)). Hence, even at a typical time-of-flight (TOF) resolution (m/Δm = 5000), these fine details would have gone undetected in real-time measurements.
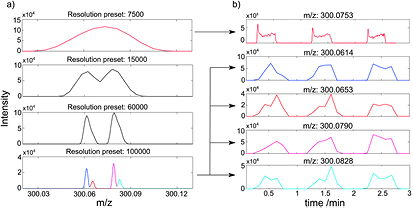
Figure 2. Resolving power of the mass analyzer is crucial for untargeted real-time breath analysis. (a) Mass spectra of exhaled breath recorded at increasing resolution; (b) the corresponding time traces for the top and the bottom features. Note how the signal rises as a result of the breathing maneuvers (mins 0.5, 1.5 and 2.5).
Download figure:
Standard image High-resolution imageAn initial stability test of one subject breathing frequently into the mass spectrometer during 3 h revealed that this novel SESI source can deliver robust analysis of breath vapors over extended periods of time and capture transient fluctuations. To illustrate this, figure 3 shows the signal intensity as a function of time (~11.00–14.00) for indole (tentative assignment), non-2-enal (previously characterized [45]) and an unidentified compound at m/z 479.4829 (C32H62O2). The overall increase of indole during the course of the morning was of a factor of 3, which is consistent with previous observations suggesting that indole breath concentration fluctuates closely in a circadian fashion [46]. In contrast, non-2-enal remained essentially unchanged, while the heavy species at m/z 479.4829 (C32H62O2) showed a decreasing tendency with time. Figure S4 of the supplementary data further illustrates the online detection of heavy species. It shows a mass spectrum including background chemical noise and breath signals. The inset shows one of such breath signals as a function of time for the ion m/z 670.1740, which corresponds to a molecular formula [C18H18O13N7]+. This assignment was supported by its nearly perfect match with the theoretical isotopic pattern. Expanding the coverage of exhaled molecules to species well above 200 Da is one of the main strengths of SESI-MS. However, given that the response to vapor detection is instrument-dependent, real-time quantification is not directly available [7], unless a calibration procedure using standard vapors is incorporated [21].
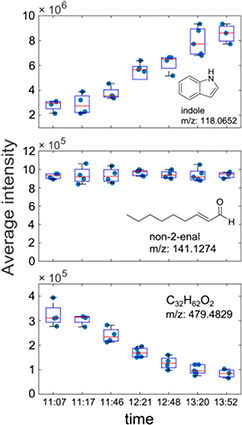
Figure 3. Temporal evolution of three exemplary compounds detected in breath of one subject at different time points plotted as boxplots (red = median, box = interquartile range, whiskers = range).
Download figure:
Standard image High-resolution imageReal-time breath analysis in smokers
To complete the evaluation of SEADM's ionizer, we further explored differences in smokers versus non-smokers in a pilot study. The t-test revealed 140 features with masses between 77 and 908 Da, which were significantly different (p < 0.05 and FDR < 0.05) between the two groups. Moreover, 100 out of these 140 features also showed a significant correlation (pcorr < 0.05) with smoking frequency (i.e. cigarettes per day). The top 62 features, which were found to be highly significant (p < 0.01 & upper 95%-CI(p) < 0.05 & FDR < 0.05) are listed in table S2. In total, 68 features were found to be significantly increased and 72 significantly decreased in the breath of smokers. Figure 4 displays the most significantly enhanced feature. It shows the raw mass spectra for all the participants in the region at m/z 114 (figure 4(a)). The corresponding box plot, showing the signal intensities after normalization, is shown in figure 4(b). A plot of signal intensity versus cigarettes/day suggests a strong correlation (r = 0.88; p < 8.6 × 10⁻⁷) between breath concentration of this particular compound and smoking frequency (figure 4(c)).
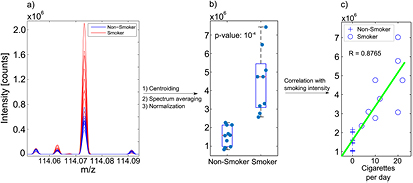
Figure 4. Differences between smokers and non-smokers: (a) overlaid breath mass spectra of all subjects in the region around the feature at m/z 114.0733; (b) box-plot of the average intensities per subject, split into smokers and non-smokers—this compound was significantly increased in smokers; (c) linear regression between the peak intensities of the feature at m/z 114.0733 and smoking frequency.
Download figure:
Standard image High-resolution imageA natural advantage accompanying the separation of isobaric species is that isotopic distributions can assist determining molecular formulae with higher confidence. The high mass resolution and accuracy of the orbitrap mass analyzer (<1 ppm) enabled the possibility of proposing molecular formulae for most of the highly significant features listed. Moreover, for the most abundant molecules, we conducted real-time MS/MS measurements, enabling unambiguous structural elucidation. For example, the highly discriminant compound shown in figure 4 was identified as trimethyl-silylacetonitrile. Figure 5(a) shows the overlaid mass spectra of the breath mass spectra and a standard in the region m/z 114–116. The insets show a closer view of the regions of interest, where a nearly perfect match of the isotopic distributions is observed. Note how the high resolution (R ~ 126 000 at 114.0733) enables resolving the isotopic peaks corresponding to 13C (m/z 115.0766) and 29Si (m/z 115.0729). The identification was further confirmed by MS/MS. Figure 5(b) shows the fragmentation spectra for the standard (top) and the breath signal (bottom). Both show a major fragment at m/z 73.047 corresponding to neutral loss of acetonitrile. To our knowledge, this is the first time trimethyl-silylacetonitrile has been reported in breath. This compound has not been reported in tobacco, either [47]. Nevertheless, its closely related compound acetonitrile is a well-known compound present in tobacco smoke as well as smokers' breath [48, 49].

Figure 5. High resolution/high mass accuracy and MS/MS capabilities enables structural elucidation of exhaled compounds: (a) isotopic distribution of trimethyl-silylacetonitrile standard (dashed line) and breath signal (solid line); (b) head-to-tail plot of the fragmentation spectra of trimethyl-silylacetonitrile standard (top) and breath signal (bottom).
Download figure:
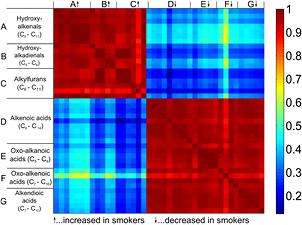
Standard image High-resolution imageFurther in-depth analysis revealed that most of the significant features were grouped in chemical families (i.e. –CH2-homologous series). In total, we identified seven significant homologous series: A (C5H8O2–C11H20O2), B (C5H6O2–C9H14O2), C (C6H8O–C11H18O), D (C6H10O2–C14H26O2), E (C5H8O3–C9H16O3), F (C7H10O3–C10H16O3) and G (C6H8O4–C10H16O4).
Figure 6 provides an overview of the relationships between the seven chemical families. It shows a heat-map of the correlation matrix between the identified homologous series. The first reassuring observation is the fact that within homologous series, the compounds are highly correlated. At the same time, we found that series A, B and C correlated with each other, whereas D, E, F and G formed another block of correlating compounds. Interestingly, series A, B and C were significantly increased in the breath of smoking subjects (table S3 of the supplementary data). Series A were 4-Hydroxy-2-alkenals and B 4-Hydroxy-dialkenals. For example, figure S3 of the supplementary data shows the MS/MS spectrum and theoretical and experimental isotopic pattern of hydroxy-2,4-hexadienal. This particular compound showed the highest average increase (1.84) in smokers within series B. Hydroxy-2,4-hexadienal is thought to be directly related to tobacco smoke because it is a metabolite of benzene, which is a prominent compound in tobacco smoke [47, 50]. Besides this exception, the rest of compounds of series A and B could be proxy indicators of oxidative stress [51]. This is indeed expected because oxidative stress is one of the main consequences of tobacco smoking [52, 53]. Among these compounds, we found 4-hydroxy-2-nonenal (p < 0.001), which is perhaps the most widely studied lipid peroxidation product [54]. While a number of methods exist to monitor 4-hydroxy-2-nonenal in tissues and breath condensate [55, 56], only recently it has been unambiguously detected in real time in breath [45]. The fact that all the compounds, except for C7H12O2, of the 4-hydroxy-2-alkenals (A) and 4-hydroxy-alkadienals (B) series correlate (p < 0.05) with smoking frequency suggests that the degree of oxidative stress was actually monitored by breath analysis. This is consistent with previous studies associating cigarette smoking and measures of lipid peroxidation such as breath ethane [57]. All these observations indicate that not only exogenous compounds (e.g. trimethyl-silylacetonitrile) attributable to smoke itself can be monitored, but also some of the physiological consequences of smoking.
Figure 6. Heat-map of the correlation coefficients between the –CH2-homologous series, which differ significantly (p < 0.05) between the breath of smokers and non-smokers.
Download figure:
Standard image High-resolution image
In contrast to the rest of the series identified, series C (i.e. alkyl-furan derivatives), are all exogenous compounds associated with tobacco smoke [58]. Herein we observed alkylfurans with alkyl-residues expanding from C2 (i.e. ethylfuran or dimethylfuran) to C7, all being significantly increased in exhaled breath of smokers. Consistently with previous GC-MS breath studies [59], we found the smallest compounds of the series to be highly discriminating and, except for C10H16O, the whole family highly correlating with smoking frequency.
In contrast to the hydroxyl-alkenals, hydroxy-alkadienals and alkylfurans, series D, E, F and G were all significantly less abundant in the breath of smokers. Hence, it is reasonable to attribute them to a systemic origin rather than smoke/tobacco constituents. These series of compounds were all fatty acids (detected as [M + NH4]+ adduct). These series were assigned to alkenoic acids (D), oxo-alkanoic acids (E), oxo-alkenoic acids (F) and alkendioic acids (G). The reasons why these compounds are systematically decreased in the breath of smokers are unclear. The fact that fatty acids are common precursors of aldehydes in lipid peroxidation routes suggests that the series of aldehydes A and B are enhanced in smokers at the cost of decreased levels of lipids. The connection of these compounds via metabolic routes, however, remains to be established. Along the same lines, prior metabolomics studies have suggested significantly altered profiles of plasma fatty acids profiles for smokers [60].
Finally, when we attempted to predict smoking status based of the breathprints, the feature selection and classification algorithm yielded an out-of-sample classification rate of 100% (sensitivity = 1, specificity = 1). The chosen predictors with their selection frequency in parenthesis were m/z 121.0317 (17), 114.0733 (14), 187.1147 (4), 113.0597 (2), 114.0631 (2), 115.0729 (1). The most frequently chosen predictor corresponds to a molecular formula of C4H8O2S (0.4 ppm). The fact that this compound was found almost exclusively in the breath of smokers suggests an exogenous origin. While it could not be unambiguously identified, it might correspond to 1,1-dioxide-tetrahydrothiophene (sulfolan) because it is a known compound in tobacco smoke [47]. The second most frequently selected predictor was trimethyl-silylacetonitrile. Not surprisingly, its isotope at 115.0729 Da was also chosen once as a predictor. For the third predictor (m/z 187.1147), we found two possible formulae, C9H18O2Si (1.2 ppm) and C10H18OS (2.4 ppm). However, the signal intensity was too low to confirm unambiguously the molecular formula based on its isotopic pattern. Despite the relatively high mass shift, a database and literature search indicated the latter as the more plausible formula, as 8-mercapto-p-menthan-3-one is a compound that has been reported in tobacco. The features m/z 113.0597 and 114.0631 correspond to the benzene metabolite 4-hydroxy-2,4-hexadienal (figure S3 of the supplementary data). Follow-up measurements should be conducted to assess the prediction power of these four compounds.
Conclusions
We present a breath analysis evaluation of a commercial add-on to upgrade a pre-existing atmospheric pressure ionization mass spectrometer with a SESI source meant to analyze vapors at trace levels in real-time. As a result, (i) we were able to measure around 1000 breath features per subject, including species heavier than 900 Da, thus greatly expanding the available mass range of current state-of-the-art on-line breath analysis; (ii) the high resolution/high mass accuracy and MS/MS capabilities of the mass analyzer enabled us to provide molecular formulae and in some cases unambiguous identification of breath compounds; (iii) in a pilot study including nine smokers and 10 non-smokers, we detected multiple compounds in exhaled breath that were highly correlated with smoking frequency. Exogenous compounds as well as systemic metabolites related to oxidative stress were identified, suggesting that both tobacco chemicals as well as physiological implications of smoking could be simultaneously detected; (iv) such detailed instantaneous breathprints enabled predicting smoking/non-smoking status with 100% accuracy.
Acknowledgments
We gratefully acknowledge Dr J Zhang (Novartis AG) for the donation of the LTQ orbitrap instrument used in this study and the European Community's Seventh Framework Programme (FP7-2013-IAPP) for funding the project 'Analytical Chemistry Instrumentation Development' (609691). We are indebted to Christoph Baertschi (ETH workshop) for his assistance machining the ion source.