

Abstract
Despite evidence of the air pollution effects on cognitive function, little is known about the acute impact of indoor air pollution on cognitive function among the working-age population. We aimed to understand whether cognitive function was associated with real-time indoor concentrations of particulate matter (PM2.5) and carbon dioxide (CO2). We conducted a prospective observational longitudinal study among 302 office workers in urban commercial buildings located in six countries (China, India, Mexico, Thailand, the United States of America, and the United Kingdom). For 12 months, assessed cognitive function using the Stroop color-word test and addition–subtraction test (ADD) via a mobile research app. We found that higher PM2.5 and lower ventilation rates, as assessed by CO2 concentration, were associated with slower response times and reduced accuracy (fewer correct responses per minute) on the Stroop and ADD for eight out ten test metrics. Each interquartile (IQR) increase in PM2.5 (IQR = 8.8  g m−3) was associated with a 0.82% (95% CI: 0.42, 1.21) increase in Stroop response time, a 6.18% (95% CI: 2.08, 10.3) increase in Stroop interference time, a 0.7% (95% CI: −1.38, −0.01) decrease in Stroop throughput, and a 1.51% (95% CI: −2.65, −0.37) decrease in ADD throughput. For CO2, an IQR increase (IQR = 315 ppm) was associated with a 0.85% (95% CI: 0.32, 1.39) increase in Stroop response time, a 7.88% (95% CI: 2.08, 13.86) increase in Stroop interference time, a 1.32% (95% CI: −2.3, −0.38) decrease in Stroop throughput, and a 1.13% (95% CI: 0.18, 2.11) increase in ADD response time. A sensitivity analysis showed significant association between PM2.5 in four out of five cognitive test performance metrics only at levels above 12
  g m−3. Enhanced filtration and higher ventilation rates that exceed current minimum targets are essential public health strategies that may improve employee productivity.
Export citation and abstract BibTeX RIS

Original content from this work may be used under the terms of the Creative Commons Attribution 4.0 license. Any further distribution of this work must maintain attribution to the author(s) and the title of the work, journal citation and DOI.
1. Introduction
A growing body of evidence is showing associations between air pollution and impaired cognitive function. Outdoors, evidence is starting to emerge that chronic exposure to fine particulate matter (PM2.5) may also impact cognitive performance through impacts to the central nervous system (CNS) (Block and Calderón-Garcidueñas 2009). Ambient air pollution can penetrate indoors, where most exposures can occur due to the high percentage of time spent indoors. The extent to which ambient pollution penetrates and accumulates indoors is influenced by ventilation, infiltration, and filtration (Ben-David and Waring 2016). Consequently, building design and operations can affect indoor exposures to CO2 and PM2.5, impacting building occupants' cognition.
Researchers have recently identified associations between exposure to PM2.5 and various effects on the CNS and neurodegeneration (Block and Calderón-Garcidueñas 2009). A hypothesized mechanistic pathway is that inhalation of PM2.5 may lead to a level of chronic, systemic inflammation that impacts the CNS. This hypothesis is supported by animal studies that have detected inflammatory biomarkers in the brain after exposure to PM2.5 and ultrafine PM, as they may be capable of crossing the blood–brain barrier (Campbell et al 2005). Epidemiological studies among older adults have found that chronic exposure to outdoor PM2.5 is associated with a higher prevalence of neurocognitive development outcomes (Freire et al 2010) and neurodegenerative diseases in adults (Jayaraj et al 2017), the decline of cognitive function among older adults (Power et al 2011, Weuve 2012). More recently a short-term association of PM2.5 and cognitive function among older men in the Normative Aging Study was reported (Gao et al 2021). Effects of PM2.5 on neurocognitive performance have also been found in younger populations, including fetuses (Guxens et al 2014), school-age children (Saenen et al 2016), and adolescents (Kicinski et al 2015).
Inside buildings, other pollutants beyond PM2.5 are often found in higher concentrations than outdoors due to the limited dilution capacity of enclosed spaces. Controlled environmental exposure studies among office workers have found independent and monotonic effects of same-day CO2 concentrations, as well as effects of CO2 as a subrogate of ventilation rates, on several domains of cognitive function (Satish et al 2012, Allen et al 2016). The mechanism explaining the effects of CO2 as an independent pollutant or as a proxy for ventilation rates on cognitive function at relatively low concentrations (<3000 ppm) is still not fully understood. It is hypothesized that elevated CO2 in the bloodstream resulting from ambient exposure (Vehvilainen et al 2016) results in sympathetic activation of the autonomic nervous system (MacNaughton et al 2016). Activation of the sympathetic nervous system influences cognitive performance, including strategy and working memory (Starcke and Brand 2012).
Despite the growing evidence of the effects of air pollution on cognitive function, most studies have focused on chronic exposures, exposures during early life or among seniors, and outdoor exposures rather than indoor exposures, where people spend 90% of their time (Klepeis et al 2001). There is scarce information about the acute effects of indoor air pollution on cognitive function among the working populations or whether the effects are observed even at low exposure levels. These questions are especially relevant for the working-age population since even small effects in cognitive function could translate into substantial short- and long-term economic and productivity losses. To investigate whether cognitive function was associated with real-time indoor concentrations of PM2.5 and CO2, we measured the cognitive performance and indoor air quality among office workers in six countries during a 12 month prospective longitudinal cohort study.
2. Methods
2.1. Study design
This investigation was part of the Global CogFx study, a prospective observational longitudinal study conducted between May 2018 and March 2020 among office workers from a convenience sample of urban commercial buildings located in six countries (China, India, Mexico, Thailand, the United States of America [USA], and the United Kingdom [UK]). For 12 months, we collected indoor environmental data using low-cost real-time monitors in the office buildings. We administered ecologic momentary assessments of cognitive function, health, and satisfaction with the indoor environment via a custom-developed mobile research app for this study (ForHealth App, AppLab, Boston, MA, USA). We invited participants to complete a total of 15 min of study activities (i.e. cognitive tests and surveys) per week in the app during regular work hours (Monday thru Friday, 9 am–5 pm local time). The app used the phone's GPS location to verify their presence in their office building when completing a study activity. Study activities were prompted based on a prescheduled time or a priori set of target values for the environmental variables of interest. Once prompted, participants had one hour to complete the study activity; otherwise, the activity would be reprogrammed for another day at the same time or whenever the predefined environmental target was met again.
Study surveys and cognitive tests were tallied as points in the app to incentivize participation, and participants received periodic compensation upon reaching certain thresholds. Participants also received a wearable device to track physical activity (Fitbit Charge 2, San Francisco, CA, USA); however, that data was not relevant for this investigation.
2.2. Study population
Companies with office buildings were eligible to participate in the Global CogFx study if they had ten or more employees and agreed to install a network of indoor environmental sensors. These companies either owned or leased a portion of the building or in some cases the entire building. Companies in knowledge work fields, such as architecture, technology, real estate investment, coworking, and engineering, expressed interest in participating. In total, 43 buildings were recruited; this analysis includes 42 buildings since one building in the US was excluded because the sensor package installed did not include a PM2.5 sensor. Table 1 shows details on the participation levels per country.
Table 1. Building and participant characteristics by country.
| Variable | All countries | China | India | Mexico | Thailand | UK | USA |
|---|---|---|---|---|---|---|---|
| Personal demographics | |||||||
| Participants | 302 | 34 | 68 | 8 | 10 | 49 | 133 |
| Age n (%) | |||||||
| 18–29 | 110 (36.4) | 16 (47.1) | 29 (42.6) | 3 (37.5) | 4 (40) | 23 (46.9) | 35 (26.3) |
| 30–39 | 125 (41.4) | 16 (47.1) | 29 (42.6) | 4 (50) | 6 (60) | 14 (28.6) | 56 (42.1) |
| 40–49 | 43 (14.2) | 2 (5.9) | 7 (10.3) | 1 (12.5) | 0 (0) | 11 (22.4) | 22 (16.5) |
| 50–59 | 22 (7.3) | 0 (0) | 3 (0) | 0 (0) | 0 (0) | 1 (0) | 18 (0) |
| 60+ | 2 (0.7) | 0 (0) | 0 (0) | 0 (0) | 0 (0) | 0 (0) | 2 (0) |
| Job category n (%) | |||||||
| Managerial | 62 (20.5) | 5 (14.8) | 22 (32.4) | 2 (25) | — | 8 (16.3) | 26 (19.4) |
| Professional | 162 (53.6) | 9 (26.5) | 6 (38.2) | 6 (75) | 5 (50) | 28 (57.1) | 91 (68.7) |
| Technical | 48 (15.9) | 9 (26.5) | 14 (20.6) | — | 3 (33.3) | 10 (20.4) | 7 (5.2) |
| Secretarial or clerical | 22 (7.3) | 10 (29.4) | 4 (5.9) | — | 2 (16.7) | 1 (2) | 7 (5.2) |
| Other | 8 (2.6) | 1 (3) | 2 (3) | — | — | 2 (4.1) | 2 (1.5) |
| Educational level n (%) | |||||||
| Incomplete college | 14 (4.7) | 4 (11.8) | 4 (5.9) | — | — | 4 (8.1) | 2 (1.5) |
| 2 year degree | 9 (3) | 1 (3) | 3 (4.4) | — | — | 2 (4.1) | 3 (2.2) |
| 4 year degree or professional degree | 149 (49.2) | 14 (41.2) | 30 (44.1) | 8 (100) | 10 (100) | 19 (38.7) | 72 (54.4) |
| Graduate degree | 130 (43.1) | 15 (44.2) | 31 (45).6 | — | — | 24 (48.9) | 56 (41.8) |
| Buildings characteristics | |||||||
| n | 42 | 8 | 10 | 1 | 1 | 6 | 16 |
| Cities (# buildings) | 30 | Chengdu (3), Shanghai (3), Zhuhai (2) | Bengaluru (5), Chennai (1), Gurugram (1), Hyderabad (1), Mumbai (1), Pune (1) | Culiacan (1) | Bangkok (1) | Croydon (2), Birmingham (1), Cambridge (1), London (1), Sheffield (1) | LA (2), San Francisco (2), Boston (1), Clearwater (1), Chicago (1), Cleveland (1), Denver (1), Minneapolis (1), NYC (1), Omaha (1), Overland Park (1), Phoenix (1), Seattle (1), Washington DC (1) |
In each building, recruitment was conducted on a rolling basis until the building recruitment target of ten participants was met. The research team tried to ensure that participants within a building were balanced in terms of age and sex. Participant eligibility criteria included being between 18 and 65 years of age, speaking one of the languages in the study (English, Chinese, or Spanish), having a smartphone compatible with the study's research app, having a full-time position at the company, have a permanent workstation in the office and working there for at least 3 days a week, not being colorblind, and not being a current smoker. The analysis was limited to participants with two or more tests to eliminate any 'first test' effects where participants were getting familiar with the app and test format. Limiting the analysis to those with two or more tests allows us to consider the first test as training and reduce a potential confounding effect of test learning with the exposure (Goldberg et al 2015). Figure 1 shows the number of participants that met the eligibility criteria for this analysis. Our study protocols were General Data Protection Regulation (GDPR)-compliant and were reviewed and approved by the Institutional Review Board at the Harvard T.H. Chan School of Public Health.

Figure 1. Flowchart of study inclusion criteria.
Download figure:
Standard image High-resolution image2.3. Air quality assessment
Real-time, commercial-grade environmental sensors were installed at or near the participants' workstations. The installation took place by one member of the research team or by a point of contact at the participating building with remote assistance from the research team. All sensors were installed away from heat sources, drafts, direct solar irradiation, and at the approximate breathing zone height of a seated individual (0.8–1.5 m). Each building received the same type of sensor package for the participants. However, due to differences in connectivity and network security requirements that varied by building, a total of six different sensor packages were used across the buildings included in this analysis (table 2). This analysis only includes buildings with sensor packages measuring PM2.5, CO2, temperature, and relative humidity, excluding one building in the USA with a sensor package without a PM2.5 sensor. All sensor packages had to be equipped with a pre-calibrated, laser-based light scattering particle sensing unit for PM2.5 measurements and a non-dispersive infrared CO2 sensor with an automatic background calibration algorithm and had to send data to a cloud database every 10 min.
Table 2. Summary of environmental sensor packages and hourly measurements associated with participant responses to cognitive tests by country.
| Variable | All countries | China | India | Mexico | Thailand | UK | USA |
|---|---|---|---|---|---|---|---|
| Sensor package types | Six sensor package types | Tsinghua IBEM, Harvard Healthy Buildings | Harvard Healthy Buildings/ Academia Sinica, Awair Omni | Harvard Healthy Buildings, Awair Omni | Obotrons | Harvard Healthy Buildings, Awair Omni | Harvard Healthy Buildings, Awair Omni, ChemiSense CS-001, Tongdy MSD-16 |
| Environmental factor | |||||||
| Geometric mean (IQR) | |||||||
| PM2.5 (μg m−3) | 5 | 16.6 | 14.2 | 9.9 | 9.7 | 1.8 | 2.9 |
| (0.2–9.0) | (6.3–29.7) | (8.5–20.0) | (6.5–25.0) | (0.0–21.0) | (0.0–2.0) | (0.2–6.0) | |
| CO2 (ppm) | 723.1 | 552 | 951.4 | 781.2 | 715 | 803.1 | 638.6 |
| (580.0–895.0) | (489.0–663.4) | (723.0–1124.0) | (427.0–1289.0) | (609.0–836.0) | (669.0–870.0) | (543.0–730.0) | |
| Temperature (°C) | 24.6 | 26.1 | 25.7 | 25.9 | 27.4 | 24.9 | 23.6 |
| (23.6–26.1) | (24.9–23.2) | (24.7–26.6) | (24.6–28.15) | (27.1–28.2) | (24.3–26.3) | (22.7–24.7) | |
| Relative humidity (%) | 40.6 | 54.9 | 44.6 | 66.7 | 49.2 | 36.6 | 37.6 |
| (32.3–48.2) | (42.0–76.9) | (40.0–51.8) | (43.1–79.6) | (45.7–50.5) | (29.0–41.4) | (28.1–47.2) |
Pre-installation quality assurance and quality control (QA/QC) procedures included a visual comparison of real-time data by collocating at least one unit per brand of sensor package next to recently calibrated reference instruments (for PM2.5 sensors: TSI DustTrak, TSI Instruments, USA; for CO2 sensors: QTrak 7575; TSI Instruments, USA). Post-data collection QA/QC included visual inspection of time-series data. Due to reported limitations of several sensor units at higher concentrations, environmental data within the 99th percentile for PM2.5 (<80 μg m−3) and within the 97.5th percentile for CO2 (<2500 ppm)were considered for this analysis (Demanega et al 2021). Values below 0 were censored for PM2.5 and below 400 ppm for CO2 data.
2.4. Cognitive function assessment
Two types of self-administered cognitive tests were sent to participants via the study mobile app: (a) the Stroop color-word test evaluating selective attention and inhibitory control, and (b) a two-digit, visual addition–subtraction (ADD) test evaluating cognitive speed and working memory. These tests have been used in previous assessments of cognitive function due to their sensitivity to indoor environmental quality parameters (Saenen et al 2016, Cedeño Laurent et al 2018). Each Stroop test consisted of 20 trials of congruent, incongruent, and neutral word-color stimuli, shown above four touch button icons with the color choices of the words shown (i.e. blue, red, green, and yellow). Participants were instructed to respond as fast as possible to the button icon of the displayed color, not the written color word. ADD test consisted of ten trials of two-digit addition and subtraction problems. Test trials were randomized in order and content while keeping the same ratio of congruent-to-incongruent trials for the Stroop and additions-to-subtractions for the ADD to standardize difficulty between assessments.
Each cognitive test type was prompted according to a set of prescheduled times or based on a predefined set of environmental conditions detected by the environmental sensor to ensure variability in the exposure conditions observed. Two environmental target levels were evaluated per environmental exposure of interest: for PM2.5, the 'low' and 'high' targets corresponded to indoor concentrations of below 50% (<6 μg m−3) and above 100% (>12 μg m−3) of the US National Ambient Air Quality Standard (NAAQS). For CO2, the 'low' and 'high' targets corresponded to <600 ppm and >950 ppm, respectively. Significant differences in cognitive function between these two levels have been previously found (Allen et al 2016). In total, each cognitive test type was prompted up to 36 times during the 12 month study period. However, the total number of tests prompted to each participant varied depending on how often the target environmental conditions were met. Stroop test metrics included response time, inhibitory response time (i.e. the difference in response times between congruent and incongruent trial times), and throughput (number of correct responses per minute). ADD test metrics included response time and throughput (number of correct responses per minute). For both tests, we censored individual trials with response times three standard deviations from the global mean, as done in previous studies using digital versions of cognitive tests (Linnman et al 2006). Table S1 shows a summary of the participation levels per test and summary cognitive test metrics (available online at stacks.iop.org/ERL/16/094047/mmedia).
2.5. Statistical methods
Generalized additive mixed models were used to quantify the individual effects of PM2.5 and CO2 on each of the five cognitive test metrics of interest. The CO2 term combines the direct effect of CO2 and the indirect effect of ventilation rate, as ventilation rate and CO2 concentrations are highly correlated. Participant ID and building ID were treated as nested random effects to account for the unexplained population heterogeneity and expected correlation between measurements taken from the same individual and individuals within the same building. Cognitive test metrics were time-matched to the corresponding mean hourly values of PM2.5, CO2, and temperature measured by the respondents' sensor. Whenever an environmental measurement was missing, the value was imputed from the same-hour average of other sensors near the respondent's workstation. The models controlled for temperature (included in the model as a natural spline term with three degrees of freedom) and included the number of the assessment to account for learning effects. Adjusted models included hour of the day and month of the year as natural splines with five degrees of freedom to control circadian and seasonal effects. The adjusted models also controlled for personal characteristics (i.e. age, gender, educational level, and job category) and building characteristics (i.e. number of people in the room and workstation type). We evaluated the non-linear effects of PM2.5 and CO2 on cognitive test metrics using penalized splines with three degrees of freedom in the model. All cognitive test metrics were log-transformed to meet the assumption of normality. The obtained effect estimates represent the percent change in the geometric mean of the models' outcome variables from a one-unit change in the explanatory variables. Due to the stratification between participating buildings according to their indoor PM2.5 levels, we did a sensitivity analysis to separately evaluate the effects of PM2.5 on cognitive function under low and high PM2.5 levels. We refitted the adjusted model using a piecewise regression with a breakpoint at 12  g m−3, the US NAAQS for average annual concentration for each cognitive test outcome. We performed diagnostics of the mixed models, including an assessment of the intra-class correlations (ICC) of the random effects to understand the degree of clustering at the building and individual level and a comparison of the marginal and condition R-squared values to assess the degree of explained variance from the fixed and the combined fixed and random effects, respectively. All model results show normally distributed and homoscedastic residuals. We set a threshold for statistical significance at p < 0.05 for the main analyses (two-tailed tests). All statistical analyses were completed in R (version 4.0.3).
3. Results
Table 1 summarizes the participant information at the building level. In general, the study had balanced participation by gender (Females = 58%), despite some countries where females were overrepresented (e.g. China and Thailand). Most of the participants (92.3%) had a high educational level, either with a 4 year college degree or graduate education. Table 2 provides summary statistics of the indoor environmental data. Between countries, we found more similarities in the levels of CO2 than PM2.5. There was little variance in exposure (i.e. UK) and no overlap between the countries' IQR in some cases. Regarding temperature and relative humidity, the values are largely within previously observed values in indoor environmental quality investigations of office buildings (Apte et al 2000, MacNaughton et al 2017).
Five cognitive performance metrics of office workers were significantly associated with real-time indoor concentrations of PM2.5 and CO2 (figure 2). For Stroop, response time was significantly associated with CO2 and PM2.5 concentrations. An interquartile (IQR) increase in CO2 (IQR = 315 ppm) was associated with a 1.92% (95% CI: 1.39, 2.46) and a 0.85% (95% CI: 0.32, 1.39) increase in response time for the unadjusted and adjusted Stroop models, respectively. For PM2.5, an IQR increase (IQR = 8.8  g m−3) was associated with an increase of 0.78% (95% CI: 0.39, 1.17) and 0.82% (95% CI: 0.42, 1.21) in the unadjusted and adjusted models of Stroop response time. The interference effect, measured as the difference between congruent and incongruent response times, was associated with both air quality parameters. For each IQR increase in CO2 and PM2.5, the adjusted model estimates showed a 7.88% (95% CI: 2.08, 13.86) and a 6.18% (95% CI: 2.08, 10.3) increase in interference time, respectively. Regarding Stroop throughput, an IQR increase in CO2 was associated with a 1.32% (95% CI: −2.3, −0.38) decrease in the adjusted model; an IQR increase in PM2.5 had a decrease of 0.7% (95% CI: −1.38, −0.01) in Stroop throughput. When evaluating non-linearity in the association between exposure and cognitive performance metrics, we found a significant non-linear association between CO2 and Stroop response time and Stroop throughput (figure 3). We observed a linear association between 400 and 1200 ppm. The association is not well-defined after 1200 ppm due to the low number of measurements collected above that concentration (CO2 95th percentile = 1363.0 ppm).
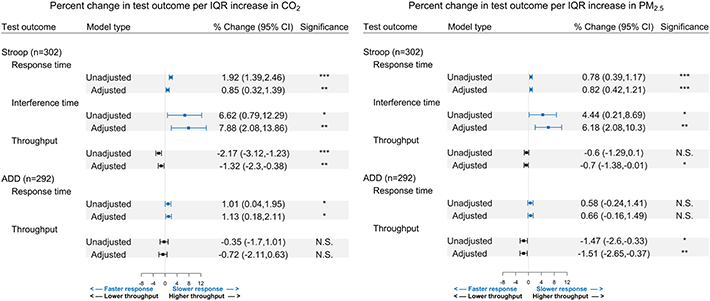
Figure 2. Associations between acute PM2.5 and CO2 exposure on log-transformed Stroop and ADD tests performance. Adjusted model covariates include temperature, age, gender, educational level, job category, workspace type, occupants in the respondents' room, hour, and month. Results shown represent the percent change in the geometric mean of each test outcome per IQR increase in PM2.5 (IQR = 8.8  g m−3) and CO2 (IQR = 315 ppm). (*=p < 0.05; **=p < 0.01; ***=p < 0.001).
Download figure:
Standard image High-resolution image
Figure 3. Association between log-transformed Stroop response time and Stroop throughput and CO2 exposure using natural splines with three degrees of freedom. Grey shading represented the 95% confidence interval. Dashed lines represent the CO2 quartiles (Q1 = 25%, Q2 = 50%, Q3 = 75%). Adjusted covariates include temperature, age, gender, educational level, job category, workspace type, occupants in the respondents' room, hour, and month.
Download figure:
Standard image High-resolution image
For the ADD test, increases in CO2, but not in PM2.5, were significantly associated with slower response times. For an IQR increase in PM2.5, there was a 0.66% (95% CI: −0.16, 1.49) non-significant increase in the adjusted model ADD response time. For each IQR increase in CO2, there was a 1.13% (95% CI: 0.18, 2.11) increase in the adjusted ADD response time. For ADD throughput, an IQR increase in PM2.5 was significantly associated with lower ADD throughput (−1.51%, 95% CI: −2.65, −0.37); an IQR increase in CO2 resulted in a non-significant decrease 0.72% decrease in ADD throughput (95% CI: −2.11, 0.63).
Table 3 reports the stratified associations between low (<12  g m−3) and high (⩾12 μg m−3) PM2.5 levels and Stroop and ADD test performance. At PM2.5 levels equal to or above 12 μg m−3, an increase in PM2.5 concentrations was significantly associated with lower performance on four out of five cognitive test outcomes. Overall, the effects at low PM2.5 levels were similar directionally and magnitude to those at high concentrations, although none of the associations were statistically significant.
Table 3. Associations between log-transformed Stroop and ADD response times and PM2.5 using a piecewise linear regression with a breakpoint at the NAAQS PM2.5 primary annual average standard with a level of 12.0 μg m−3. Results show the percent change in the geometric mean of each test outcome for an IQR increase in PM2.5 (IQR = 8.8  g m−3). (*=p < 0.05; **=p < 0.01; ***=p < 0.001).
| Stroop test | ADD test | ||||
|---|---|---|---|---|---|
| % change per IQR increase (95% CI) | % change per IQR increase (95% CI) | ||||
| PM2.5 level | Response time | Interference time | Throughput | Response time | Throughput |
| PM2.5 < 12 μg m−3 | 0 | 3.88 | −0.1 | 0.59 | −0.97 |
| (−1.88, 0.36) | (−9.77, 16.08) | (−2.14, 1.94) | (−2.85, 4.04) | (−3.86, 2.00) | |
| PM2.5 ⩾ 12 μg m−3 | 0.73 | 5.76 | −0.77 | 0.9 | −1.5 |
| (0.33, 1.13)*** | (1.89, 11.20)** | (−1.47, −0.08)* | (−0.15, 1.95) | (−2.59, −0.33)* | |
The standard deviation, intraclass correlation of the multi-level random effects, and marginal and conditional R-squared values from the five main adjusted models are presented in table 4. The between-participant variance is higher than the between-building variance in all models. Also, the ICC at the participant level is consistently higher than at the building level, suggesting that the clustering between participants accounts for a larger proportion of the variance than the between-building clustering. The fixed effects explained a larger proportion of the outcome variability in the Stroop test than in the ADD test. The random-effects had more explanatory power for all models than the fixed effects, which is supported by the higher variability observed in the between-participants random intercept.
Table 4. Random effects and model diagnostics from adjusted hierarchical general additive models for continuous Stroop and ADD test performance metrics.
| Stroop models | ADD models | ||||
|---|---|---|---|---|---|
| Response time | Interference time | Throughput | Response time | Throughput | |
| Random effects (standard deviation) | |||||
| Intercept | 0.14 | 0.22 | 0.13 | 0.21 | 0.19 |
| Participant level | |||||
| Intercept | 0.09 | 0.001 | 0.07 | 0.12 | 0.11 |
| Building level | |||||
| Intraclass correlation coefficient (%) | |||||
| Participant level | 0.17 | 0.04 | 0.46 | 0.21 | 0.46 |
| Building level | 0.07 | 0 | 0.12 | 0.07 | 0.15 |
| Marginal R-squared | 0.16 | 0.04 | 0.35 | 0.03 | 0.07 |
| Conditional R-squared | 0.4 | 0.08 | 0.75 | 0.3 | 0.64 |
4. Discussion and conclusion
This 1 year longitudinal study investigated the acute effects of low-level indoor PM2.5 and CO2 exposures on the cognitive function of 302 office workers in six countries around the world. We found significant associations of selective attention (Stroop) and processing speed (ADD) with exposure to these pollutants indoors, at concentrations commonly observed indoors.
PM2.5 levels indoors result from a combination of indoor and outdoor sources. Indoor sources of PM2.5 include resuspension of settled dust, indoor smoking, cooking, and secondary generation from cleaning products; however, many indoor sources are less prevalent in office buildings than other building types (Patel et al
2020). PM2.5 of outdoor origin also penetrates indoors depending on several building-related factors, such as ventilation, infiltration, and filtration. In cities and countries with high levels of outdoor PM2.5, levels indoors often exceed health-based limits (Cohen et al
2017, Song et al
2017, Balakrishnan et al
2019). In our study, China, India, Thailand, and Mexico, the annual outdoor PM2.5 mean concentrations exceed the NAAQS annual mean standard of 12  g m−3 and WHO air quality guideline value of 10
  g m−3 (Shaddick et al
2018). For comparison, in our study, the median of hourly indoor PM2.5 concentrations during work hours in India and China were 8.0 and 18.0
g m−3 (Shaddick et al
2018). For comparison, in our study, the median of hourly indoor PM2.5 concentrations during work hours in India and China were 8.0 and 18.0  g m−3, respectively. In contrast, the median of hourly concentrations during work hours in the US and the UK was 1.7 and 1.0
  g m−3, respectively.
We found that higher indoor PM2.5 levels were significantly associated with decreased performance in Stroop response time, interference time, and throughput, and lower ADD throughput. Our results are consistent with previously published work. In an experimental study, Shehab and Pope found an association between selective attention from the exposure to candle-generated indoor PM and exposure to traffic pollution (Shehab and Pope 2019). The authors reported no significant effects on the Stroop color-word test, but the study may have been underpowered given their small sample size (n = 33). A study in Belgian classrooms investigating the acute effects of indoor PM2.5 on cognitive function found a 3% increase in Stroop response times associated with an increase in 8 μg m−3 PM2.5 (Saenen et al 2016). For the same increase in PM2.5 concentration, we found an increase of 0.8% in Stroop response times. Observing these effects in working-age adults was novel, as research often focuses on children and older adults. It is often hypothesized that these populations are more susceptible to the neurocognitive effects of air pollution due to their developing or declining CNS functions. The higher magnitude of the association in younger children compared to adults might support such an argument.
We found that higher CO2 levels in office buildings were associated with decreased performance in all Stroop test metrics, and increased ADD response times. Our findings are consistent with and expand upon other studies of the effects of CO2 and ventilation on cognitive function. Several studies have examined the impacts of ventilation on cognitive performance, using CO2 as a proxy (Haverinen-Shaughnessy et al 2015, Maddalena et al 2015, Zhang et al 2017), as we did in our study. Haverinen-Shaughnessy and Shaughnessy found significant improvement in arithmetic standardized test scores associated with higher ventilation rates among elementary school students (Haverinen-Shaughnessy et al 2015). Others have investigated the direct effects of CO2, independent of the ventilation rate (Allen et al 2016, 2019). Allen et al found that short-term exposures to ventilation rates at 20 cubic feet per minute/person and CO2 above 900 ppm were associated with significantly lower test scores using the strategic management simulation tool (Allen et al 2016). Satish et al also found effects of CO2, independent of ventilation, when concentrations exceeded 1000 and 2500 ppm relative to a 600 ppm baseline. The effects of PM2.5 on ADD response time were not statistically significant, suggesting that the exposure had a larger effect on test accuracy than on test speed. Conversely, the association between CO2 and ADD throughput was not significant. A plausible explanation for these results is that these two environmental exposures have differential effects on attention and processing speed versus working memory, which could also explain the larger effects we report of CO2 on Stroop interference time.
Due to the limited range of PM2.5 exposures in the UK and the USA relative to the rest of the countries in the study, we performed a sensitivity analysis evaluating the effects of PM2.5 below and above the NAAQS primary annual mean standard of 12 μg m−3. We found that the associations between indoor PM2.5 and lower cognitive performance were stronger in magnitude and significance at concentrations above the NAAQS standard annual mean. This result supports the existence of acute effects of PM2.5 exposures on cognitive function. Nevertheless, it is difficult to determine whether the effects at lower levels are non-existent or if other country-level covariates associated with cognitive test performance (e.g. quality of educational systems) could have subdued the effects found at higher PM2.5 levels. We also performed a stratified analysis by time of day, gender, job category, and educational level (results not shown). Overall, the findings are robust across the different strata, maintaining the magnitude and directionality of the associations of PM2.5 and CO2 with the cognitive tests. However, some of the strata have a limited number of observations, leading to more uncertain effect estimates within strata.
The model diagnostics show that environmental factors explain a significant portion of the variability in cognitive performance, especially on the Stroop test. The fixed effects on the Stroop test account for 40%–50% of the variance explained by the model. While the variance in cognitive performance between individuals was greater than differences between buildings, these results show that the built environment influences acute cognitive performance of similar magnitude to the aggregate interpersonal differences related to education, sleep, diet, and other factors.
Our study has several limitations. First, it did not measure any exposures outside work. While some of the observed effects may be lagging a home or commute exposure, we consider that the close temporal relationship between exposure and outcome in our study makes this possibility less likely. Second, the random effects analysis shows that between-participant variation is very large compared to the effect size observed from the exposures of interest. Despite participant-level covariates associated with the outcome (e.g. age, gender, educational level), the model has a relatively low fit, particularly in the ADD test with larger confidence intervals (table 3) and lower R-squared values (table 4). Third, there are known limitations to the quality of real-time, commercial-grade environmental sensors. Concerns about the instrument quality have been expressed elsewhere (Clements et al 2017). However, since several sensor packages share the same components (same optical particle counter model), we consider that errors might be similarly distributed in different study locations. Moreover, these commercial-grade packages are improving rapidly (Demanega et al 2021).
Our study advances a growing body of literature on the effects of air pollution on cognitive function in several ways. First, the combination of real-time indoor air quality sensors and a mobile research app to administer in-situ cognitive tests allowed us to study exposure and outcome at a high spatiotemporal resolution. Second, compared to experimental approaches with simulated exposures, the observational study design relied on the natural variability of the exposures of interest across countries representing nearly half of the world's population, adding to the exposures' validity (table 2).
We consider that this study adds to the evidence of the acute impacts on cognitive function associated with poor indoor air quality. Benefits on cognitive function from reducing exposures to PM2.5 and CO2 indoors, either by filtration or higher ventilation rates, may positively impact productivity, educational attainment, safety, and many other activities where cognitive performance is important. This study also contributes to the body of literature indicating that building performance is associated with cognitive performance. In addition to the well-established health benefits from lower PM2.5 levels (e.g. reductions in cardiovascular disease, asthma attacks, premature mortality), and from higher ventilation rates (e.g. reduced infectious disease transmission, fewer sick-building symptoms, and reduced absenteeism), our findings provide further incentive to improve air quality in indoor spaces. Higher ventilation rates and enhanced filtration that exceed current minimum targets are important public health strategies.
Acknowledgments
This work was supported by the National Institutes of Health Grant T32-ES007069, the National Institute of Environmental Health Sciences Grant P30-ES000002, the National Institute for Occupational Safety and Health Grant T42-OH008416, and a gift from Carrier Global Corporation (Carrier). Additional support was provided by Jones Lang LaSalle, Inc. (JLL) and by several companies that participated in this study, whose identities we cannot disclose because it could inadvertently breach participant confidentiality, who provided funds to cover the costs of study equipment for their building(s). Carrier, JLL, and the companies that participated in the study were not involved in study design, data collection, data analysis, data interpretation, data presentation, or drafting of the manuscript.
Data availability statement
The data that support the findings of this study are available upon reasonable request from the authors.