


Abstract
The United States has supported the development of its oil and gas industry since the early twentieth century. Despite repeated pledges to phase out 'inefficient' fossil fuel subsidies, US oil and gas production continues to be subsidized by billions of dollars each year. In this study, we quantify how 16 subsidies and regulatory exemptions individually and altogether affect the economics of US oil and gas production in 2020–2030 under different price and financial risk outlooks. We find that, at 2019 average market prices of oil and gas, the 16 subsidies could increase the average rates of return of yet-to-be-developed oil and gas fields by 55% and 68% over unsubsidized levels, respectively, with over 96% of subsidy value flowing to excess profits under a 10% hurdle rate. At lower 2020 prices, the subsidies could increase the average rates of return of new oil and gas fields by 63% and 78% over unsubsidized levels, respectively, with more than 60% of oil and gas resources being dependent on subsidies to be profitable under a 20% hurdle rate. Under all price scenarios analyzed, the highest-value subsidies include federal tax incentives that have existed since 1916, as well as less recognized forms of support such as cost exemptions related to well cleanup and hazardous waste management. Given that these results depend on our chosen definitions of what constitutes a subsidy and, in some cases, assumptions regarding what the unsubsidized practices should be, we also present results for selected subsets of subsidies. By showing which subsidies have the greatest effects in different producing regions of the country, our findings can help policymakers chart a schedule of targeted subsidy repeals and regulatory reforms that can contribute to reducing carbon dioxide emissions and achieving other sustainable development goals. Our results can also help inform how different choices about economic recovery measures in response to the COVID-19 pandemic can shape the US oil and gas industry in the years to come.
Export citation and abstract BibTeX RIS

Original content from this work may be used under the terms of the Creative Commons Attribution 4.0 license. Any further distribution of this work must maintain attribution to the author(s) and the title of the work, journal citation and DOI.
1. Introduction
In the United States, the federal and state governments have supported the oil and gas industry since the early twentieth century through fiscal, military, scientific, and other forms of support [1–4]. Although people benefit from this source of energy [5], the production and combustion of oil and gas are associated with harms to human health and the environment, including air, water, and hazardous waste pollution and climate change [6–10]. Since 2009, twenty major world economies—including the US—have pledged to eliminate 'inefficient' and 'wasteful' fossil fuel subsidies [11, 12]. However, fossil fuel producer subsidies persist in the US, with some estimates totaling $20 billion per year, though estimates can vary widely depending on the methodologies and definition [13, 14].
The US is currently the world's top oil and gas producer [15]; its crude oil and gas production have grown by over 100% and 65% respectively since 2005, largely owing to developments in horizontal drilling and hydraulic fracturing techniques [16]. While the role of the US government in developing these techniques is well understood [3], what is less appreciated is how numerous subsidies combine to boost profitability and, by extension, production levels of oil and gas. As a few studies have demonstrated [17–19], if these support mechanisms encourage more exploration and extraction than would otherwise be economically viable, they lock in higher greenhouse gas emissions and perpetuate health, environmental, and financial risks to local communities and the wider public [10, 20–22]. If they flow to profit, they are not fulfilling their stated economic purpose.
In this analysis, we consider subsidies to be those policy measures that confer a financial benefit from the government to a particular industry: here, US oil and gas producers. This definition of subsidy is modeled on that of the World Trade Organization. As in their definition [23], we likewise consider three categories of subsidies: forgone government revenues through tax exemptions and preferences; transfer of financial liability to the public; and below-market provision of government goods or services. These types of measures all reduce the financial costs of fossil fuel production along the supply chain and increase investor returns on a present-value basis [24, 25]. In addition, the industry benefits from regulatory exemptions that lower their production costs at the expense of the health and safety of workers and the public. Examples include, but are not limited to, exemptions and other special provisions under the Clean Air Act, the Safe Drinking Water Act, and the Resource Conversation and Recovery Act that reduce or eliminate the costs of complying with air pollution standards and disposal requirements for hazardous liquid and solid wastes [26, 27]. We contend that regulatory exemptions are another form of market-distorting government policies that benefit oil and gas producers [28].
In this study, we update and expand a previous study by Erickson et al [17] to evaluate the influence of 16 subsidies on the economics and investor returns of thousands of individuals fields in the US that are expected to start producing oil and gas between 2020 and 2030, using field-level production and cost estimates from Rystad Energy as of late 2019 [29]. This study incorporates recent changes to US tax law and builds upon the prior study by considering the effects on gas as well as oil production, and provides one of the first field-level assessments on the effects of several environmental regulatory exemptions on oil and gas profitability. Our results can help researchers and policymakers better assess how specific subsidy and regulatory reforms can contribute to achieving climate and other sustainable development goals. The methods used here could also be readily applied to other countries.
2. Methods
The methods used in this study are an update and extension of those published in Erickson et al [17], and further details, including what we consider as a subsidy and why, are available in that study and in our supplemental methods. Briefly, we develop an upstream cash flow model using field-level production and cost estimates from Rystad Energy's UCube database (November 2019 release) [29], combined with our own assumptions about commodity prices (see supplemental methods), to evaluate the combined and individual effects of the 16 subsidies and regulatory exemptions listed in table 1.
Table 1. List of support mechanisms analyzed in this study. Our central analysis (figures 1 and 2) includes all mechanisms listed. We also present some results for Subset A (marked with *), which only includes six federal subsidies that were identified in the US government's 2015 self-review for the G20 [13]; and Subset B (marked with §), which includes all subsidies listed except for Fed. rylt., State tax, Legacy cleanup, and Road maint.. See supplemental methods for modeling approach for each subsidy and further details.
| Category | Subsidy | Abbreviated subsidy name used in figure 1 | Applies to oil and/or gas producers? | Description |
|---|---|---|---|---|
| Forgone government revenues | Excess of percentage over cost depletion*§ | Pct. depl. | Oil, gas | Allows eligible producers to deduct a portion of the gross value of their production each year rather than standard deduction rules that limit deductions to invested capital over the producing life of the mineral deposit, thereby allowing deductions that may exceed actual investment. |
| Expensing of intangible exploration and development costs*§ | IDC | Oil, gas | Allows producers to immediately deduct many drilling and field development costs that for other industries would be capitalized (and deducted over a longer timeframe). | |
| Accelerated amortization of geological and geophysical expenses*§ | Geo & Geo | Oil, gas | Allows independent producers to amortize geological and geophysical expenses over two years instead of recovering these costs through standard depletion. | |
| Tax exemptions for master limited partnerships (MLPs) *§ | MLP | Oil, gas | Enables firms to avoid corporate income taxes, a special allowance available predominantly to oil and gas transmission pipelines. As a result, producers experience reduced transport costs. | |
| Federal royalty exemptions for gas used on site, flared, or vented*§ | Free flare fed. | Oil, gas | Operators are not required to pay royalties on gas that is flared, vented, or consumed on site to the federal government. | |
| Below-market royalty rates on federal lands | Fed. rylt. | Oil, gas | Onshore fields located in federal lands are subject to below-market royalty rates on gross production. | |
| State severance and production tax exemptions for gas used on site, flared, or vented§ | Free flare state | Oil, gas | Operators are not required to pay taxes on gas that is flared, vented, or consumed on site to state governments. | |
| Below-market state severance, excise, and production taxes | State tax | Oil, gas | Some states (such as Pennsylvania, Ohio, and California) charge very low severance, excise, and production taxes on oil and gas production. | |
| Transfer of financial liability to the government | Inadequate insurance coverage for offshore oil spills or accidents*§ | Offshore spill | Oil | Federal government requires proof of insurance to cover oil spill 'removal' but not for full extent of damages, thereby transferring risk to the public since other clean-up mechanisms (for example, Oil Spill Liability Trust Fund) are inadequate, under-pricing this risk to producers. |
| Inadequate bonding requirements for site closure and reclamation§ | Ltd bonding | Oil, gas | In many states, oil and gas producers are required to post bonds to cover the risk of producers failing to adequately perform well closure and clean-up. However, jurisdictions routinely allow producers to provide assurance for less than the actual known costs of closure and reclamation of wells, transferring risk to the public. | |
| Inadequate fees for legacy plugging and abandonment | Legacy cleanup | Oil, gas | Firms and state orphan well funds do not have to pay sufficient fees to address legacy plugging and abandonment costs. This liability is estimated to be more than $100 billion nationally. | |
| Inadequate liability insurance for oil train accidents§ | Rail risk | Oil | Oil spills or other accidents can occur during oil transportation by rail, but are generally not adequately insured. This underpricing of liability for oil transport could affect the price producers receive and therefore be an indirect form of support. | |
| Below-market government provision of goods and services | Public coverage of road damage costs | Road maint. | Oil, gas | Firms are inadequately charged for road maintenance and restoration relative to the damage caused by relatively heavy loads associated with oil and gas activities. |
| Inadequate regulations that endanger public health and safety | Regulatory exemptions for hazardous solid wastes from oil and gas production§ | Solid waste | Oil, gas | Solid wastes (including drill cuttings and sediments/sludges associated with wastewater) are exempt from hazardous waste regulations under the Resource Conservation and Recovery Act (RCRA). |
| Regulatory exemptions for wastewater from unconventional oil and gas production§ | Wastewater | Oil, gas | Wastewater from unconventional oil and gas production is exempt from hazardous waste regulations under RCRA and its disposal via underground injection is exempt from the Safe Drinking Water Act (SDWA)'s Underground Injection Control program. | |
| Inadequate safety standards for oil transport by rail§ | Rail safety | Oil | More than 60% of rail cars used to carry oil remain below new safety standards finalized in 2015, and these standards remain below the National Transportation Safety Board's recommendations. |
We apply discounted cash flow analysis to model future revenues and costs over a 40 year window in order to assess the economic viability and profitability of an oil- or gas-producing field with and without subsidies. Though by no means the only investment-appraisal tool used by the oil and gas industry, discounted cash flow analysis is the most widely used one [30]. Since the with-subsidies case is the one in place at present in the US, this case is modeled for each oil and gas field using the stream of operating costs, capital costs, and production foreseen by Rystad Energy. The without-subsidies case is then constructed by modifying this baseline case to account for each subsidy, one by one. This process results in a full set of cash flows for both the with-subsidies and without-subsidies cases, but also for each point in-between as each subsidy is sequentially peeled back. While our approach of comparing the with-subsidies and without-subsidies cases allows us to isolate the effect of the 16 measures we analyze, it should not be read as an assessment of whether or not the tax treatment of the oil and gas industry as a whole is 'neutral', which is a common—if much debated—concept in the petroleum taxation literature [31].
For regulatory exemptions, we note that quantifying the associated public health damages and risks (i.e. externalities) are beyond the scope of this study. Instead, we take a more limited view and estimate the value of these exemptions to oil and gas producers in terms of the costs firms would experience if such exemptions were removed. This approach therefore does not capture the full social and environmental costs (e.g. health damages) of these subsidies.
New, undeveloped oil and gas fields provide a prime opportunity for evaluating the influence of subsidies across the full life cycle of capital investment, operations, and field abandonment. Since the geologic and economic data for not-yet-developed fields in which oil and gas resources have already been discovered are more robust than for those with undiscovered resources, our analysis primarily focuses on 1076 'discovered' fields as of November 2019. We also extend our analysis to consider 2539 'undiscovered' fields, as well as 3109 already-producing and 870 'under-development' fields in order to develop a more complete picture of future US oil and gas production.
We rely on three related investor return metrics: net present value (NPV), internal rate of return (IRR), and breakeven price. NPV is the sum of all future cash flows discounted to present value taking into account the company's investment hurdle rate. Hurdle rates of 10%–20% are often used in the oil industry [30]. Investors would expect a project with a positive NPV to make a net profit and one with a negative NPV to lose money. The breakeven price and the hurdle rate each correspond to the values that return an NPV of zero, whereby a firm would theoretically proceed if the project's IRR was at least greater than its hurdle rate or if the project's breakeven price was lower than the market oil or gas price.
The percentage of subsidy-dependent resource can be calculated from the volume of oil or gas resource with NPV < 0 in the without-subsidies case and NPV > 0 in the with-subsidies case out of the total volume of resource with NPV > 0 in the with-subsidies case. (All other fields with NPV < 0 in the with-subsidies case are assumed to not proceed). The fraction of subsidy value that goes towards excess profits can be estimated by tallying how subsidies affect the NPV of each field. For fields with NPV greater than zero in the without-subsidies case, all subsidy value goes towards excess profits. For fields in which the NPV is less than zero in the without-subsidies case and greater than zero in the with-subsidies case, subsidies provide economic viability up to the point at which NPV reaches zero, before flowing to excess profits thereafter.
We analyze the effect of subsidies on each field at a wide range of gas and oil prices and under two different hurdle rates. Since the majority of US fields co-produce oil and gas (as well as natural gas liquids (NGLs) and condensate), and since oil and gas prices are foreseen by the US EIA to increase roughly in tandem, we identify and assume simple linear relationships between Henry Hub gas prices and Brent oil prices, as well as for related NGLs and condensate liquids, based on historical and future prices projected by the EIA's 2020 Annual Energy Outlook [32]. We also test a price-sensitivity scenario in which oil and gas prices are more decoupled. This means that we test four different sensitivity scenarios in total (1-2): 'central' linear oil–gas price relationship at 10% and at 20% hurdle rates; and (3-4) 'alternative' more decoupled oil–gas price relationship at 10% and at 20% hurdle rates.
In addition, we perform two analyses that consider subsets of the 16 subsidies listed in table 1: (subset A) an analysis with six federal subsidies that were identified by the US government in its 2015 self-review to the G20; and (subset B) an analysis that excludes four subsidies for which there could be material differences of opinion on what the unsubsidized practice should be: below-market royalty rate on federal lands, public coverage of road damage costs, inadequate fees for legacy plugging and abandonment, and below-market state taxes on extraction. Further details on how we define these sensitivity and additional analyses and the associated results are provided in the supplementary methods.
Rystad Energy's UCube database is widely used for assessing future oil and gas investments, including in annual assessments by the International Energy Agency (e.g. World Energy Investment 2020 and Oil 2020 reports [33, 34]). Rystad gathers its data for US oil and gas fields from a mix of government sources (e.g. US Department of Energy statistics), publicly available company-specific information (annual reports, press releases, and investor presentations), and its own research and modeling. To our knowledge, Rystad's data have not been subjected to open peer review, but their estimates have been put to some scrutiny in academic and popular articles [35, 36]. Rystad's estimates of field-level costs used here include the capital and operating costs associated with developing and operating a new oil or gas field once it has already been accessed, explored, and appraised (see supplemental methods), and therefore exclude consideration of costs for (or subsidies that apply to) property acquisition and other 'sunk' costs that occur before final investment decision (e.g. debt related to prior investments).
3. Results
3.1. Effect of subsidies on investor returns
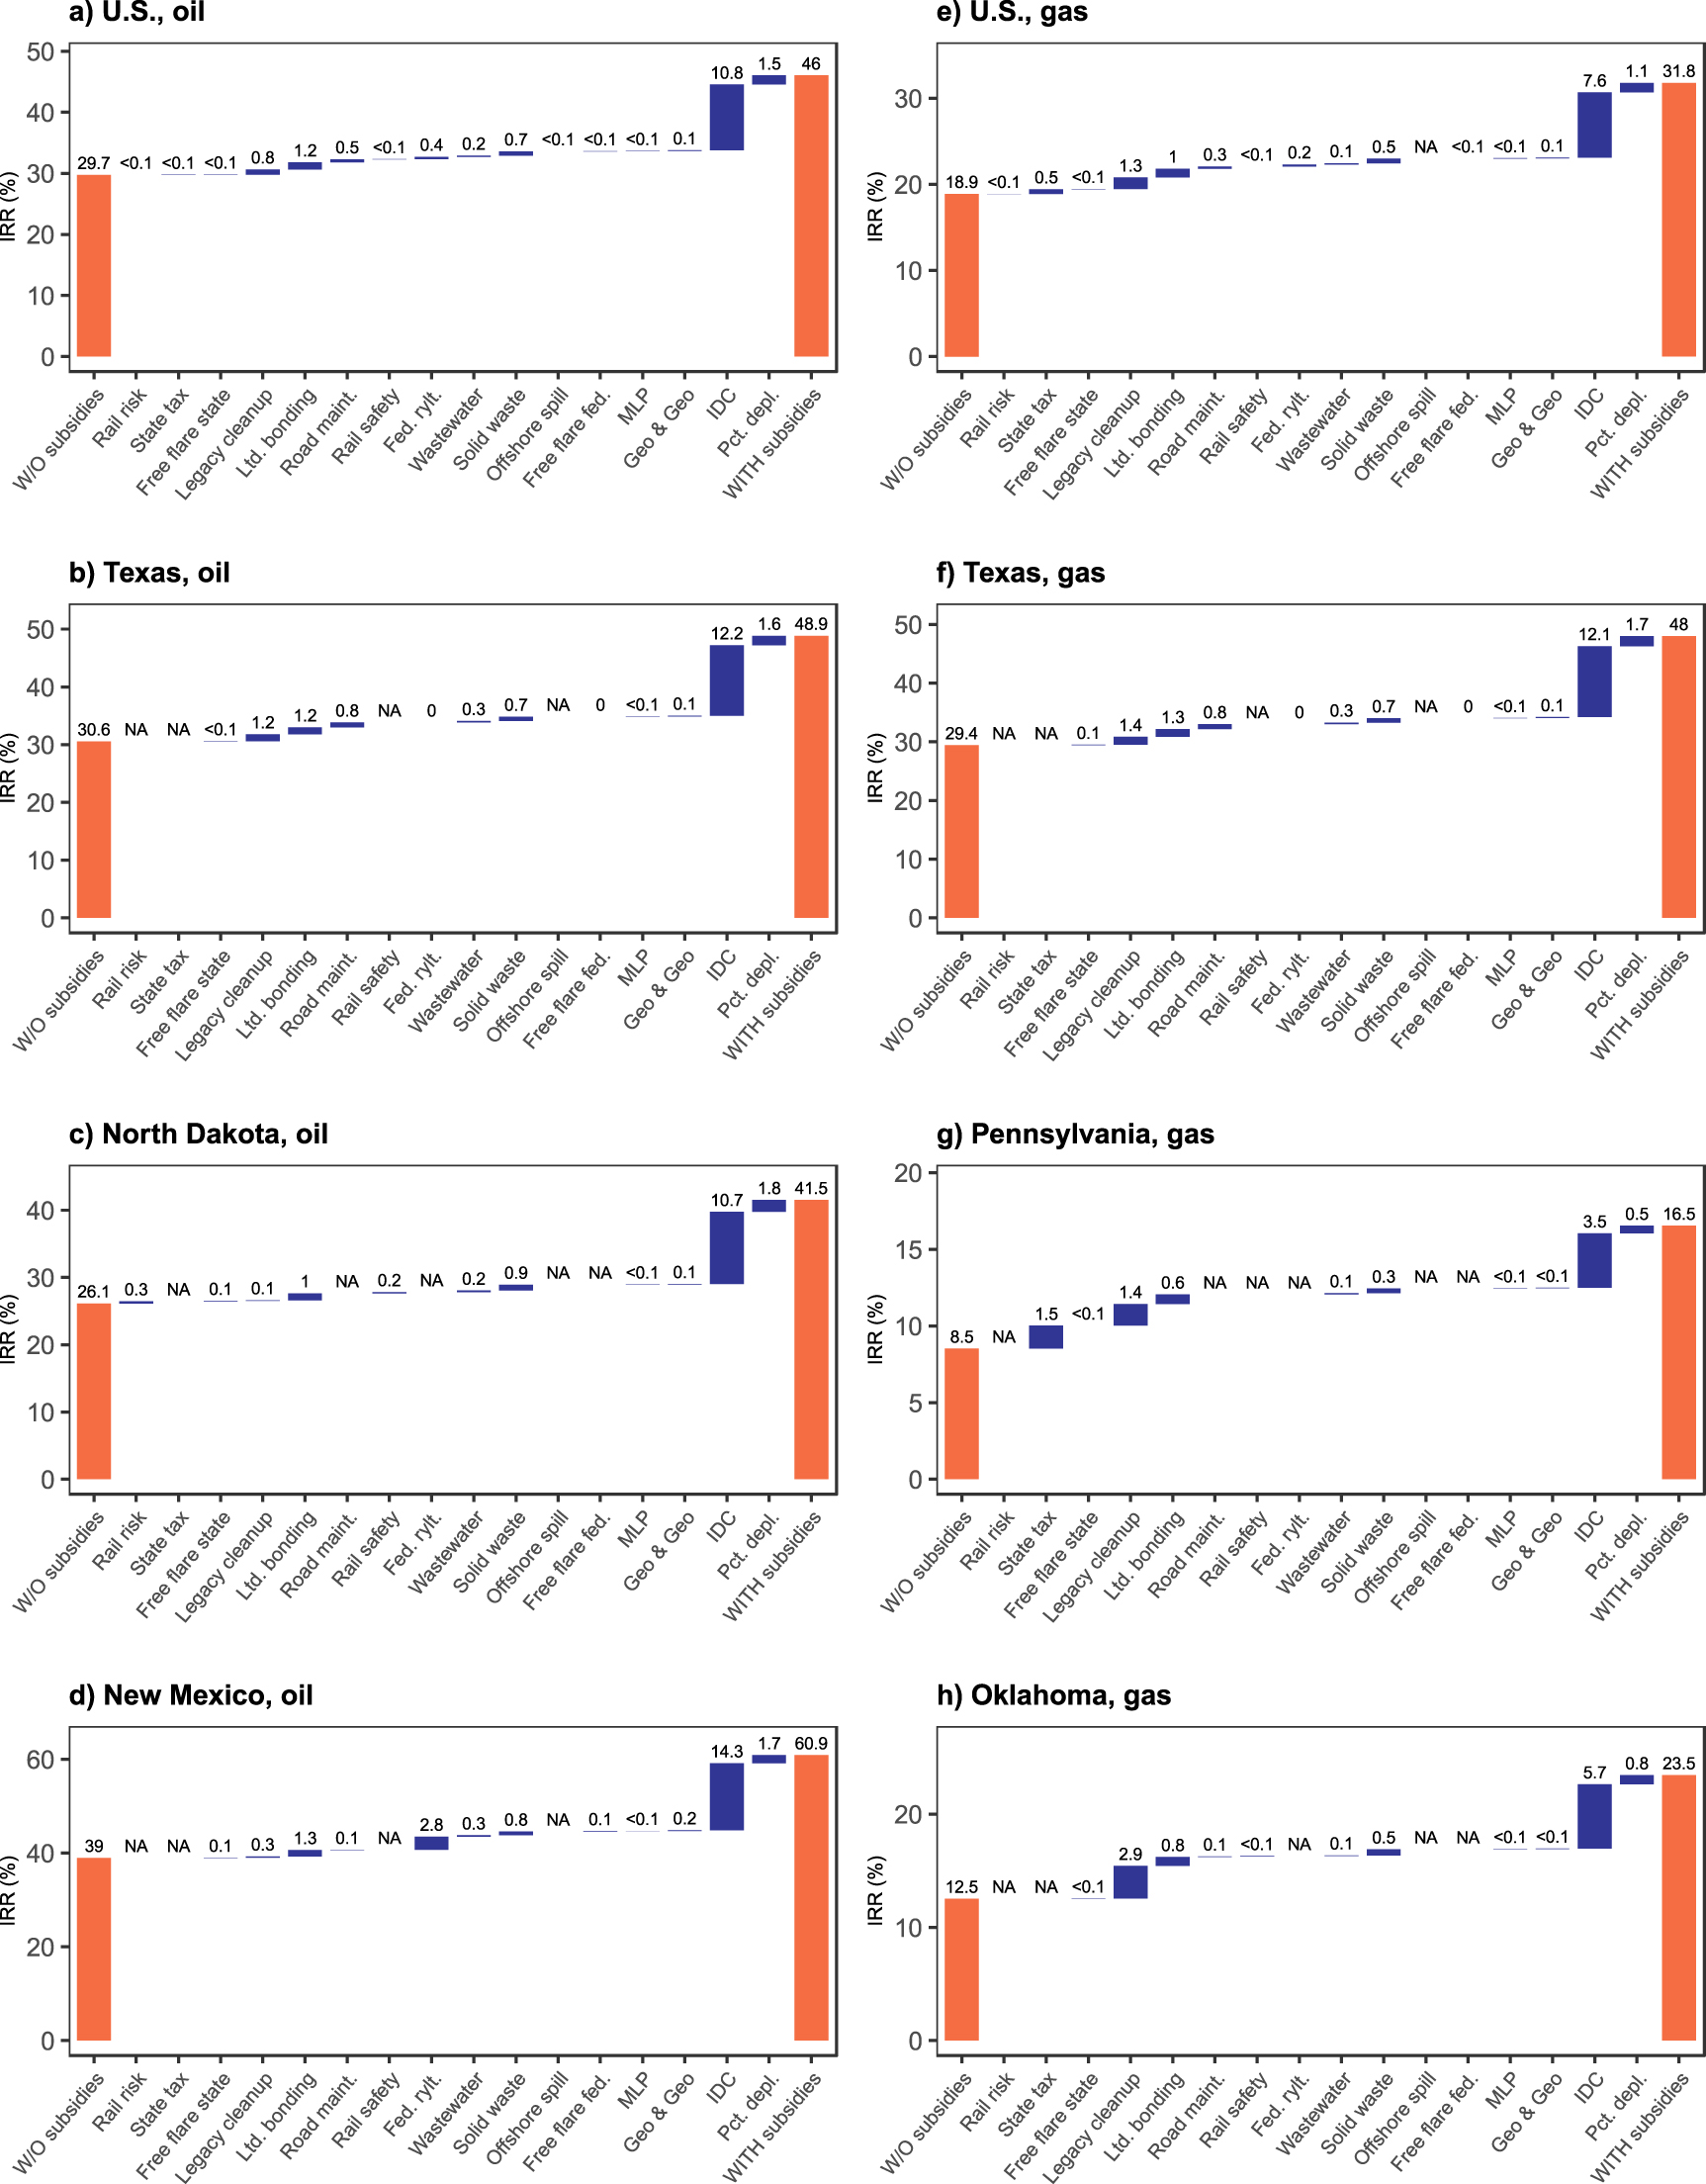
We first illustrate how the 16 subsidies considered here can increase the profitability of prospective oil and gas production across the US. Figure 1 shows the individual and combined effects of the 16 subsidies on the production-weighted IRR—a metric commonly used to estimate the profitability of potential investments—averaged across discovered but not-yet-developed oil and gas fields in the US and major-producer states, assuming oil and gas prices at average 2019 levels of USD2019 64/barrel of oil and USD2019 2.6/mmbtu of gas [37]. At a national level, the subsidies could altogether increase the IRR of these new oil fields by 16 percentage points (figure 1(a)), and of these new gas fields by 13 percentage points (figure 1(e)), representing increases of 55% and 68% over unsubsidized levels, respectively. At the individual field level, the median subsidy-induced increases in IRR are 8 percentage points for both oil and gas fields (with interquartile range of 4–15 and 4–14 percentage points respectively, and both with positively skewed distributions) (figure S1 available online at stacks.iop.org/ERL/16/084023/mmedia).

Figure 1. Average effect of each subsidy on the internal rate of return (IRR) of new, not-yet-producing oil and gas fields, at average 2019 prices of USD2019 64/barrel of oil and USD2019 2.6/mmbtu of gas. The charts on the left show the oil production-weighted average change across all oil-producing fields, and the charts on the right show the gas production-weighted average change across all gas-producing fields, in the US and in a given state. Fields that never reach a positive IRR (even with subsidies) are not included. 'NA' labels indicate that a given subsidy was not applied to that fuel and/or state. The underlying data for this figure, as well as for other major oil- and gas-producing states not shown, can be found in the supplemental materials..
Download figure:
Standard image High-resolution imageAs can be seen in figure 1, at both the national and state levels, the subsidy with the greatest effect by far is the expensing of intangible exploration and development costs (IDC), which increases US-wide average IRR by 11 and 8 percentage points for oil and gas fields respectively. Another tax incentive that is relatively beneficial at both the national and state levels is the excess of percentage over cost depletion allowance, which boosts average IRR by 1–1.5 percentage points. Additionally, other forms of forgone government revenues can also be important in applicable geographies. These include below-market taxes on oil and gas extraction in certain states such as Pennsylvania, as well as below-market royalty rate on federal lands, which has remained at 12.5% since 1920 [38], even as rates on non-federal land (and in federally controlled offshore waters) are known to be higher [39, 40].
Beyond these long-standing tax incentives, our results reveal that three other support measures can also yield relatively substantial benefits. The first two represent the transfer of financial liability for the costs of well closure and reclamation from the producers to the government, a loophole that has resulted in a large inventory of abandoned and unplugged wells across the US ('legacy cleanup'), and which will continue to grow as producers are allowed to drill new wells with insufficient bonding requirements ('Ltd bonding'). Our estimates suggest that for major producing states with large inventories of abandoned wells such as Texas, Pennsylvania, and Oklahoma, the legacy cleanup costs could amount to more than $10 billion in each state, which are vastly in excess of existing states' abandoned well funds. The third subsidy stems from an exemption under the Resource Conservation and Recovery Act that allows solid wastes from oil and gas extraction to be treated as non-hazardous, despite the fact that oil and gas wastes can be contaminated with hazardous chemicals (such as arsenic, lead, and barium) and naturally occurring radioactive materials [41, 42]. We estimate that this exemption reduces costs for operators by $60 000 per well on average.
Although the relative importance of the 16 subsidies analyzed in this study appears to be quite robust to the oil-gas price environment (figures (S2) and (S3)), the precise magnitudes by which they individually and altogether boost investor returns are sensitive to the oil and gas prices foreseen by investors and, ultimately, experienced by project developers. For example, the annual average 2020 Brent oil and Henry Hub gas prices were roughly USD2019 40/barrel and USD2019 2mmbtu, respectively. At these prices, the subsidies would altogether increase the IRR of new oil and gas fields averaged across the US by around 7 percentage points over unsubsidized values of about 11% and 9%, representing increases of 63% and 78% over unsubsidized levels, respectively (figures S2(d) and S3(d)). For individual oil and gas fields, the median subsidy-induced increases in IRR are 5 percentage points (figure S4).
The magnitudes by which the subsidies boost investor returns are also sensitive to which support mechanisms from table 1 are considered as subsidies. In our central case (e.g. as presented in figures 1 and 2), we consider all of them; some policymakers or other researchers may also be interested in particular subsets. For example, the six federal subsidies from table 1 that were flagged as such in the US governments' 2015 self-review to the G20 account for the majority of the combined effect of the 16 subsidies analyzed in our central case. Assuming prices at average 2019 levels of USD2019 64/barrel of oil and 2.6/mmbtu of gas, the 16 subsidies considered in our central case lead to a combined increase in US-wide average IRR by 16 percentage points for new oil fields and by 13 percentage points for new gas fields, of which 12 and 9 percentage points stem from the six federal subsidies in subset A for oil and gas fields, respectively (table S1). Table S1 also shows results for a different subset that excludes four subsidies from our central case: below-market royalties (Fed. rylt.) and state taxes (State tax), public coverage of road damage costs (Road maint.), and inadequate fees for legacy plugging and abandonment (Legacy cleanup). Excluding these four subsidies would lead to a combined subsidy-induced increase in average IRR of 15 percentage points for new oil fields and 11 percentage points for new gas fields (table S1).
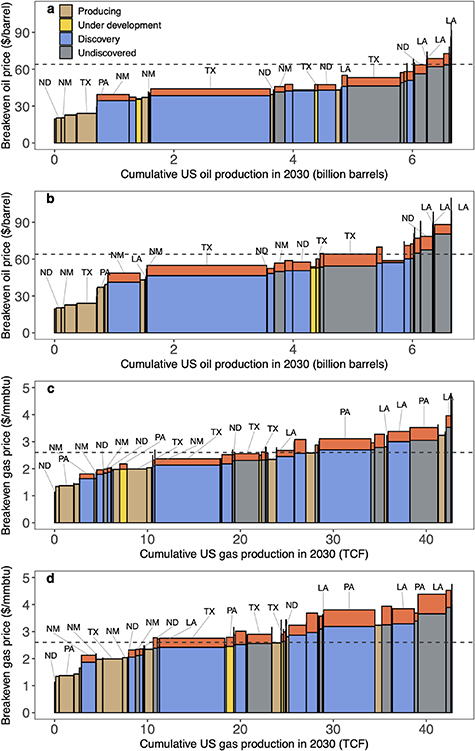
Figure 2. Cost curves of US oil and gas production in 2030 assuming a 10% (a), (c) versus 20% (b), (d) hurdle rate. Each bar represents the oil or gas production-weighted average of the breakeven price across all fields in a given US state and life-cycle stage. The red-shaded block above each bar shows the decrease in breakeven oil price (USD2019/barrel, Brent basis) or breakeven gas price (USD2019/mmbtu, Henry Hub basis) due to the cumulative effect of 16 subsidies applied in this analysis. The subsidies decrease the breakeven cost of new, not-yet-producing fields, moving the cost curve downward. The horizontal dashed line in each subplot shows the average 2019 oil or gas price of USD2019 64/barrel and 2.6/mmbtu, respectively. The cumulative production is shown in units of billion barrels of oil or trillion cubic feet (TCF) of gas.
Download figure:
Standard image High-resolution image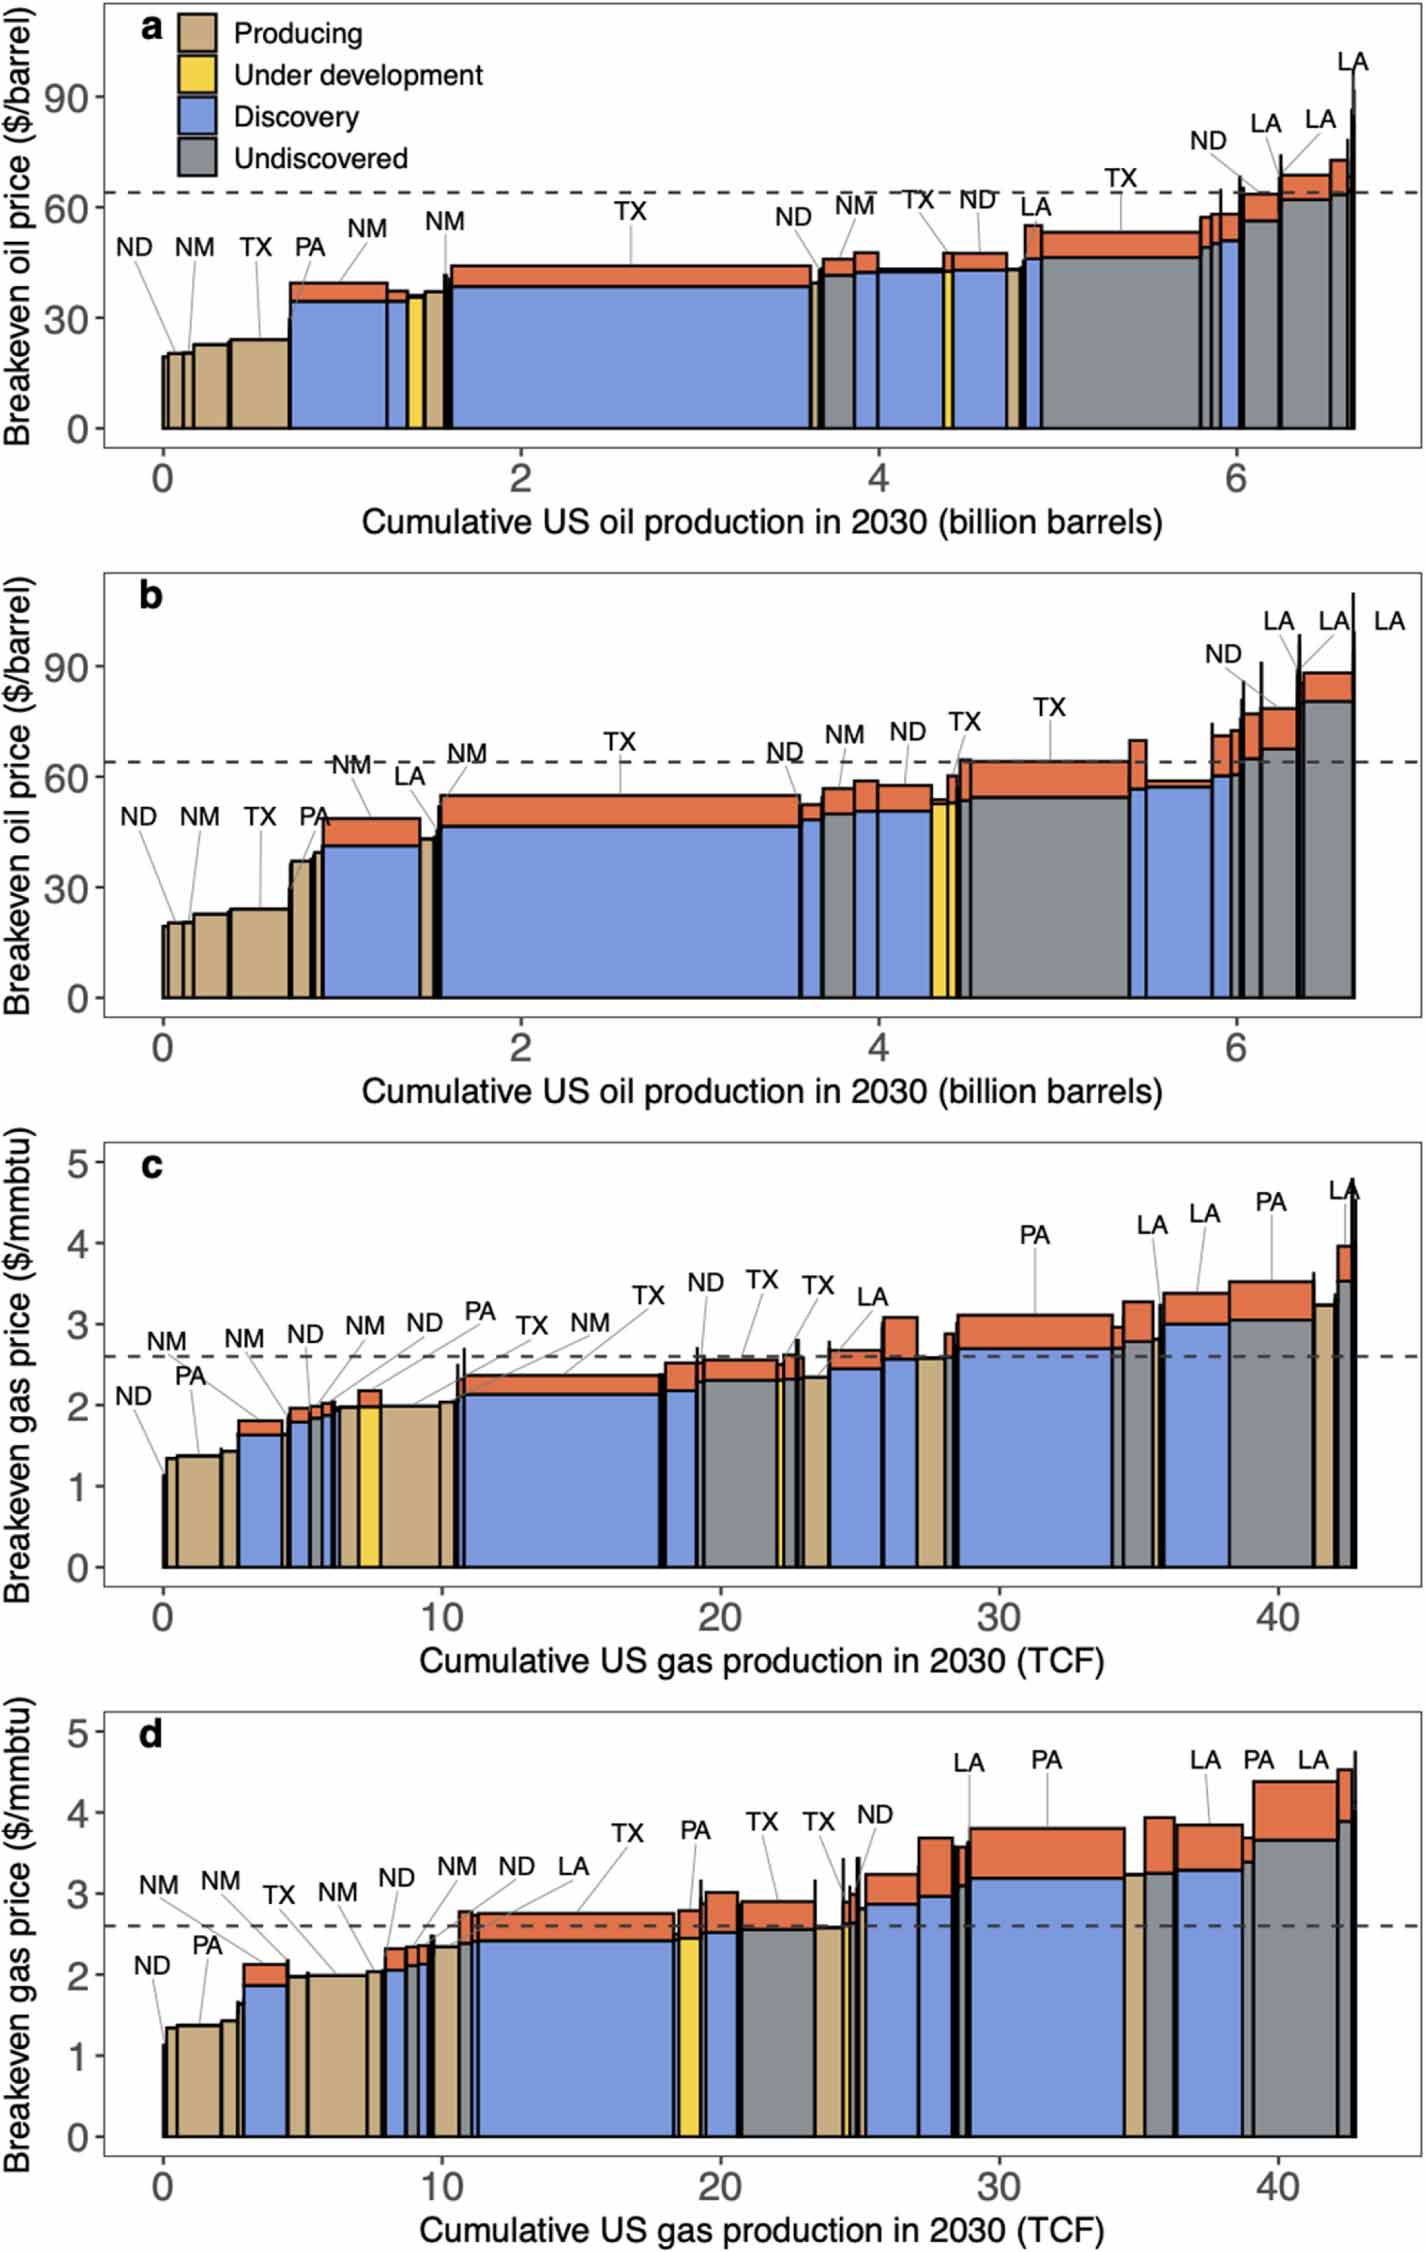
3.2. Effect of subsidies on production
The extent to which the subsidy-induced increases in project returns affect decisions regarding new well drilling and field development and, ultimately, oil and gas production, will depend strongly on the oil–gas price environment. Such decisions will also depend on investor hurdle rates—the minimum IRRs investors are willing to accept in exchange for their provision of capital. Given these uncertainties, in this section, we translate the fundamentals of project returns into a comprehensive view of prospective US oil and gas supply using supply-cost curves. Cost curves are a common framework for assessing oil and gas production under alternative price outlooks, and for this reason may be a more flexible tool for assessing the effect of subsidies.
First, we calculate the breakeven economics for each of the 1076 'discovered' (but not yet producing) fields analyzed for figure 1. For each field, the breakeven oil or gas price is the price at which the field becomes economic, i.e. its NPV becomes zero. This metric allows us to assess which fields are likely to be developed or not for any given market price of oil or gas.
Next, to develop a more complete picture of future US oil and gas production, we expand our analysis of breakeven economics to include an additional 3109 already-producing fields, 870 fields that are 'under development' (will start producing soon), and 2539 'undiscovered' fields for which oil and gas reserves are unproven but believed to be economically recoverable (as of late 2019). We include these fields so that we can display a complete picture of prospective US oil and gas production in 2030 as cost curves, shown in figure 2. We pick the year 2030 to provide a sufficiently distant view on the effect of subsidies on the next decade's worth of new investments, as well as to align with the target year of current negotiations under the Paris Agreement on climate change, which could have substantial bearing over fossil fuel markets.
As shown in figure 2(a), at a hurdle rate of 10% and an example oil price of USD2019 64/barrel, most new oil fields would be developed with or without the subsidies analyzed here. This is because the breakeven price of oil in the major discovered and undiscovered oil deposits in Texas, North Dakota, and New Mexico is well below USD2019 64/barrel. In such a case, almost all of the subsidy value—shown as the red-shaded rectangle on each state's 'block' of oil—would go directly to producer profits, also called rents. As shown in figure 2(c), the economic outlook for gas production is not as strong, at least at the 2019 average gas price of 2.6/mmbtu. At this price, while gas co-produced on oil-dominant discovered fields in Texas, New Mexico, North Dakota, and other states would be profitable to produce, much of the discovered and undiscovered gas in the Appalachian states of Ohio, Pennsylvania, and West Virginia would not be viable, or just barely viable with subsidies.
As this example helps to illustrate, the cost curves for oil and gas can help analysts determine not just under what conditions oil and gas are profitable, but under what conditions subsidies make the most difference to economic viability and therefore spur additional production. Subsidies have the greatest effect on oil or gas field viability where each cost curve is 'flat'—that is, where small changes in breakeven price would lead to relatively large quantities of oil or gas becoming viable. For example, the gas cost curve (figure 2(c)) is relatively flat at 2.6/mmbtu, and 23% (4 out of 17 trillion cubic feet) of prospective 2030 gas production from discovered and undiscovered fields would depend on subsidies to proceed. For oil, the cost curve (figure 2(a)) is steep at USD2019 64/barrel, at which 6% (330 out of 5200 million barrels) of prospective 2030 oil production would depend on subsidies to proceed. Figures 2(b) and (d) show the 2030 oil and gas cost curves, respectively, at a higher hurdle rate of 20%. At this hurdle rate but the same prices of 2.6/mmbtu and USD2019 64/barrel, 31% and 21% of prospective 2030 gas and oil production would be subsidy-dependent, respectively.
Many oil fields co-produce gas and vice versa, as well as condensate and NGLs. This means that uncertainties in how oil and gas prices will co-vary in the future will also impact the cost curves shown. In figure 2, we assume that oil and gas prices increase linearly together, following the price outlook of the reference scenario in the EIA's 2020 Annual Energy Outlook. As one example of an alternative scenario in which oil and gas prices are more decoupled, we ran a sensitivity analysis in which oil prices are lower for a given gas price (see supplementary methods). Under such a scenario, the gas cost curve shifts upwards as the breakeven gas price generally increases, leading to a higher subsidy-dependence of prospective gas production (figure S5).
3.3. Effect of subsidies on market prices and CO2 emissions
How subsidies to fossil fuel producers affect CO2 (and other greenhouse gas) emissions depends on the extent to which subsidies depress the market prices for oil and gas below what they would otherwise be. Fully quantifying all of the possible changes in fossil fuel markets as a result of these price changes would require a comprehensive, multi-sector energy model, such as the National Energy Modeling System (NEMS) used by the US government or one of the numerous energy-economic models used to assess global energy markets and greenhouse gas mitigation options. Nonetheless, the cost curves shown in figure 2 can help to provide a rough indication of how subsidies make oil and gas cheaper than they otherwise would be, since the subsidies reduce the costs of developing new oil and gas fields and therefore, in turn, the market price of these fuels.
To estimate the combined effect of US subsidies on the consumer price of oil and, in turn, global oil consumption and CO2 emissions, we situate the US oil fields analyzed here in a global oil cost curve for 2030 drawn from Rystad Energy [29]. US oil fields occupy about half of all oil in the upper part of the cost curve, i.e. above USD2019 50/barrel, and therefore function as future sources of supply growth that help set the long-run price of oil (figure S6). Under a 10% discount rate, the combined effect of the 16 subsidies analyzed here are estimated to reduce the breakeven price of 'discovered' and 'undiscovered' oil by an average of USD2019 6.24/barrel. This would translate into half as big of a decrease in the average, global breakeven price in this range, i.e. USD2019 3.12/barrel. (A more complete picture of the effect of subsidies would also consider similar decreases in breakeven prices in other countries' oil resources as a result of those countries' subsidies.) Assuming the oil market is effectively global, and using a simple oil-market model with an elasticity of global oil demand of −0.3 and of oil supply of 0.6 [25, 29], such a decrease in the cost of oil supply would translate into a decrease in the price of oil of USD2019 2.08/barrel, and an increase in oil consumption of 374 million barrels annually. This approach, while simplistic, allows for a transparent and straightforward means of estimating global effect on oil consumption. Further assuming about 0.4 tonnes CO2 per barrel of oil [43], this translates into increased global emissions from oil combustion of about 150 million tonnes CO2 annually. This figure would be proportionally less if fewer of the 16 subsidies considered here were included (table S2).
To estimate the combined effect of subsidies on the consumer price of gas, we similarly apply a simple economic model, parameterized by elasticities, and assuming the US gas market is effectively domestic. Specifically, assuming a long-run elasticity of US gas demand of −0.29 [44] and elasticity of supply of 2 (derived from the slope of the supply curve in figure 2(c)), a decrease in the cost of gas supply of USD2019 0.33/mmbtu due to the subsidies considered here (under a 10% discount rate) would translate into a decrease in the price of gas of USD2019 0.29/mmbtu and an increase in gas consumption of 0.83 Qbtu (0.80 TCF) in 2030. We do not translate this into changes in CO2 emissions since, unlike for oil, which has few higher-carbon potential substitutes, gas competes both with coal (with roughly twice the carbon intensity per unit of energy) and renewables (with very low carbon) in the power sector, leading to counteracting, and highly uncertain, effects on emissions [45, 46].
3.4. Influence of oil-gas prices, financial risks, and other factors on the role of subsidies
As discussed, the benefits that subsidies confer to new oil and gas investments are sensitive to a number of external factors such as the oil–gas price environment, discount rate, and tax regimes, as well as to the underlying projections of future production versus capital and operating costs. Under market conditions and projections in 2016, Erickson et al [17] estimated that, at a 10% nominal discount rate and prices of USD2016 50/barrel for liquids and USD2016 2.65/mmbtu for associated gas, a similar set of subsidies increased average IRRs for discovered but not-yet-producing oil fields by 9 percentage points, with 47% of future oil production from these fields depending on subsidies to be economically viable.
Under the same prices and discount rate assumption (converted from USD2016 to oil and gas prices of USD2019 54/barrel and 2.8/mmbtu respectively), this study estimates that subsidies increase average IRRs for discovered, not-yet-producing fields by 16 percentage points, such that 10% of future oil production from discovered fields would be dependent on subsidies. The greater effect on overall returns, but lower subsidy-dependence of oil projects in this study is consistent with general trends towards cost reductions and productivity improvements in the US shale industry over the last few years. Specific factors include (1): the reduction in the US corporate income tax rate from 35% to 21%; (2) cost reductions in the industry (mainly for proppant and pressure pumping) [47]; and (3) productivity improvements [48], which, combined with (2), lead to projections of lower operating costs per unit of production. All of these three factors have led to increased net profits, thereby reducing subsidy dependence. In addition, higher well productivity rates have amplified the value of the IDC subsidy by enhancing the difference between a with-subsidy case in which drilling costs can be immediately deducted and a without-subsidy case in which such costs would be deducted over time, in proportion to production volumes (see supplemental methods).
Nevertheless, the economics and, in turn, subsidy-dependence of the industry also depends on other factors, including the perceived risks of developing new oil and gas fields, whether due to reduced access to capital or due to uncertainty in market demand for oil and gas. Indeed, there is mounting evidence that the perception of risk for US oil and gas investments has increased markedly, even before the COVID-19 crisis hit in early 2020, such that investors may now be demanding higher minimum rates of return approaching 20% [49]. As previously described, at 2019 prices of USD2019 64/barrel of oil and 2.6/mmbtu of gas and a 10% hurdle rate, we estimate that only 4% and 22% of discovered but yet-to-be-developed oil and gas resources would be subsidy-dependent, respectively. Under these conditions, over 96% of subsidy value would flow directly to excess profits. On the other hand, at 2020 prices of USD2019 40/barrel of oil and USD2019 2/mmbtu of gas and a 20% hurdle rate, 61% of new oil and 74% of new gas resources would be subsidy-dependent for profitability. Under these conditions, around 75% of subsidy value would flow to excess profits. Figure S7 provides further details on how much future oil and gas resources from discovered fields would depend on subsidies, and how much subsidy value would flow to excess profits, under the four different scenarios of oil–gas prices and hurdle rates tested in this study.
4. Discussion and conclusions
How a country chooses to support different sectors of its economy involves a complicated set of considerations, driven as much by politics as economics or human needs. This study quantifies how existing oil and gas producer subsidies provided by the US federal government and some individual state governments could influence industry profitability, fossil fuel production, and global climate change over the next decade. These subsidies also have local health and environmental implications for communities living near oil and gas extraction or waste management sites. In the US, approximately 17.6 million people live within about a mile of at least one active oil and/or gas well [50]. A growing body of epidemiological studies have linked unconventional oil and gas development to harmful health outcomes, including but not limited to exacerbation of asthma and adverse pregnancy and birth outcomes from exposure to air pollutants [21, 22, 51, 52].
Our study demonstrates the large extent to which long-standing tax preferences for the oil and gas industry, namely the IDC and percentage depletion allowances, help to increase profits and/or boost production. This result is commensurate with the US government's findings in a 1980 assessment, which found that, 'By lowering the tax liability of oil producers, these incentives increased cash flow which in turn provides additional funds for capital formation' and, specifically, that these subsidies 'stimulated a large increase in output and had a depressing effect on the price of oil' [53]. The IDC subsidy has been in place since 1916 [54], and the percentage depletion allowance since 1926 [55]. While the terms of these subsidies have been modified over time, our analysis shows that they remain potent incentives for new investment.
In addition, our findings reveal that other indirect forms of government support can also confer financial benefits to the oil and gas industry. Specifically, oil and gas producers especially benefit from not having to pay the full costs of well closure and remediation, or those related to proper management and disposal of hazardous wastes generated from their operations. Instead, these avoided costs are transferred to taxpayers in the direct form of cleanup expenses as well as indirect public health risks.
The insights provided by our analysis can also help to illustrate how different choices about economic recovery measures in response to the COVID-19 pandemic can shape the US oil and gas industry and, potentially, broader fossil fuel markets. For example, if prices remain at low levels, our findings indicate that subsidies will mute the pandemic-related shock to the industry, while allowing more oil and gas to be produced than otherwise would be, resulting in increased global oil consumption and CO2 emissions. By contrast, if prices rebound to pre-COVID-19 outlooks, our results indicate that the vast majority of fossil fuel subsidy value will instead go directly to industry profits, which itself would help fortify the industry's incumbent status and delay the low-carbon transition.
We note here that our approach of using discounted cash flow analysis and investor metrics, though appropriate for assessing prospective investments, does not capture all of the costs of running a business or the performance of previous investments. As has been widely reported, shale-focused US companies in recent years have, in aggregate, not generated profit on their investments [56, 57]. The modeled field-level returns reported here (e.g. as in figure 1) need not correlate with company or sector-wide performance of past investments.
Although this study considers most major subsidies to oil and gas identified by the US government [13], plus several others, the list of support measures analyzed is by no means exhaustive, and we cannot paint a complete picture of the role of subsidies in shaping the entire US energy system. How particular energy sources gain dominance is the subject of a complicated set of factors and conditions [58], and is also driven by learning effects and increasing returns to scale over time that our cash-flow approach cannot capture. Furthermore, we have not considered the effects of broader environmental and social externalities that effectively act as subsidies—for example, the public health damages associated with oil and gas production and consumption due to air pollution and climate change [10, 59], or the macroeconomic risks of over-reliance on fossil fuels [60, 61]. Nor have we considered that subsidies also apply to other aspects of the US energy system, such as for coal, nuclear, or renewable sources, and which may have overlapping, or competing effects as compared to the subsidies analyzed here for oil and gas.
Beyond the sensitivities to future price outlooks and investment risks, our results are also dependent on the definitions and methods used to quantify fossil fuel subsidies, which are themselves subject to different interpretations and uncertainties. The largest uncertainty in defining a given subsidy can come from articulating its counterfactual: that is, what costs an oil or gas producer would experience were the subsidy not in place. For some—such as the IDC subsidy—the special tax treatment and corresponding shifting of costs is clearly specified in the US tax code, and the counterfactual is relatively unambiguous. For others, such as the costs experienced in managing drill cuttings as hazardous waste (were they not exempted from regulation)—requires the construction of a counterfactual based on likely hazardous constituents and resulting treatment costs. Our rationale for each selection and the associated uncertainties are described in the supplementary methods. Further, we present results for two subsets of subsidies that exclude some of the support mechanisms. For example, at 2019 average prices, the overall subsidy-induced increases in expected returns of new oil and gas fields by the 16 subsidies in table 1 would be reduced by 24% and 32%, respectively, if only six federal subsidies that the US government previously reported to G20 were considered. Alternatively, the effect on expected returns would be less—about 11% and 18%, respectively, for oil and gas fields—if we excluded four subsidies for which there could be substantial differences of opinion on what the unsubsidized practice should be. Regardless, the excluded items could benefit from further scientific, economic, and legal research to clarify the counterfactual and, by extension, extent of each subsidy.
Overall, our results and approach can help to advance research methods for evaluating the effects of fossil fuel subsidies and their reform. For example, while several globally focused efforts have catalogued and quantified fossil fuel subsidies, relatively few have performed detailed, field-level analyses to evaluate how different government support measures may individually and in combination influence investment decision-making and profitability of fossil fuel projects [62]. Moreover, 'bottom-up' insights drawn from field-level cost information, like we do here, are important for developing more nuanced and accurate approaches to representing fossil fuel supply in 'top-down' national and global energy-economic models. Currently, most widely used integrated assessment models do not consider these types of 'real world' investment dynamics in oil and gas fields, and may therefore be under-estimating the potential contribution of fossil fuel subsidy repeal to the attainment of the emission-reduction goals of the Paris Agreement [25]. As our study reveals, fossil fuel subsidy repeal and associated increases in investor risk perceptions could reduce fossil fuel supply and, as a result, greenhouse gas emissions. Our methods could be applied to other countries to increase public transparency and understanding of how specific fossil fuel subsidies are undermining efforts to pursue climate mitigation [25] and other sustainable development goals, such as those related to responsible production (SDG 13) [63] and to ensuring access to affordable, reliable, sustainable and modern energy for all (SDG 7).
Acknowledgments
The authors would like to thank Cara Bottorff and Jeremy Fisher (Sierra Club); Seth Shonkoff, LeeAnn Hill, and Dominic DiGiulio (PSE Health Energy); Ted Auch and Matt Kelso (FracTracker); Jeanne M VanBriesen (Carnegie Mellon University); Avner Vengosh (Duke University); Gretchen Goldman (Union of Concerned Scientists); Theron Horton (ARO Working Group); Regan Boychuck (Alberta Liabilities Disclosure Project); and Clark Williams-Derry (IEEFA) for helpful discussions about the data and methodology. We also thank four anonymous peer-reviewers for their constructive feedback. Support for this research was provided by the Schmidt Family Foundation and the Sierra Club.
Data availability statement
Source data for figure 1 can be found in supplementary data 1. The data that support other plots within this paper and other findings of this study are available from the corresponding author upon reasonable request. The raw data analyzed by the authors are available from Rystad Energy in their UCube database, but restrictions apply to the availability of these data, which were used under licence for the current study, and so are not publicly available. Raw data are available from the authors upon reasonable request and with permission of Rystad Energy.