

Abstract
Climate change and deforestation have increased the risk of drought-induced forest-to-savanna transitions across the tropics and subtropics. However, the present understanding of forest-savanna transitions is generally focused on the influence of rainfall and fire regime changes, but does not take into account the adaptability of vegetation to droughts by utilizing subsoil moisture in a quantifiable metric. Using rootzone storage capacity (Sr), which is a novel metric to represent the vegetation's ability to utilize subsoil moisture storage and tree cover (TC), we analyze and quantify the occurrence of these forest-savanna transitions along transects in South America and Africa. We found forest-savanna transition thresholds to occur around a Sr of 550–750 mm for South America and 400–600 mm for Africa in the range of 30%–40% TC. Analysis of empirical and statistical patterns allowed us to classify the ecosystem's adaptability to droughts into four classes of drought coping strategies: lowly water-stressed forest (shallow roots, high TC), moderately water-stressed forest (investing in Sr, high TC), highly water-stressed forest (trade-off between investments in Sr and TC) and savanna-grassland regime (competitive rooting strategy, low TC). The insights from this study are useful for improved understanding of tropical eco-hydrological adaptation, drought coping strategies, and forest ecosystem regime shifts under future climate change.
Export citation and abstract BibTeX RIS

Original content from this work may be used under the terms of the Creative Commons Attribution 4.0 license. Any further distribution of this work must maintain attribution to the author(s) and the title of the work, journal citation and DOI.
1. Introduction
Rainforests, not only host vast biodiversity, but they are also essential in stabilizing the Earth's climate by sequestering carbon dioxide [1] and maintaining the global water cycle (e.g. [2]). However, global warming and deforestation are causing rising trends in drought frequency, severity, and duration. These trends further threaten the rainforests' ecological integrity and biodiversity [3, 4], increasing the risk of triggering self-amplified forest loss [5–7].
Understanding the coping strategies in the rainforest ecosystem to water-stress (defined here as a deficit in soil water availability inhibiting plant growth) and droughts are important for understanding forest-savanna transition risks [8]. To cope with this water deficit, forest and savanna ecosystems adopt an array of strategies [9], such as adjusting water demand [10], growth rates [8], hydraulic safety margins (stem hydraulics [11] and stomatal conductance [12]) and rooting strategies [13, 14] or combinations of these. Among them, differences in root morphology are heavily dependent on the available subsoil moisture [15] that is stored from surplus water during the wet season and used by the vegetation in the dry season and during droughts [16, 17]. Naturally, however, the subsoil moisture accessible to vegetation during the dry season is not defined by wet season's rainfall alone, but also by how that moisture is actually stored, transmitted, lost and accessed by the vegetation present [18, 19]. Some studies have analytically suggested a trade-off in terms of carbon expense and potential water availability benefits from above- and below-ground biomass investments for rainforest and savanna ecosystems (e.g. [20, 21]). These investments occur both as a part of evolutionarily developed strategies of ecosystems [22], and in response to environmental triggers (e.g. [10, 11, 13]). However, on a continental scale, evidence of water-stress driven above- and below-ground forest dynamics based on observational data (including remote sensing) is still lacking.
The aim of this paper is to analyze the water-stress and drought coping strategies along rainforest-savanna transects in South America and Africa by studying how ecosystems with different tree cover densities utilize the subsoil water storage using remote-sensing based 'rootzone storage capacity' [23–25]. Maximum rooting depth [26] data will be used to validate the findings and provide insights in dynamic rooting response and subsoil hydraulic structure. This analysis will permit us to identify different types of drought coping strategies that forest and savanna ecosystems employ to maximize their hydrologic benefit (i.e. maximize water uptake and minimize water loss) from their water resources by diverting biomass investments into their above and below-ground structures.
2. Methods
2.1. Data and study area
Observation-driven (including remote sensing) data of evaporation and precipitation were selected to derive rootzone storage capacity (see section 2.2). Evaporation is defined here as the total of the evaporative fluxes from soil moisture, interception, transpiration and open water [27]. We selected data that were free from prior assumptions of biome dependent parameterization and soil layer depth. Daily precipitation was obtained from measurements of the Climate Hazards Group InfraRed Precipitation with Station data (CHIRPS) at 0.25° resolution for the years 2001–2012 [28]. In the remainder of the manuscript, we will refer to this data as rainfall because, in the tropics, rainfall is by far the dominant form of precipitation. Monthly evaporation estimates were obtained for the same period from three datasets: (1) Breathing Earth System Simulator (BESS) at 0.5° resolution [29], (2) Penman-Monteith-Leuning (PML) at 0.5° resolution [30] and (3) FLUXCOM-RS [31] at 0.083° resolution. All evaporation datasets were interpolated to 0.25° resolution using nearest neighbor (for BESS and PML) and spatial average (for FLUXCOM-RS). We computed equally-weighted ensemble evaporation to minimize any potential bias. ERA5 daily evaporation [32] at 0.25° resolution was used to downscale monthly evaporation to a daily resolution. These evaporation datasets were either derived from remotely sensed observations or validated against observational evaporation values from FLUXNET sites [29–31].
Remotely-sensed MOD44B (Version 6) annual tree cover (TC) data at 250 m resolution [33] was used to analyze the forest-savanna transitions in South America and Africa. TC represents the above-ground canopy cover in a pixel (%), and is not to be confused with seasonal dynamics of leaf phenology. This TC data was spatially aggregated to 0.25° resolution for the period of 2001–2012 (figure 1(a)). To minimize the human influence on the natural water cycle, we removed grid cells with croplands and pastures greater than 30% based on the data in Foley et al [34] (at 0.083° resolution), as well as human-influenced and non-terrestrial land cover classes from the International Geosphere-Biosphere Program (IGBP) land classification [35] (at 1 km resolution). Removed classes include 'permanent wetlands', 'urban and built-up lands', 'snow and ice' and 'water bodies'. These datasets were also spatially interpolated to 0.25° resolution. Three other datasets related to water table depth [36], rooting depth [26], and ecoregions [37] were used to further support our analysis.

Figure 1. South American and African spatial distribution of (a) mean tree cover (2001–2012) and (b) rootzone storage capacity (2001–2012 with a 20 year drought return period). The black straight lines in (a) depict the forest-savanna-grassland transects analyzed (see figures 2 and 3). This research focuses on vegetation influenced by natural water-cycle and the spatial distribution of tree cover and rootzone storage capacity with human influence on water-cycle filtered (see section 2.1) is shown in figure S1 (available online at https://stacks.iop.org/ERL/15/124021/mmedia).
Download figure:
Standard image High-resolution image2.2. Estimation of rootzone storage capacity
Rootzone storage capacity (Sr) is the maximum amount of soil moisture that can be accessed by vegetation for transpiration [23]. Plants can increase Sr by expanding their roots in the soil laterally as well as vertically. We adapted the mass-balance methodology in Wang-Erlandsson et al [25] to estimate Sr from the maximum annual accumulated water deficit, which was calculated using daily estimates of rainfall and evaporation (see section S1 and equations 1–3 in supplementary information). This methodology is based on the assumption that ecosystems do not invest in expanding their storage capacity more than necessary to bridge the water-deficit experienced by the vegetation in dry periods (i.e. periods in which evaporation is greater than rainfall, irrespective of the seasons). Since remote-sensing based time series of evaporation and rainfall were assumed to reflect the actual soil moisture availability [25, 38], we can use them to derive the capacity of ecosystems to store water in their rootzone for use during dry periods. A 20 year drought return period based on the Gumbel extreme value distribution (equation 4 in supplementary information) was used to calculate Sr (figure 1(b); equations 5–7 in supplementary information). We acknowledge that forests typically adapt their Sr to drought return periods of >40 years, savannas for 10–20 years and grasslands to <10 years [23–25]. However, rather than assigning different drought return periods to different land cover types (forest, savanna and grassland), we chose a uniform 20 years drought return period (following [39]) in order to avoid artificially introduced Sr transitions between landscapes.
While being primarily dependent on climatic factors [23], we also acknowledge that Sr of an ecosystem is also dependent on geology such as soil depth to bedrock which could physically limit Sr and soil properties such as field capacity requiring roots in sandy soils to root deeper to achieve the same Sr. However, their strong dependence on climate provides a similar or better representation of hydrological regimes than the soil-derived Sr [23, 24]. Moreover, since Sr derived in this study only represents the hydrological storage capacity of the root zone, the relation with the ecosystem's rooting depth or rooting structure thus depends on several factors. However, maximum rooting depth data [26] and existing literature were used to interpret the subsoil dynamics of the rainforest-savanna ecosystem (see section 3.3).
2.3. Defining the transects
We chose six representative transects following the longest possible transition line from the densest part of the rainforests all the way into the savannas and grasslands (figure 1(a)). To reduce any local signal noise and regional spatial heterogeneities, we applied a second-order polynomial based on the Savitzky–Golay smoothing technique [40] over a window of seven grid cells along the transects. Transect methods have proven to be able to clearly distinguish spatial trends in what seem to be heterogeneous ecological patterns at first sight (e.g. [41, 42]).
2.4. Classification of drought coping strategies
We classified the drought coping strategies of the ecosystem based on the transitions along the transects, defined using states and trends therein of empirical and statistical proxies. The empirical characteristics were based on the inspection of the trend and magnitude of TC and Sr. The statistical characteristics were based on the correlation coefficient, covariance (equation 11 in supplementary information) and confidence interval (CI; 95% CI across time) between TC and Sr. A moving window of seven grid cells was selected for statistical characterization along the transect.
3. Results and discussion
3.1. Tree cover and rootzone storage capacity
The western part of the Amazon has the lowest Sr (<100 mm) with a high TC (>75%) (figure 1). In contrast, an increasing trend of Sr can be observed from the eastern part of the Amazon until the north-eastern and central-western region of Brazil with a consecutive decrease in TC estimates. However, the magnitude of Sr starts to decrease again when moving towards the far eastern part of South America or south of 15°S. In Africa, the southern extent of the Congo rainforest has the lowest Sr (<100 mm) with the highest TC (>70%). Moreover, Sr is higher at lower TC towards the Southern African savanna (around 15°S). Further southwards (<20°S) or northwards (>10°N), the Sr estimates are, however, lower again. These patterns indicate that there is no monotonic relationship between TC and Sr, as will be analyzed in further detail in section 3.2.
3.2. Evaluating the South American and African transects
The transects generally reveal non-linear and non-monotonic relationships between Sr and TC in South America (figure 2) and Africa (figure 3). At the start of transects #1–6, at TC > 70%, Sr tends to be around 100 mm and remains unchanged along the transect. Following the transects towards the relatively lower TC regions (somewhat climatologically drier), Sr starts to increase strongly relative to only a minor decrease in TC. Only after the increase of Sr, we observe a sharp decline in TC with only a small increase in Sr . After a certain point beyond which Sr, however, does not further increase. Instead, both TC and Sr start to decline simultaneously (figures 2 and 3). This point indicates the region of forest-savanna transition.
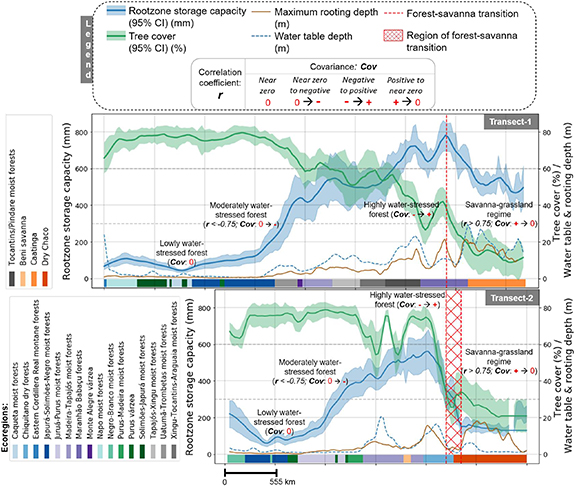
Figure 2. Change in rootzone storage capacity and tree cover in South America across transect #1 and #2 (figure 1(a)). Ecoregions [37] are defined across the bottom of the individual panels to identify regional species evolution and transition along the transects. The transects start from the densest part of the forest (left) and end towards the lowest tree cover (right). Details of the statistical characteristics are given in figure s4. Details on classification criteria into 'lowly water-stressed', 'moderately water-stressed' and 'highly water-stressed' forest as well as 'savanna-grassland regime' are given in table 1.
Download figure:
Standard image High-resolution image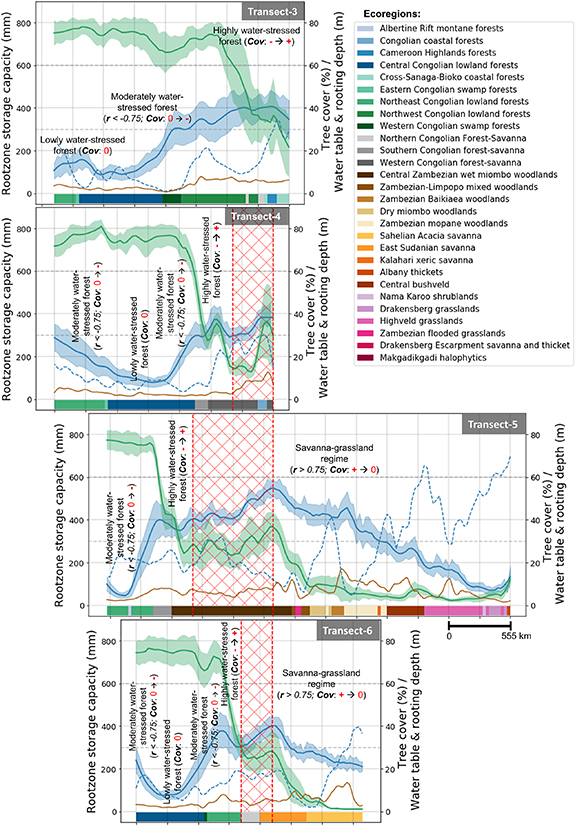
Figure 3. As in figure 2 (including legend), for African transects #3–6 from figure 1(a). Note that transects #5 and #6 are without the croplands and pastures filtering (see section 2.1). Supporting statistical analysis is given in figure S5.
Download figure:
Standard image High-resolution imageIn South America (figure 2), Sr of both transects maximizes just before or at the forest-savanna transition zone. The maximum Sr is around 750 mm for the Maranhão Babaçu forests (in transect #1), whereas, for the Madeira-Tapajós moist forests (in transect #2), it was around 550 mm. These differences are likely to be caused by the higher seasonality in rainfall (figure S2) in the Maranhão Babaçu forests (transect #1). Sr and TC, both decrease after the forest-savanna transition, which happens gradually towards Caatinga (Sr until about 500–600 mm in transect #1), and quite abruptly towards Dry Chaco (Sr until about 125–200 mm in transect #2). The higher Sr in Caatinga can be explained by the vegetation responding to a higher temperature during the peak dry-season, which causes high potential evaporation rates and ∼75% of the annual rainfall is being evaporated [43]. The rainfall seasonality is also much stronger in Caatinga compared to Dry Chaco (figure S2), which is caused by the larger influence of the Intertropical Convergence Zone (ITCZ) and Atlantic sea surface temperatures [44].
In Africa (figure 3), the changes along the transect are similar to those observed in South America. Starting again from high TC (>70%), we find that it corresponds with a minimum Sr of about 100 mm. Sr increases to around 400 mm before the forest-savanna transition (transects #3–6). The highest Sr of around 550 mm is, however, found in the Central Zambezian wet Miombo woodlands (transect #5), which is probably due to high evaporative demand and high rainfall seasonality (figure S3) due to the ITCZ (e.g. [45]).
Before the forest-savanna transition, a gradual increase in maximum rooting depth with increasing Sr is observed. However, it remains mostly unchanged (on average with a lot of spatial variabilities) when Sr starts to decrease after the forest-savanna transition (figures 2 and 3). The low values of Sr in savannas are paradoxical as savanna trees are known to have deep roots [46]. However, this analysis shows that those deep roots are not representative of the subsurface water accessible to the ecosystem per unit area (i.e. Sr), which will be further discussed in section 3.3.
The two continents show a difference in Sr along the transects. This difference is smaller for the denser part of the forest (i.e. at >65% TC, the maximum Sr is around 350–400 mm for South America and 300–350 mm for Africa) compared to forests with lower TC (i.e. maximum Sr around 550–750 mm for South America and 400–600 mm for Africa at 30%–40% TC). These differences can be explained by the ecosystem's adaptability to seasonal moisture carryover capacity (i.e. high wet-season rainfall in South America (figure S1) allows for more water storage for the dry-season) [47] and high water use efficiency (i.e. carbon uptake per unit water loss through transpiration) of African forest [48]. We think that the abundance of the high water use-efficient C4 grasses in African forest and savanna [49] further reduces the competition for moisture uptake in the African ecosystems. Similar to the findings of Guan et al [47], these Sr differences indicate a high buffer capacity of the Amazonian rainforest and a low buffer capacity of the African rainforest, making the latter more sensitive to droughts [50].
3.3. Drought coping strategy classes
In order to define distinct drought coping strategy classes, we analyzed the drought-induced forest dynamics (above- and below-ground) for different TC and Sr relations. We categorize the drought coping strategies into four classes (table 1) based on the empirical (table 1; figures 2 and 3) and statistical analysis (table 1; figures S4 and S5). Furthermore, we synthesize responses between TC and Sr not only in terms of absolute magnitude but also based on the spatial trends of TC and Sr (figure 4). Moreover, we link our findings with the existing literature in the following paragraphs to provide support for our classifications.

Figure 4. The transition of vegetation from the lowly water-stressed forest with high tree cover to a savanna-grassland regime with low tree cover and the utilization of rootzone storage capacity to cope with the spatial change to a drier climate. Precipitation (i.e. rainfall; P) and evaporation (E) arrows describe the relative magnitude of these moisture fluxes for each forest class (described in table 1). The line plot below describes the physical state of change in rootzone storage capacity and tree cover.
Download figure:
Standard image High-resolution image
Table 1. Key characteristics of drought coping strategy classes. The quantification of term 'water-stressed' in the class name represents both quantified magnitude and duration of water-deficit experienced by vegetation which can inhibit plant growth, as well as the probability of them transitioning to a savanna-grassland regime (see section3-3).
| Class name (main characteristics) | Empirical characteristics | Statistical characteristics | Eco-hydrological structure and drought coping strategy |
|---|---|---|---|
| Lowly water-stressed forest (shallow roots, high TC) |
Magnitude:
|
Correlation coefficient:
|
Forest structure:
|
| Moderately water-stressed forest (investing in Sr, high TC) |
Magnitude:
|
Correlation coefficient:
|
Forest structure:
|
| Highly water-stressed forest (trade-off between investments in Sr and TC) |
Magnitude:
|
Correlation coefficient:
|
Forest structure:
|
| Savanna- grassland regime (competitive rooting strategy, low TC) |
Magnitude:
|
Correlation coefficient:
|
Forest structure:
|
3.3.1. Lowly water-stressed forest
At high TC, the forest receives ample rainfall, and evaporation is lower than rainfall for all months of the year and for all years, thus there is little water-stress (figures S2, S3 and 4). Moreover, the soil is often covered with litter and shaded by trees and high relative humidities in the understory of the forest [50], thus preventing soil evaporation from significantly contributing to total evaporation [51]. Since the top layer of the soil is mostly damp, water uptake in this part of the forest can easily be facilitated using shallow roots [52] (figures 2–4) as trees prefer the moisture to move from the shortest available pathway [51].
3.3.2. Moderately water-stressed forest
Here we find a near-equal TC (75%–65%) and near-equal evaporation compared to the lowly water-stressed forest, but lower overall rainfall or stronger rainfall seasonality (figures S2 and S3). Studies have suggested that during droughts, the primary response of trees is to reduce their photosynthetic activities (by increasing stomatal resistance) and as an effect conserve moisture [9, 11]. During severe or multi-year droughts, however, the wet season rainfall alone is not sufficient to completely replenish the soil moisture at shallow depths (<1 m) for the whole dry period [53]. Therefore, this part of the rainforest, compared to the lowly water-stressed forest, has to invest in more lateral [54] or deeper roots [52] (figures 2–4), creating enough Sr to buffer the experienced water deficit for the dry season [51, 55]. Moreover, the rainforest species optimize their rooting structure in such a way that they access rainwater that has infiltrated to the deeper soil layers [56]. This stored moisture is used to sustain high transpiration rates in the dry season, which is enhanced by the concept of vertical moisture transfer referred to as 'hydraulic redistribution' [56]. The moderately water-stressed forest is characterized by the fact that the below-ground investment does not come at the cost of the above-ground ecosystem structure as nearly the same TC is maintained.
3.3.3. Highly water-stressed forest
With further declining rainfall and increasing water-stress (figures S2 and S3), the trees try to further maximize their Sr (figure 4). However, the ecosystem in this class is characterized by a much lower above-ground biomass (i.e. a significant decrease in TC; figures 2 and 3) compared to the moderately water-stressed forest. Individual trees in a water-stressed forest might respond to droughts by shedding leaves in order to avoid water loss through transpiration as allocating more biomass to roots can be highly expensive for trees [9]. Although this seems favorable for the trees, reduced photosynthetic activity can lead to declines in stem [57] and root growth [8, 21], and could lead to tree mortality due to hydraulic failure after certain extreme droughts [58]. The leaf shedding also makes the forest vulnerable to fires, causing tree mortality at a much grander scale [59]. We, therefore, think that the individual or combined impacts of the maximum rooting extent of individual vegetation species [60, 61], geological factors that limit the roots to further expand into subsurface resources [62], hydraulic failures [11, 12] and increased susceptibility to forest fires [59] lead to low TC open forest ecosystems, which are highly susceptible to a forest-savanna transition [55].
3.3.4. Savanna-grassland regime
This regime has less TC and a groundwater table at greater depth compared to the forest classes (figures 2 and 3). We find that the drought coping strategy of the individual vegetation species is contrasting and competitive [46, 63, 64]. To utilize the subsoil moisture to cope with episodic changes in water availability, the tree species in this ecosystem tend to have deeper roots [55, 64, 65], but the ecosystem as a whole can have a similar Sr compared to all the different forest classes (figures 2 and 3). Despite some tree species having very deep roots to survive, the root biomass for this ecosystem is mostly concentrated in the shallow portion of the soil (top 30–50 cm), where most roots of the shrubs and grasses are present [46, 63, 64] (figure 4). The woody vegetation in this ecosystem survives by allocating carbon among its components (stem and roots) in the cheapest way possible, to maximize moisture accessibility [14], while maintaining a limited photosynthetic exchange. In contrast, grass species become dormant during the dry season, reducing transpiration significantly, but have a shallow rooting system in place to quickly regenerate in the following wet season [66]. The ecosystem is vulnerable to frequent fires during regular dry periods because of the discontinued tree structure and abundance of grasses acting as a fuel [59]. These factors in turn again affect the above- and below-ground vegetation dynamics creating an interplay between water and fire stress in biomass partitioning [14].
3.4. Forest-savanna transition region compared to ecoregions
Our classification and identified regions of forest-savanna transition (red dashed lines and red hatched regions in figures 2 and 3) correspond well with the ecoregions [37]. For transects #1 and #2, the forest-savanna transition falls in the Maranhão Babaçu forests and Chiquitano dry forests, respectively. Both these ecoregions are very close to Caatinga and Dry Chaco characterized by a much drier climate and fire stress. This climate-fire feedback on vegetation may push and maintain the ecosystem in a savanna state [67, 68]. However, a clear transition could not be defined for transect #3 due to lack of a strong statistical signal, but for transect #4 a significant portion of the transition region lies on the Western Congolian forest-savanna. This is identical for transects #5 and #6, where the transition zones lie in the Central Zambezian wet miombo woodlands and Northern Congolian forest-savanna ecoregions, respectively.
4. Implications and uncertainties
4.1. Implications invoking the space-for-time assumption
In the absence of longer time-series of observed historical climatological and ecological data for rainforests, the 'space-for-time' assumption is often used to infer temporal ecological trajectories from available spatial patterns [69]. An application of the 'space-for-time' assumption on a bundle of transects (figures 2 and 3), each representing a unique climatological and ecological succession, could help us infer potential changes in Sr, TC and drought coping strategy class with changes in climate. Given future intensification of droughts and lower access to water availability, ecosystems could be pushed into drier drought coping strategy classes (figures 2–4). Most relevant in this context are the regions of highly water-stressed forests as those regions are most likely to exhibit a transition to a savanna state. The observed moderate-high variance in Sr and TC for highly water-stressed forest (figures 2 and 3, table 1), further supports the interpreted vulnerability towards a savanna transition [70]. Such a climate-induced vulnerability may be aggravated by deforestation [4] and local water usage for irrigation [71], which may trigger an even earlier transition. Moreover, the simultaneous occurrence of all observed factors may further reinforce a forest loss-drought feedback [4] into self-amplified forest mortality [7] and thus trigger abrupt large-scale regional changes. The fatality of such changes might be amplified when it appears that these changes cannot easily be reversed [55, 67, 72].
4.2. Data uncertainty
The present study uses an ensemble product of three independent evaporation datasets (BESS, FLUXCOM-RS, PML; see section 2.1) to minimize the single product bias. Conducting a sensitivity analysis (figures S6 and S7) resulted in a concurring magnitude of Sr along the lowly water-stressed, moderately water-stressed and highly water-stressed forest classes. In contrast, significant differences were observed in the savanna-grassland regime: Sr FLUXCOM-RS is the highest, while estimates from Sr BESS and Sr PML were found to be similar to Sr. Since soil moisture is dependent on evaporation (see section 2.2), the different evaporation datasets used reflect a different soil moisture constraint. Sr from FLUXCOM-RS corresponds to a higher soil moisture availability (high FLUXCOM-RS evaporation) than BESS and PML in arid and semi-arid regions (figures S6 and S7), thus signifying a high uncertainty of the Sr estimate in the savanna-grassland regime. Jung et al [31] suggested that the reason for high FLUXCOM-RS evaporation fluxes (15%–20% greater than multi-tree ensemble (MTE) and LandFlux-EVAL) could be the choice of machine learning methods or poor constraints by flux tower stations in the arid and semi-arid regions. Despite these differences, we found that when we use any of the three individual evaporation products, it does not have any or very little influence on the location/region where we found the forest-savanna transition. The main conclusions drawn from the study do, therefore, not depend on the dataset used.
5. Conclusions
Using multiple transects in South America and Africa, we analyzed the relationship between TC and Sr. Empirical and statistical observations allowed us to classify tropical and subtropical ecosystems into four classes with different drought coping strategies: lowly water-stressed forest, moderately water-stressed forest, highly water-stressed forest and savanna-grassland regime. Based on this analysis, we conclude that forests subsequently invest in their rooting strategy and modify their above-ground forest cover in response to the water-stress experienced by it. These responses are focused towards allocating carbon in the most efficient way possible to maximize their hydrologic benefit.
The currently lowly water-stressed forest areas with low Sr may need to start investing in their root system if a changing hydroclimate brings more frequent droughts, less rainfall, or larger rainfall variability, eventually changing into a moderately water-stressed forest. Excessive water-stress might force a moderately water-stressed forest to minimize its moisture loss (shedding leaves) while maximizing its Sr, transforming the ecosystem into a highly water-stressed forest. Although TC in a highly water-stressed forest is decreasing with increasing stress, the overall Sr is still increasing. However, there appears to be a ceiling to Sr investments, after which TC and Sr decrease simultaneously, signifying the transition from a forest into a savanna state. We quantified the Sr thresholds of forest-savanna transition to be around 550–750 mm (for South America) and 400–600 mm (for Africa) at a TC of about 30–40%. Eventually, a water-stressed forest ecosystem could shift to a savanna-grassland ecosystem, which could be triggered by one or more extreme droughts during which further Sr investments come at the cost of more susceptibility to fires and tree mortality. Compared to South America, low moisture carryover capacity and high water-use efficiency (due to the abundance of C4 grasses) in Africa might be the reason for a lower Sr threshold. In contrast to forests, the savanna-grassland regime tends to follow a competitive drought coping rooting strategy among tree and grass species: Sr is mostly concentrated at shallow depths, but during droughts, in the absence of easily accessible moisture, trees survive by having some deep roots, whereas, grasses become dormant.
We conclude that the TC-Sr relationship is analytically robust because of its detailed and spatially consistent representation of ecosystem dynamics and good correspondence with the ecoregions defined by Dinerstein et al [37]. Moreover, maximum Sr represents a quantified threshold to which ecosystems can invest and expand before a possible savanna transition. This concept can be further explored to improve our understanding of forest resilience and to predict future regime shifts in the tropics.
Acknowledgments
We thank Arie Staal for providing feedback on the manuscript. We would also like to acknowledge ECMWF for providing ERA5 data through their Climate Data Store (https://cds.climate.copernicus.eu). CS, LWE, IF and JR acknowledge funding from the European Research Council (ERC) project on Earth Resilience in the Anthropocene (ERA), project number ERC-2016-ADG 743080. LWE also acknowledges funding from Formas, project number 2019-01220. RE acknowledges funding from the Netherlands Organization for Scientific Research (NWO), project number 016.Veni.181.015.
Data availability statement
The rootzone storage capacity data and other materials supporting the findings of this study are accessible on Github at https://github.com/chandrakant6492/Drought-coping-strategy. Other openly available datasets can be accessed at (i) P-CHIRPS: https://data.chc.ucsb.edu/products/CHIRPS-2.0/ (ii) E-BESS: ftp://147.46.64.183/ (iii) E-FLUXCOM: ftp.bgc-jena.mpg.de (iv) E-PML: https://data.csiro.au/collections/#collection/CIcsiro:17375v2 (v) Tree cover (MOD44B_v6): https://lpdaac.usgs.gov/products/mod44bv006/ (vi) Cropland and pasture land: www.earthstat.org/cropland-pasture-area-2000/ (vii) IGBP land cover: https://developers.google.com/earth-engine/datasets/catalog/MODIS_051_MCD12Q1
(viii) Water table depth: https://aquaknow.jrc.ec.europa.eu/content/global-patterns-groundwater-table-depth-wtd (ix) Rooting depth: https://wci.earth2observe.eu/thredds/catalog/usc/root-depth/catalog.html (x) Ecoregions: https://ecoregions2017.appspot.com/