

Abstract
Changes in the East Asian summer monsoon (EASM) during the mid-21st century relative to present day are simulated in two related models GOML1 and GOML2. Both models are the atmospheric components of two state-of-the-art climate models coupled to a multi-level mixed-layer ocean model, following the RCP 4.5 scenario. Both show that the EASM is enhanced due to the amplified land-sea thermal contrast. Summer precipitation over northern China is projected to increase by 5%–10% in both models mainly driven by enhancement of the monsoon circulation. Over south-eastern China the two models project different signs of precipitation change: a decrease in GOML1 with the maximum of about −1.0 mm d−1 and an increase in GOML2 with a maximum of around 1.0 mm d−1. Though the thermal effect of climate warming leads to a projected increase in precipitation over south-eastern China in both models, circulation changes are opposite and dominate the precipitation response. This indicates that uncertainty in changes in projected precipitation largely arises from uncertainly in projected circulation changes. The different circulation changes in the two models are likely related to differences in projected Sea Surface Temperature (SST) in the Western tropical Pacific and North Pacific. In GOML1, the SST warming in the tropical Pacific is associated with an anomalous local Hadley circulation, characterized by anomalous ascent in the tropics and southern subtropics, and anomalous descent with less precipitation over south-eastern China. In GOML2, the large decrease in the meridional SST gradient between the South China Sea and Western North Pacific is associated with an anomalous local Hadley circulation with anomalous ascent at 20°N–30°N and anomalous descent at 5°N–15°N, leading to an anti-cyclonic circulation anomaly over the South China Sea and increased precipitation over south-eastern China.
Export citation and abstract BibTeX RIS

Original content from this work may be used under the terms of the Creative Commons Attribution 3.0 licence. Any further distribution of this work must maintain attribution to the author(s) and the title of the work, journal citation and DOI.
1. Introduction
The East Asian summer monsoon (EASM) provides about two-thirds of the annual precipitation for most regions of East Asia and its variation has important impacts on local infrastructure, agriculture, local water resources, and the global water cycle (e.g. Wang 2006). The EASM is influenced by many facets of the climate system, e.g. seasonal cycle of the solar radiation (Webster et al 1998), temperature and sea-level pressure gradients (Findlater 1974), circulation which transports moisture laden air from the ocean to feed convection (Pearce and Mohanthy 1984) and off-equatorial convective heating (Gill 1980, Annamalai and Sperber 2005). In the past half century, the EASM has experienced significant change with the south-westerly airflow reducing and the northward moisture transport weakening (Yu and Zhou 2007, Ding et al 2009). Since the mid-1990s, the anomalous precipitation distribution became a 'southern-flood northern-drought' pattern, i.e. below-normal precipitation in North China and above-normal precipitation in South China relative to the long term climatology (Ding et al 2008, 2009). Tian et al (2018) found that the anthropogenic forcing changes played an important role in these observed changes.
In future decades, greenhouse gas (GHG) concentrations are expected to increase, meanwhile, global mean atmospheric aerosols emissions will decrease throughout the remainder of 21st century and so unmask GHG warming (Westervelt et al 2015). Many studies indicate that in a warmer climate, the EASM will be enhanced (Kripalani et al 2007, Sun and Ding 2010, Feng et al 2011, Lee and Wang 2014, Chen and Bordoni 2016, Wang et al 2016). Based on 22 models of the IPCC AR4 with CO2 doubled, Kripalani et al (2007), found that the mean EASM circulation and the related monsoon precipitation increases and the rain season becomes longer. Based on one AGCM model, ECHAM5, Feng et al (2011) found that in the A1B scenario both annual mean precipitation and extreme precipitation increases significantly over south-eastern China. Rotstayn et al (2013) found that aerosol forcing also plays an important role in modulating the projected climate response. Due to the reduction of aerosols in 2100 relative to 2000, the summer mean land surface temperature is expected to increase by 1.7 K over the EASM region, and this amplifies the land-sea thermal contrast and strengthens the EASM, which in turn increases summer precipitation by about 10% over the East Asian monsoon region (Wang et al 2016).
Previous studies also reported considerable uncertainty in projected precipitation changes on regional scales, especially over East China (Trenberth et al 2003, Turner and Annamalai 2012, Ma and Xie 2013, Zhou et al 2017, Wang et al 2018). As demonstrated by Zhou et al (2017), 9 in 18 CMIP5 models projected an increase of precipitation over south-eastern China and the other half simulated a decrease in precipitation over this region. This uncertainty is mainly related to the tropical mean warming and the spatial deviations of Sea Surface Temperature (SST) warming from the tropical mean (Xie et al 2010). The uncertainty of SST warming affects the available moisture, circulation, and subsequently the precipitation (Sobel and Camargo 2011, Ma et al 2012). For example, the weakening of the mean zonal SST gradient in the equatorial Pacific may lead to a smaller increase in monsoon rainfall due to a regional perturbation of the Walker Circulation (Douville 2006). Models with a strong land-sea thermal contrast between the Eurasian continent and tropical Indian Ocean also simulate a strong increase in monsoon rainfall (Annamaliai et al 2007).
All above studies have used fully coupled general circulation models (CGCMs). However, these CGCMs have considerable computational cost and exhibit significant biases in the regional time-mean SST. For example, as stated by Wang et al (2014), in CMIP5 models the maximum of annual-mean SST error magnitudes can be several degrees Celsius. Additionally, the simulated SSTs are generally too high in the tropical south-eastern Pacific and too low in the equatorial and tropical south-western Pacific. To avoid the large SST biases and reduce the computational cost, this work uses two near-globally coupled models, that comprise the atmospheric components of two state-of-the-art climate models coupled to a multi-level mixed-layer ocean (Klingaman et al 2011, Hirons et al 2015). These models are computationally cheaper than fully coupled models. More importantly, they have smaller biases in simulated regional SST (within 0.5 °C) (Hirons et al 2015, Dong et al 2017, Luo et al 2018) in comparison with fully coupled models (e.g. Wang et al 2014) whilst also retaining intra-seasonal variability and coupling between the atmosphere and the ocean. However, these models cannot represent modes of variability that rely on dynamical ocean processes. Therefore, the effect of ocean dynamical changes on the EASM is not simulated in our experiments. Using two sets of experiments performed with these two models, this study addresses the following questions: what will be the changes in summer precipitation over East China in the near future? What are the relative roles of dynamics and thermodynamics in the projected precipitation changes? On regional scales, do the two models agree or disagree in projected precipitation changes? And what are physical processes that drive any differences?
The structure of this paper is as follows. Section 2 describes the model and experiments; section 3 investigates the projected precipitation changes and examines reasons for differences in the two models before concluding in section 4.
2. Model and experiments
2.1. Model
This work uses the models MetUM-GOML1 (hereafter: GOML1) and MetUM-GOML2 (hereafter: GOML2) (Hirons et al 2015): both are near-globally-coupled models that comprise the atmospheric components of two state-of-the-art climate models coupled to a multi-level mixed-layer ocean.
The atmospheric component for GOML1 is the Met Office Unified Model (MetUM) at the fixed scientific configuration Global Atmosphere 3.0 (GA3.0; Walters et al 2011). The atmospheric component of GOML2 is MetUM GA6.0 (Walters et al 2017). Comparing with GA3.0 used in GOML1, the largest change in GA6.0 is that the 'New Dynamics' dynamical core is replaced with 'ENDGame' (Wood et al 2014). The inclusion of the ENDGame dynamical core is an important upgrade to the Global Atmosphere configuration of the MetUM. ENDGame maintains the benefits of 'New Dynamics', whilst improving on its accuracy, stability and scalability. The improved accuracy significantly reduces the model's implicit damping, leading to a beneficial improvement in various modes of variability, such as the depth of extra-tropical cyclones and the structure of frontal systems. The resolution for both atmospheric models is 1.875° longitude and 1.25° latitude (N96) with 85 vertical layers. The models include an interactive tropospheric aerosol scheme which is able to simulate the direct, indirect, and semi-direct effects of aerosols (Jones et al 2011, Walters et al 2011).
The oceanic component of GOML1 and GOML2 is a Multi-Column K Profile Parameterization (MC-KPP) mixed-layer ocean model (Large et al 1994). The vertical resolution is 1.2 m at the surface, and less than 2 m over the first 41.5 m. The oceanic and atmospheric components are coupled once every 3 h via the Ocean Atmosphere Sea Ice Soil (OASIS) coupler (Valcke et al 2003). The atmospheric and ocean components are not coupled in regions of sea ice defined using the AMIP sea ice data set (Taylor et al 2012). Outside the coupled region, daily SST and sea ice climatologies are prescribed. More details on the oceanic component and the coupling are documented in Hirons et al (2015).
2.2. Experiments
The experiments performed in this study are summarised in table 1. We first performed a relaxation experiment (R0) for 12 years for each model, in which the temperature and salinity of the ocean (MC-KPP) are relaxed to a present day observed climatology (Smith and Murphy 2007). The relaxation experiment uses 1994–2011 average anthropogenic GHG concentrations and anthropogenic aerosol (AA) emissions (Lamarque et al 2010, 2011).
Table 1. Summary of numerical experiments.
| Experiment | Ocean | Radiative forcing | Simulation length | Abv |
|---|---|---|---|---|
| Relaxation run | Relax to present day (PD, 1994–2011) mean 3D ocean temperature and salinity to diagnose climatological temperature and salinity flux corrections | Climatological PD greenhouse gases (GHG) over 1994–2011 and anthropogenic aerosol (AA) precursor emissions over 1994–2010 with AA after 2006 from RCP4.5 scenario (Lamarque et al 2010, 2011) | 12 years | R0 |
| Coupled present day (1994–2011) experiment | Climatological temperature and salinity flux corrections from relaxation run | Climatological PD GHG and PD AA precursor emissions averaged between 1994–2011. | 50 years | PD |
| Coupled future period (2045–2055) experiment | Climatological temperature and salinity flux corrections from relaxation run | RCP4.5 emission scenario averaged between 2045 and 2055 | 50 years | FP |
Based on the relaxation experiment, seasonally varying 3D flux corrections for ocean temperature and salinity are diagnosed for each model. Then two sets of experiments are performed with the same prescribed 3D ocean temperature and salinity corrections. Two numerical experiments are carried out for each model: present-day (PD, 1994–2011) and future period (FP, 2045–2055). PD uses present day anthropogenic GHG concentrations and AA emissions averaged for 1994–2011. FP is driven with 2045–2055 average GHG concentrations and AA emissions from the RCP4.5. The changes in both GHG concentrations and AA emissions can change air-sea heat flux, and therefore lead to changes in SST and ocean heat content. However, different changes of air-sea heat flux in the two models could lead to different resulting SST patterns. The PD and FP simulations in each model started from the same initial conditions from the end of the corresponding relaxation run. The same set of simulations have been used to investigate projected changes of heat waves in China (Su and Dong 2019).
Relative to PD, GHG concentrations for FP under RCP4.5 scenario are higher, with CO2 increased by 30%, CH4 by 4.5%, and N2O by 10.4% respectively. AA emissions decrease with, in particular, sulphur dioxide concentrations decreasing by more than 50% over large areas of the North America and Eurasian continents (figure 1 of Su and Dong 2019). All experiments are run for 50 years and use the climatological PD sea ice extent from HadISST (Rayner et al 2003).
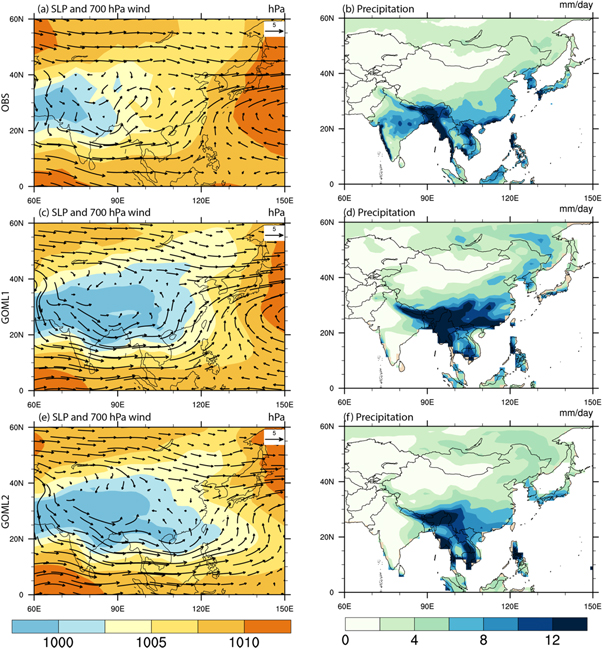
Figure 1. JJA climate for present day (1994–2011) SLP (units: hPa) and 700 hPa wind (units: m s−1) (left) and precipitation (units: mm d−1) (right) in observations (a), (b), GOML1 (c), (d) and GOML2 (e), (f) .
Download figure:
Standard image High-resolution imageThe last 45 years of each experiment are used for analysis (see table 1 for more details). We define the future changes as the difference between FP and PD experiment (FP–PD). Statistical significance of the mean changes in model experiments is assessed using a two tailed Student's t-test.
2.3. Model performance in simulating present day EASM
The biases of simulated present day SST distributions in both GOML1 (Dong et al 2017) and GOML2 (Luo et al 2018) are much smaller (typically between −0.5 °C and 0.5 °C) than in the CMIP5 ensemble (e.g. Wang et al 2014). To evaluate the performance of the models in simulating the EASM, the circulation and precipitation climatology over East Asia in GOML1 and GOML2 are compared with observations. Here we used the Climate Research Unit Precip 3.2 dataset (CRU) on a 0.5° × 0.5° grid (Mitchell and Jones 2005). The observed wind fields are from the NCEP/NCAR reanalysis version 1.0 on a 2.5° × 2.5° grid (Kalnay et al 1996). Observed sea level pressure (SLP) data are obtained from the Hadley Centre's monthly historical mean SLP data set (HadSLP2) at a horizontal resolution of 5° × 5° (Allan and Ansell 2006).
In observations, the subtropical anticyclone over the Western North Pacific is associated with a south-westerly wind along the southern and eastern coast of East Asia. The south-westerly wind converges with easterly winds from the tropical western Pacific in the monsoon trough and becomes a strong southerly (figure 1(a)). This southerly wind transports moisture to East Asia enhancing precipitation. Summer precipitation in China decreases with latitude with mean precipitation being more than 6 mm d−1 south of 30°N, but less than 2 mm d−1 north of 35°N (figure 1(b)).
The general features of the summer circulation field in observations are reproduced reasonably well by GOML1 (figure 1(c)) and GOML2 (figure 1(e)). The models also accurately capture the precipitation centres over the lower reaches of the Yangtze River (figures 1(d) and (f)). However, in GOML1, the precipitation is overestimated over northern India and eastern China, which may be related to the bias in simulating the monsoon trough. As shown in figure 1(c), GOML1 overestimates the westerly wind over the Indian Ocean and westerlies extend too far to the east into the Pacific, making the simulated monsoon trough deeper than in observations. Corresponding to the biases in circulations, the simulated precipitation over south-western China and Myanmar is stronger than observations. In contrast to the wet bias in GOML1, in GOML2 the simulated monsoon precipitation is weaker over East China, especially northeastern China. As shown in figure 1(e), the simulated Western North Pacific subtropical high (WNPSH) is weaker in GOML2 compared with observations, thus, the monsoon trough and related southerly wind from the South China Sea (SCS) are located farther east from the coast.
Despite some deficiencies, the differences between the atmospheric circulation of the EASM in GOML1 and GOML2 are at least representative of differences between CMIP5 models. The simulated precipitation and lower tropospheric circulation over East Asia are comparable with observations, which suggests that both GOML1 and GOML2 are appropriate tools to study the future changes in the EASM.
3. Projected future precipitation changes
3.1. Model simulated precipitation changes
GOML1 projects that precipitation will increase over northern China (30°N–50°N, 100°E–120°E) (figure 2(a)). The regional average increase is 0.41 mm d−1 with the maximum increase larger than 0.5 mm d−1, which is more than 10% of the PD mean precipitation and is statistically significant at the 10% level.
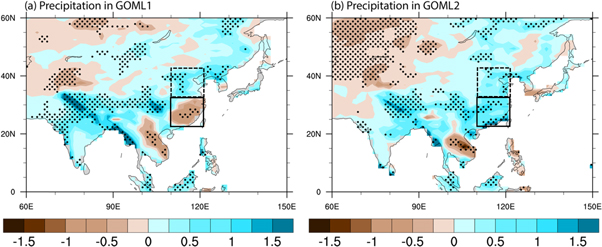
Figure 2. Spatial patterns of summer averaged future changes in precipitation (units: mm d−1) in (a) GOML1 and (b) GOML2. Dashed box indicates northern China (32°N–42°N, 110°E–120°E), solid box indicates South-eastern China (22°N–32°N, 110°E–120°E). Dots highlight regions where the changes are statistically significant at the 10% level using a two-tailed Student's t-test.
Download figure:
Standard image High-resolution imageThe increased precipitation over northern China is consistent with the increased land-sea thermal contrast driving enhanced circulation (figure 3(a)): the surface warming over the Asian continent is larger than over the surrounding ocean (Chou 2003). The increased zonal temperature gradient between the Asian continent and the Western Pacific Ocean enhances the zonal pressure gradient and leads to stronger southerly winds over eastern China around 110°E and easterly wind around 120°E, transporting more water vapour from the adjacent ocean to northern China (figures 3(b) and (c)). On the other hand, over south-eastern China (20°N−30°N, 110°E−120°E), the regional averaged precipitation decreases significantly by about 0.35 mm d−1 with the maximum above 1.0 mm d−1 (figure 2(a)). The decreased precipitation is related to the circulation anomalies: there is an anomalous low SLP centre at northern China (dashed box in figure 3(b)), thus, the surface pressure over south-eastern China (solid box in figure 3(b)) is relatively high, consistent with anti-cyclonic circulation anomaly of surface wind.

Figure 3. Spatial patterns of summer averaged future changes in (a), (d) Surface air temperature (units: °C), (b), (e) SLP (units: hPa) and 850 hPa wind (units: m s−1) and (c), (f) Present day precipitable water (units: kg m−2) in JJA in GOML1 (top) and GOML2 (bottom). Dashed box indicates northern China (32°N–42°N, 110°E–120°E), solid box indicates south-eastern China (22°N–32°N, 110°E–120°E). Coloured regions (a), (b), (d), and (e) indicate where the changes are statistically significant at the 10% level using a two-tailed Student's t-test while grey and white are insignificant regions over land and ocean.
Download figure:
Standard image High-resolution imageGOML2 also projects increased precipitation over northern China for about 0.43 mm d−1 (in figure 2(b)). However, in contrast to GOML1, over south-eastern China the regional averaged precipitation significantly increases by about 1.0 mm d−1. This difference is consistent with the circulation differences: in GOML2, the simulated SLP change over the SCS is higher than that in GOML1 (compare figures 3(b) and (e)), with an anti-cyclonic circulation anomaly over the SCS. The anomalous south-westerly flow on the northwest of the anti-cyclonic circulation anomaly transports more water vapour to southern China (figures 3(e) and (f)), leading to increased precipitation in GOML2.
Overall, this difference in the response of precipitation over south-eastern China to global warming reflects the large uncertainty in future precipitation change over the East Asian monsoon area, in particular related to the uncertainty in the projected circulation change. This is consistent with Zhou et al (2017) who found with 18 CMIP5 models that circulation changes contributed most of the uncertainty in projected future EASM rainfall.
3.2. What drives the changes in precipitation?
In order to explore the different processes that contribute to the future changes in precipitation, we analysed the changes of vertical integrated total moisture transport convergence  which is based on 6-hourly data. As shown in equation (1),
  can be decomposed into transport convergence based on monthly mean data
  and transport convergence in transient eddies (TE). To investigate the changes due to anomalous circulation and the part due to anomalous humidity, the monthly moisture transport convergence can be further separated into changes in dynamic component
  thermodynamic component
  and the quadratic term of covariance between changes in humidity and winds
  (Li et al 2015, Li and Ting 2017):

Here the difference between FP and PD is represented by  the dynamic components represented by
  involves only changes in circulation. The thermodynamic contribution represented by
  involves only changes in specific humidity.
The regional averaged changes in precipitation over south-eastern China and northern China are compared with changes in moisture transport convergence in figure 4. In GOML1 (figure 4(a)),  explains around 74% of the decreased precipitation over southern China and explains 60% of increased precipitation over northern China. In GOML2 (figure 4(b)),
  explains 95% of increased precipitation over south-eastern China with both
  and
and  being positive.
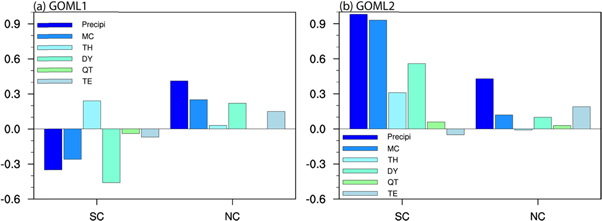
Figure 4. Changes of summer precipitation, moisture transport convergence (MC), thermodynamic component (TH), dynamic component (DY), quadratic term (QT), based on monthly mean data, and transient eddies (TE) averaged over south-eastern China (SC) and northern China (NC) in GOML1 and GOML2 (unit: mm d−1).
Download figure:
Standard image High-resolution imageThis indicates that changes in moisture transport convergence by monthly mean flow are predominantly responsible for the changes in precipitation over south-eastern China. However, over northern China, the precipitation changes show large differences from the moisture transport convergence based on monthly mean data. By analysing the different contributions from evaporation and transient eddies, we find that the changes in evaporation are very small (not shown), the differences between precipitation and moisture transport convergence based on monthly mean data are mainly from the impact of transient eddies (figure 4).
Over northern China, consistent with the changes in precipitation (figures 2(a) and (b)), both models show an increase in moisture transport convergence (figures 5(a) and (d)). This is mainly driven by the dynamical component ( ) related to the enhanced monsoon circulation due to amplified land-sea thermal contrast (figures 5(b) and (e)). In GOML1 (figure 4(a)), the regional averaged
  explain 88% of the increase in
  In GOML2 (figures 4(b)), the increase in
  is 83% of the
  Therefore, in both GOML1 and GOML2 the increased moisture transport convergence over northern China is dominated by the changes of the dynamical component
  related to the enhanced monsoon circulation.
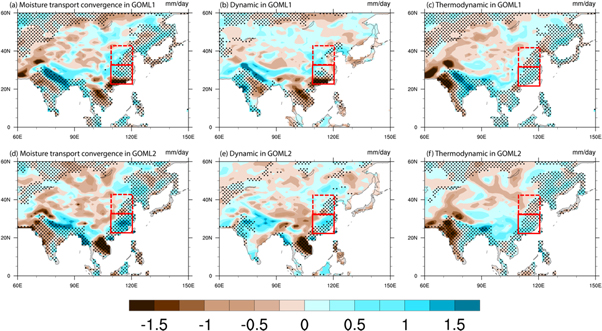
Figure 5. Spatial pattern of summer averaged future changes in (a), (d) vertical integrated moisture transport convergence (units: mm d−1), (b), (e) dynamic component (mm d−1) and (c), (f) thermodynamic component (mm d−1) in JJA in GOML1 (top) and GOML2 (bottom) based on monthly mean data. Dashed box indicates northern China (32°N–42°N, 110°E–120°E), solid box indicates south-eastern China (22°N–32°N, 110°E–120°E). Dots in (a), (d) highlight regions where the changes of specific humidity, horizontal wind at 850 hPa are statistically significant at the 10% level using a two-tailed Student's t-test. Dots in (b), (e) as (a), (d) but for changes of horizontal wind (u and v) at 850 hPa. Dots in (c), (f) as (a), (d) but for changes of specific humidity at 850 hPa.
Download figure:
Standard image High-resolution imageOver south-eastern China, the decrease of regional averaged  in GOML1 (figure 4(a)) is mainly driven by DY. In GOML2 (figure 4(b)), the area averaged
  is contributed from both
  about 60% which causes convergent anomalies over south-eastern China, and the
  by about 33%, which is caused by the increased moisture. This indicates that the inconsistency in projected precipitation over south-eastern China between GOML1 and GOML2 is largely due to the difference of the changes in circulation.
In summary, over northern China, the increased precipitation is driven by the enhanced monsoon circulation. This is consistent in both GOML1 and GOML2. Over south-eastern China, the thermodynamic component increases precipitation in both models. However, the changes of dynamic component are opposite, showing a decrease in GOML1 and an increase in GOML2, leading to the decreased precipitation in GOML1 and increased precipitation in GOML2. Therefore, the uncertainty of projected precipitation changes arises largely from differences in the projected circulation changes.
3.3. Differences between GOML1 and GOML2
As shown above, uncertainty in projected precipitation change is mainly due to uncertainty in how circulation changes. In GOML1, decreased precipitation over south-eastern China is located at the south of a low SLP anomaly over northern China (in dashed red box of figure 3(b)). Over southern China, the SLP is less negative (in solid red box of figure 3(b)). This is consistent with an anticyclonic circulation anomaly and related to less precipitation over south-eastern China. In GOML2, the increased precipitation over south-eastern China is related to a low SLP anomaly over south-eastern China and a related cyclonic circulation anomaly (in solid box of figure 3(e)). Therefore, to understand why the projected precipitation over south-eastern China is different in GOML1 and GOML2, our next question is why the SLP response in GOML1 over southern China is higher than that in GOML2?
In GOML1 the regional averaged precipitation is increased over the SCS (figure 6(a)). This is associated with the warming of SST due to global warming which induces more convection over the SCS. Although the mean SST is also increased in GOML2, the change of meridional SST gradient between the SCS and Western North Pacific (WNP) is much larger in GOML2 than in GOML1 (figures 6(c) and (d)).
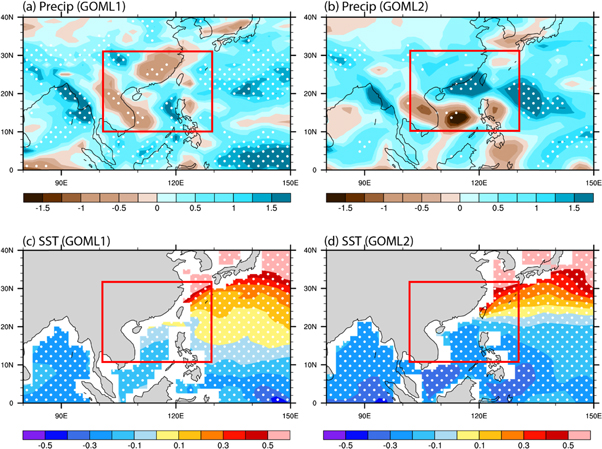
Figure 6. Spatial pattern of summer averaged future changes in (a), (b) precipitation (mm d−1) and (c), (d) SST change minus global mean SST anomaly (°C), in GOML1 (left), GOML2 (right). Solid box highlights the region most relevant to the precipitation changes over southern China. Dots indicate regions where the changes are statistically significant at the 10% level using a two-tailed Student's t-test.
Download figure:
Standard image High-resolution imageIn GOML1, the warming of SST in the tropical ocean is related to anomalous ascent in the tropical atmosphere and anomalous descent around 20°N (figure 7(a)), which is consistent with higher SLP and less precipitation over south-eastern China. In GOML2, however, the weakened meridional SST gradient between the SCS and WNP (figure 6(d)) is associated with an anomalous local Hadley circulation, characterized by anomalous ascent at 20°N–30°N and anomalous descent at 5°N–15°N (figure 7(b)). This anomalous local Hadley circulation is consistent with the lower SLP and enhanced precipitation over south-eastern China resulting from the anomalous ascent in GOML2.

Figure 7. Future changes of summer averaged zonal mean meridional stream function (colours, kg s−1 × 10¹⁰) and wind anomalies (arrows, m s−1 × 10⁻³ ) over region (30°S–60°N, 100°E–130°E) in (a) GOML1 and (b) GOML2. Dashed lines indicate the meridional stream function for PD experiment. Solid box indicates vertical circulation over region (10°N–30°N, 100°E–130°E). Dots highlight regions where the changes of stream function are statistically significant at the 10% level using a two-tailed Student's t-test.
Download figure:
Standard image High-resolution image
In summary, the differences in the projected circulation fields over south-eastern China in GOML1 and GOML2 are mainly due to different tropical SST anomalies particularly the changes in the meridional SST gradient. In GOML1, the warming of SST over the SCS enhances the local convection and weakens the local Hadley cell. The corresponding descending anomaly over south-eastern China is consistent with higher SLP and reduced precipitation.
In GOML2, however, the SST warming in the western tropical and North Pacific is non-uniform, which decreases the meridional SST gradient between the SCS and Western North Pacific. This large decrease in meridional SST gradient is associated with an anomalous local Hadley cell with anomalous ascent and increased precipitation over south-eastern China.
4. Conclusions
This work studied the changes in the EASM during the mid-21st century (FP, 2045–2055) relative to present day (PD, 1994–2011). To estimate uncertainty in the projected changes, this work analysed experiments based on two near-globally coupled models MetUM-GOML1 and MetUM-GOML2 following the RCP4.5 scenarios. The main results are:
- 1.The EASM is projected to be enhanced by the amplified land-sea thermal contrast leading to increased precipitation over northern China. However, over south-eastern China, the projected precipitation decreases in GOML1 and increases in GOML2.
- 2.Over northern China, the increase in precipitation is driven by the dynamic component, due to the enhanced monsoon circulation. Over south-eastern China, the thermodynamic components are increased in both models. However, the dynamic component decreases in GOML1 but increases in GOML2. Thus, uncertainty in projected precipitation changes arises mainly from differences in circulation changes.
- 3.The inconsistency of the projected circulation fields in GOML1 and GOML2 is related to differences in projected SST changes. In GOML1, the warming of SST over the tropical WNP enhances the convection and leads to an anomalous local Hadley circulation with the anomalous sink located over south-eastern China. The descending branch is associated with less precipitation over south-eastern China. In GOML2, the non-uniform SST warming reduces the meridional SST gradient between the SCS and WNP and this decrease is larger than in GOML1. This large decrease in meridional SST gradient is associated with an anomalous local Hadley cell with anomalous ascent over south-eastern China and increased precipitation in GOML2.
Our results are consistent with previous studies based on CMIP5 models, which indicate that in CMIP5 models, the uncertainty of projected EASM rainfall changes is dominated by the changes in EASM circulations (Zhou et al 2017). This work highlights that the changes of local circulation are very sensitive to the spatial patterns of SST warming. SST warming with different meridional gradients over the tropical Western Pacific may lead to different local circulations and different local rainfall changes. In our case, opposite changes in precipitation appear over south-eastern China in two models. This suggests a clear need to reduce the uncertainty of projected SST changes in climate models in order to reduce the uncertainty of projected precipitation over East Asia.
Acknowledgments
For this work, F T, B D, R S and S F B T were supported by the UK-China Research & Innovation Partnership Fund through the LOTUS project of the Met Office Climate Science for Service Partnership (CSSP) China as part of the Newton Fund. B D, J R, and R S were also supported by the UK National Centre for Atmospheric Science-Climate (NCAS-Climate) at the University of Reading. The authors would like to thank two anonymous reviewers for their constructive comments on the earlier version of the paper.